Comparative Study
. 2023 Apr;616(7958):814-821.
doi: 10.1038/s41586-023-05922-y. Epub 2023 Apr 12.

Ageing-associated changes in transcriptional elongation influence longevity

Affiliations
Comparative Study

Ageing-associated changes in transcriptional elongation influence longevity

Cédric Debès et al. Nature. 2023 Apr.

Abstract

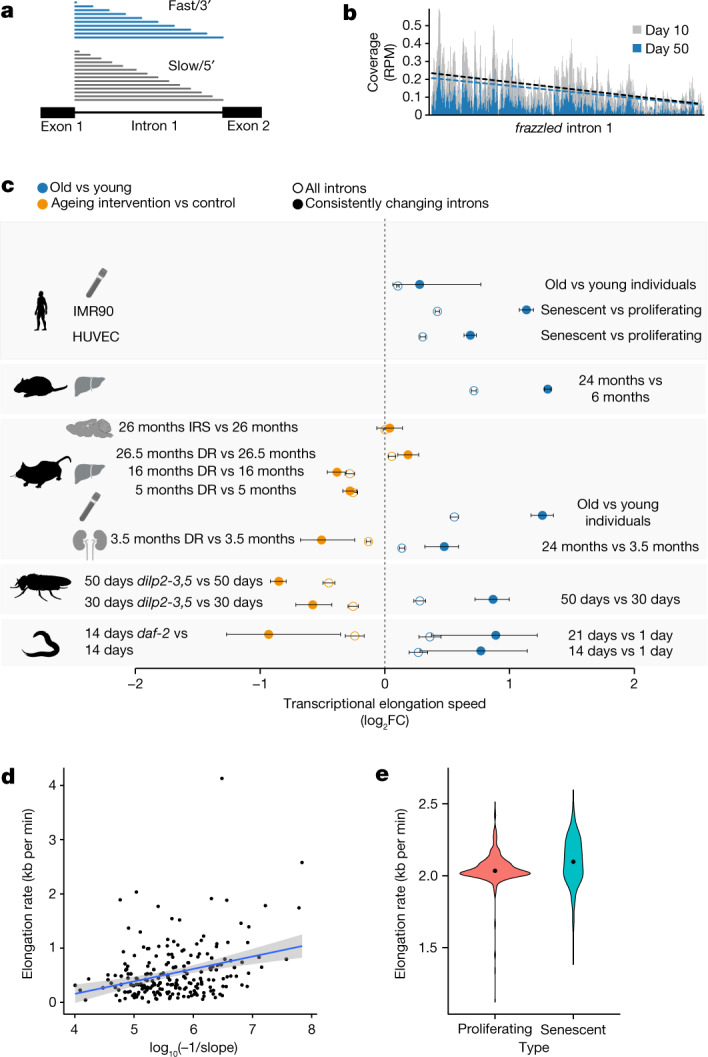
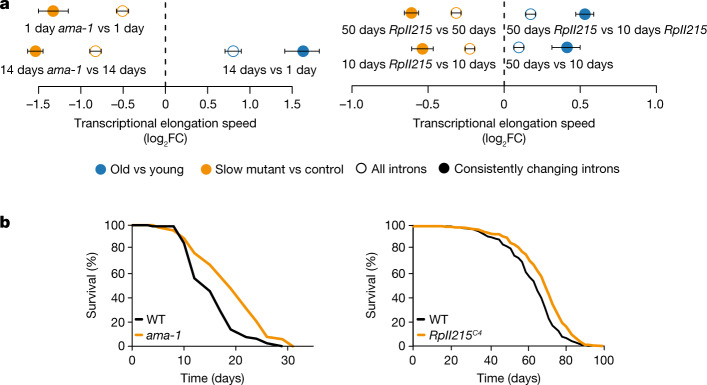
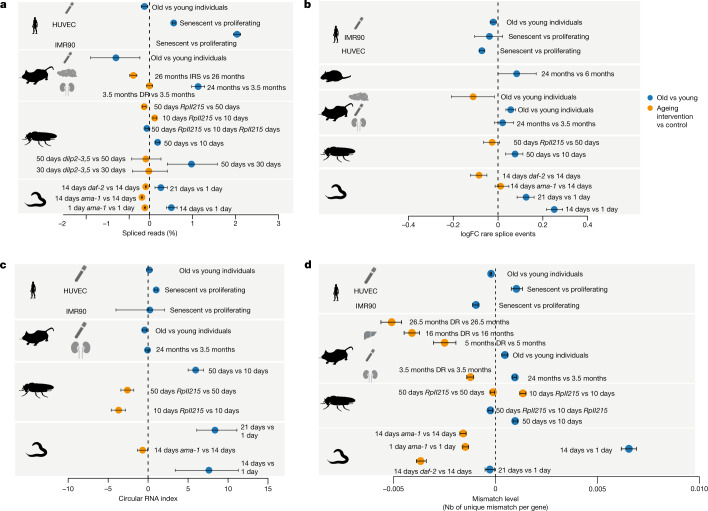
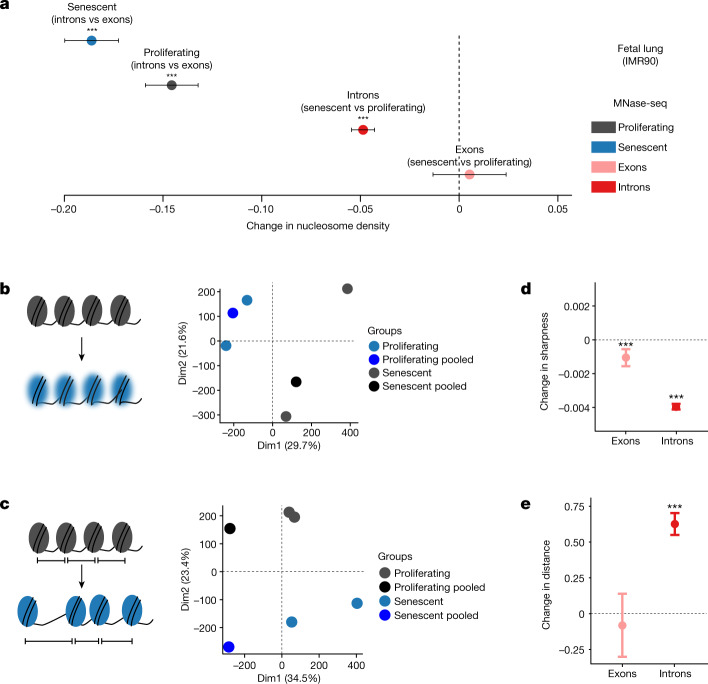
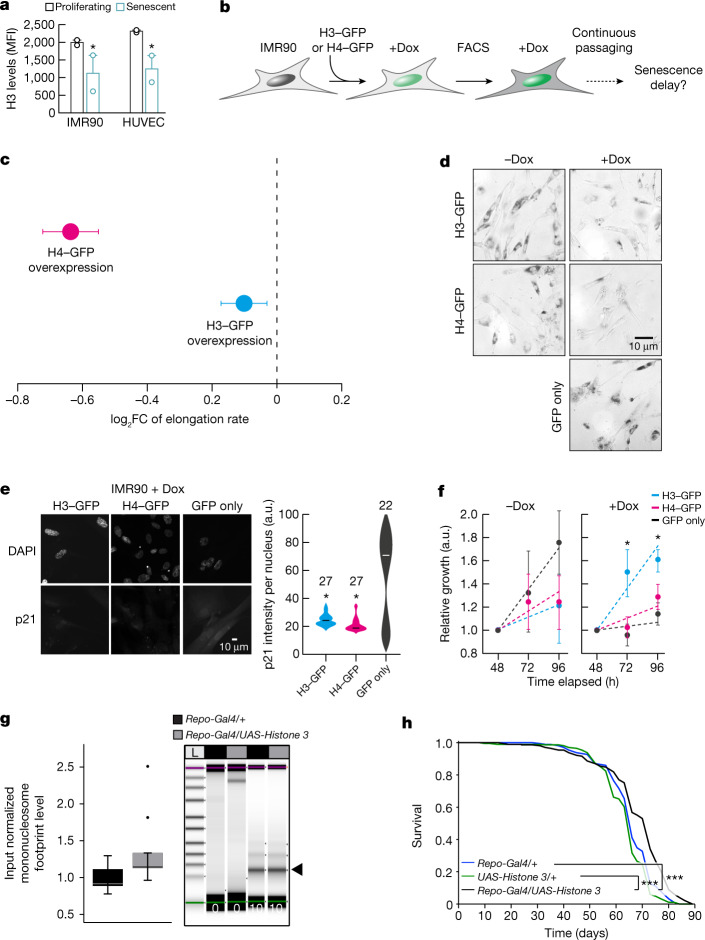
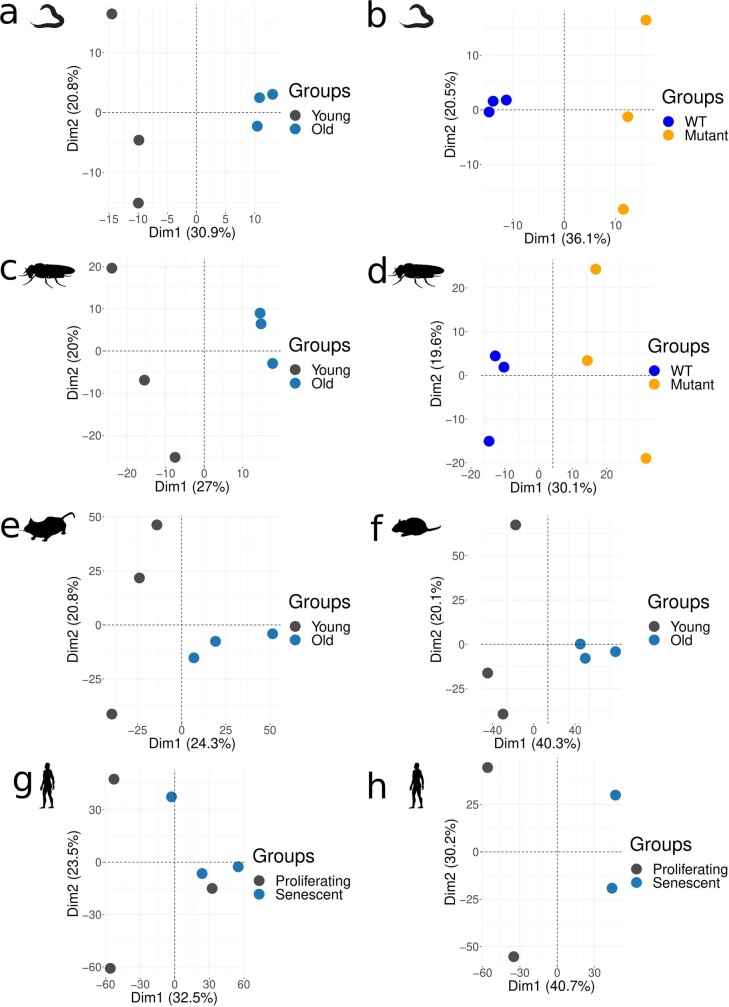
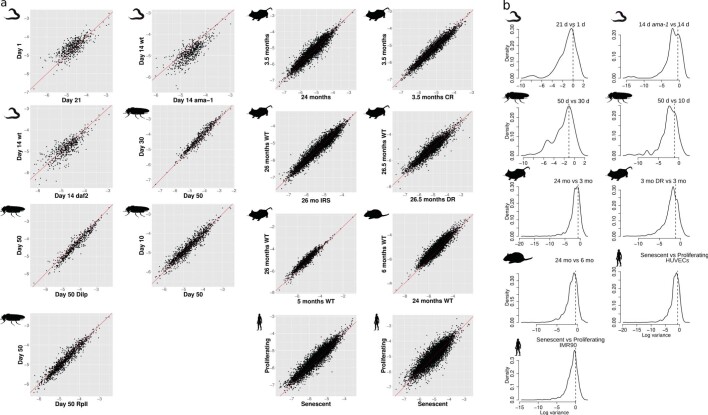
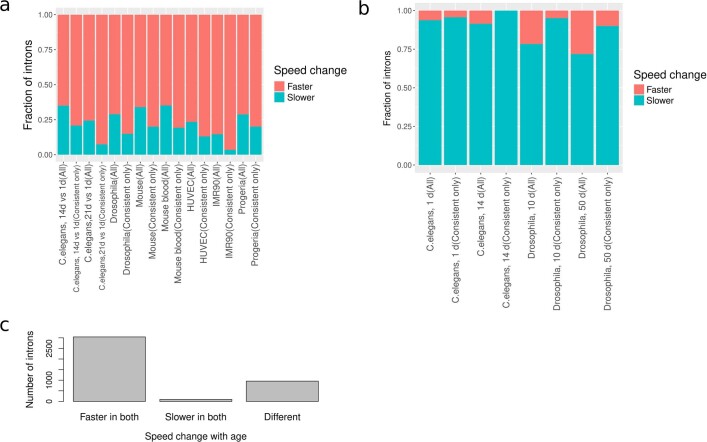
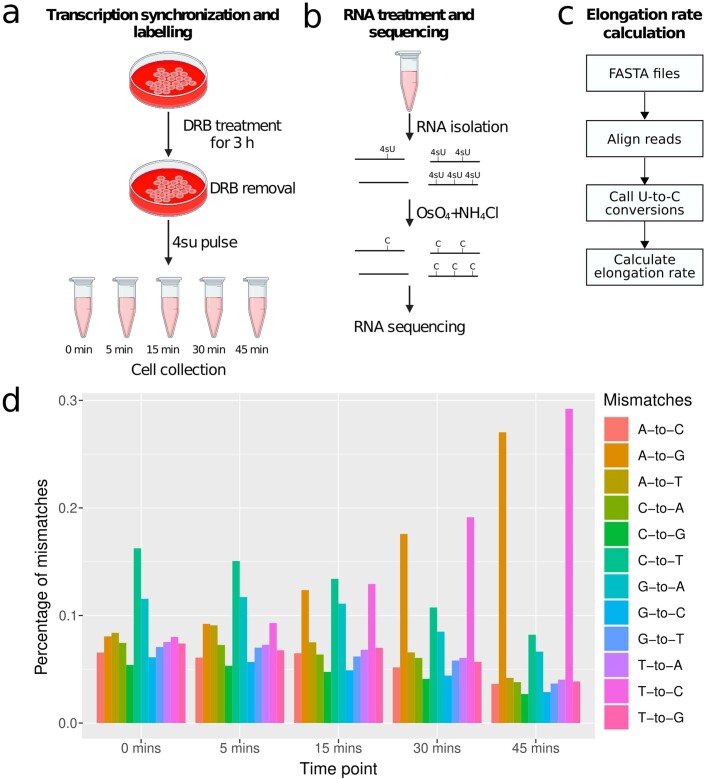
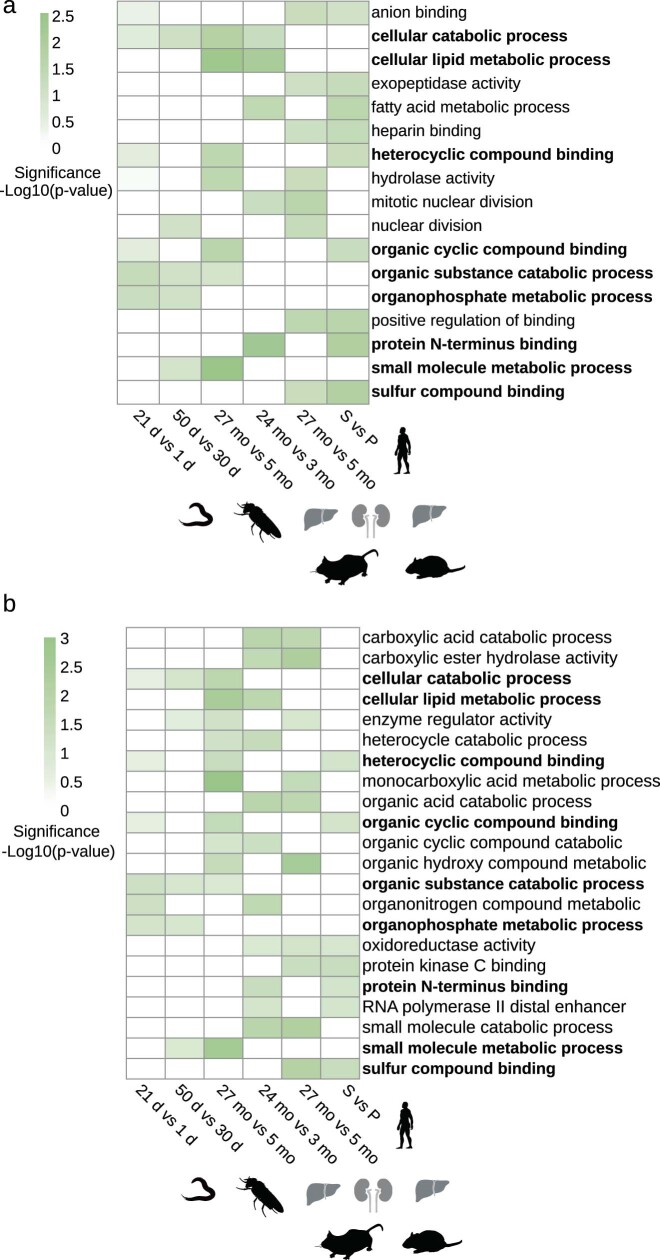
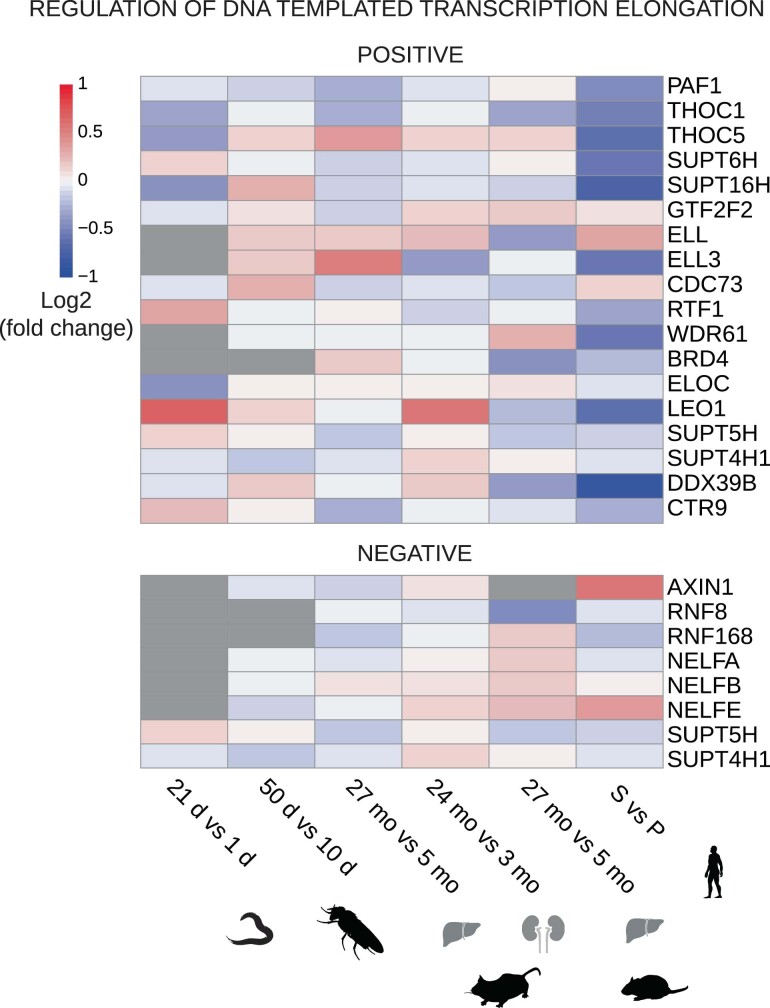
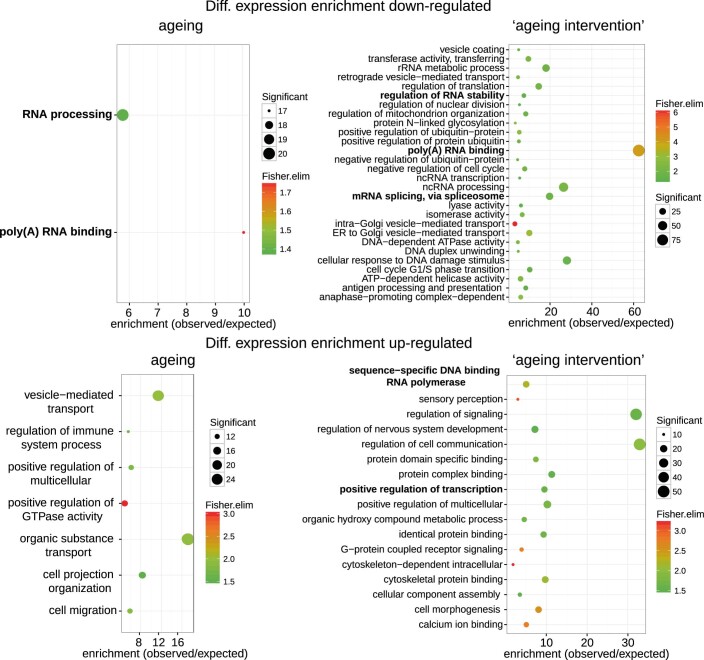
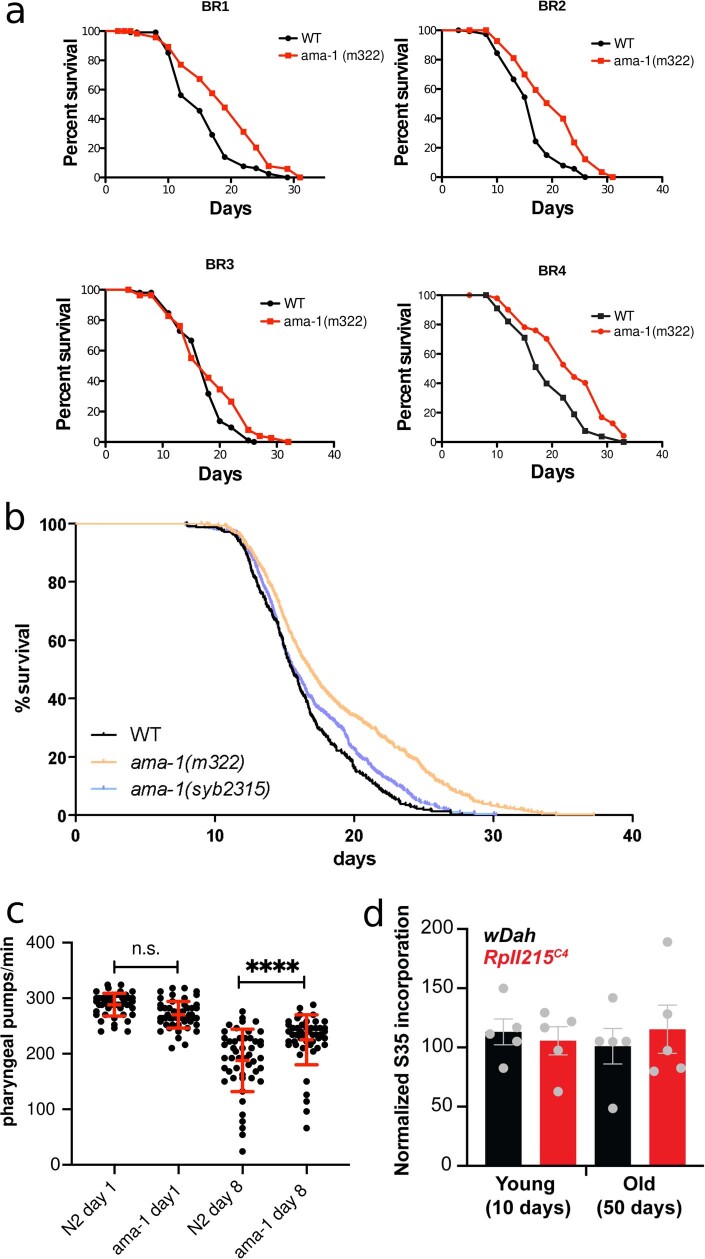
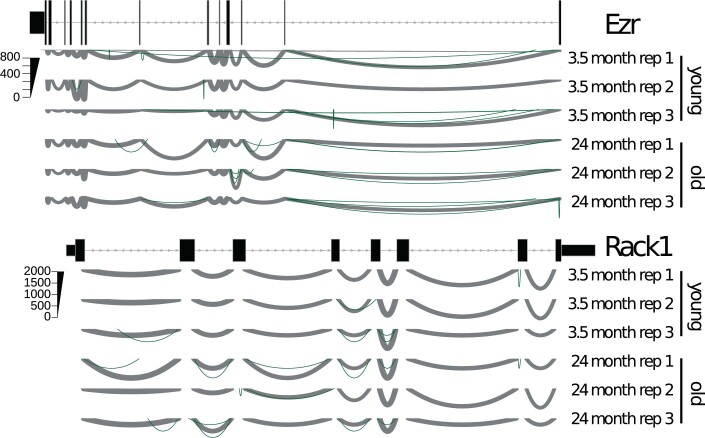
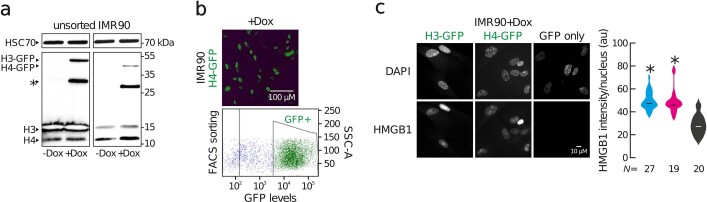
Physiological homeostasis becomes compromised during ageing, as a result of impairment of cellular processes, including transcription and RNA splicing1-4. However, the molecular mechanisms leading to the loss of transcriptional fidelity are so far elusive, as are ways of preventing it. Here we profiled and analysed genome-wide, ageing-related changes in transcriptional processes across different organisms: nematodes, fruitflies, mice, rats and humans. The average transcriptional elongation speed (RNA polymerase II speed) increased with age in all five species. Along with these changes in elongation speed, we observed changes in splicing, including a reduction of unspliced transcripts and the formation of more circular RNAs. Two lifespan-extending interventions, dietary restriction and lowered insulin-IGF signalling, both reversed most of these ageing-related changes. Genetic variants in RNA polymerase II that reduced its speed in worms5 and flies6 increased their lifespan. Similarly, reducing the speed of RNA polymerase II by overexpressing histone components, to counter age-associated changes in nucleosome positioning, also extended lifespan in flies and the division potential of human cells. Our findings uncover fundamental molecular mechanisms underlying animal ageing and lifespan-extending interventions, and point to possible preventive measures.


Conflict of interest statement

The authors declare no competing interests.

Figures

Fig. 1
Fig. 1. Pol II elongation speed increases with age and is slowed down by reduced insulin signalling and dietary restriction in multiple species.
a, Schematic representation of read coverage along introns in total RNA-seq. Intronic reads represent transcriptional production at a given point in time. A shallower slope of the read distribution is a consequence of increased Pol II elongation speed. b, Exemplary read distribution in intron 1 of frazzled, with coverage in reads per million (RPM) for D. melanogaster at age day 10 and day 50. Black dashed line, slope at day 10; blue dashed line, slope at day 50. c, Log2 fold change (FC) of average Pol II elongation speeds in the worm (whole body), fruitfly (brains), mouse (the kidney, liver, hypothalamus and blood), rat (liver), human blood, and HUVECs and IMR90 cells. Error bars show median variation ± 95% CI (two-sided paired Wilcoxon test). Empty circles indicate results using all introns passing the initial filter criteria, whereas solid circles show results for introns with consistent effects across replicates. The number of introns considered (n) ranged from 518 to 6,969 (see Supplementary Table 3 for details). DR, dietary restriction; IRS, inhibition of insulin–IGF signalling. Dashed line at 0 indicates no change as a visual aid. d, Estimate of transcriptional elongation speed from 4sUDRB-seq in IMR90 cells versus intronic slopes for 217 genes for which elongation speed could be estimated using both assays. Each dot represents one gene (Pearson correlation = 0.313, P = 2.5 × 10−6). The grey band shows the 95% CI for predictions from the linear model of elongation rate~log10(−1/slope). e, Distribution of elongation speeds in IMR90 cells based on 4sUDRB-seq. The black dot indicates the average speed. The difference between speeds is statistically significant (two-sided paired Wilcoxon test, P = 2.13 × 10−10). The same genes (464 genes) were used for both conditions (see Methods for details). In panel c, the silhouettes of the organs were created using BioRender (https://biorender.com), and the silhouettes of species are from PhyloPic (https://phylopic.org).
Fig. 2
Fig. 2. Molecular and lifespan effects of reduced Pol II elongation speed in C. elegans and D. melanogaster.
a, Differences of average Pol II elongation speeds between Pol II-mutant and wild-type (WT) worms (left; 509 introns) and flies (right; 1,354 introns). Error bars show median variation ± 95% CI. All average changes of Pol II elongation speeds are significantly different from zero (P < 0.001; two-sided paired Wilcoxon test). Empty circles indicate results using all introns passing the initial filter criteria, whereas solid circles show results for introns with consistent effects across replicates. Dashed line at 0 indicates no change as a visual aid. b, Survival curves of worms with the ama-1(m322) mutation (left; replicate 1) and flies with the RpII215C4 mutation (right; averaged survival curve). n = 4 replicates for worms and 3 replicates for flies. Animals with slow Pol II have a significantly increased lifespan (+20% and +10% median lifespan increase for C. elegans (n = 120; P < 0.001, log-rank test) and D. melanogaster (n = 220; P < 0.001, log-rank test), respectively).
Fig. 3
Fig. 3. Changes in transcript structure upon ageing (old versus young) and after lifespan-extending interventions.
a, Average changes of the fraction of spliced transcripts. The number of genes considered (n) ranged from 120 to 15,328. b, Average per cent changes of rare splice events (0.7% or less of total gene expression). The number of genes considered (n) ranged from 376 to 8,486. c, CircRNA index (back-spliced reads divided by the sum of linear and back-spliced reads) for worms, fly heads, mouse and rat livers, and human cell lines. The number of back-spliced junctions considered (n) ranged from 1,121 to 41,004. d, Changes in the average mismatch level. The number of genes considered (n) ranged from 1,950 to 8,620. Error bars show median variation ± 95% CI. See Supplementary Table 3 for details on the number of genes and back-spliced junctions used per comparison. In all panels, the dashed line at 0 indicates no change as a visual aid. In all panels, the silhouettes of the organs were created using BioRender (https://biorender.com), and the silhouettes of species are from PhyloPic (https://phylopic.org).
Fig. 4
Fig. 4. Profiling of nucleosome positioning in human cell models.
a, Average differences in nucleosome density between exons (n = 37,625) and introns (n = 193,912), and between proliferating and senescent cells. Error bars show median variation ± 95% CI. b,c, Principal component analysis plots of nucleosome sharpness (b) and distances between nucleosome summits (c) in introns for individual samples and pooled data. d, Changes in nucleosome sharpness between senescent and proliferating cells in exons (n = 37,277) and introns (n = 193,131). e, Changes in distance between nucleosome summits between senescent and proliferating cells in exons (n = 36,956) and introns (n = 192,194). For a,d,e, error bars show median variation ± 95% CI. Statistical significance of difference in pseudo-median distribution is indicated by asterisks (***P < 0.001, two-sided paired Wilcoxon rank test). Dashed line at 0 indicates no change as a visual aid.
Fig. 5
Fig. 5. Histone overexpression slows down entry into senescence and decreases Pol II speed.
a, Levels of H3 protein in proliferating and senescent HUVECs and IMR90 cells. Each data point comes from an independent biological replicate (different HUVEC donor or IMR90 isolate) and is the mean of three technical triplicates. H3 expression decreases with senescence (*P < 0.05, two-tailed Student’s t-test). MFI, mean fluorescence intensity. b, Schematic representation of the experiment. FACS, fluorescence-activated cell sorting. c, Differences of average Pol II elongation speeds between histone overexpression mutants and wild-type IMR90 cells (derived from 1,212 introns). Error bars show median variation ± 95% CI. All average changes of Pol II elongation speeds are significantly different from zero (P < 0.01; paired Wilcoxon rank test). Dashed line at 0 indicates no change as a visual aid. d, Typical images from β-galactosidase staining of H3–GFP, H4–GFP and control IMR90 cells, in the presence and absence of doxycycline (Dox). e, Typical immunofluorescence images of H3–GFP, H4–GFP and control IMR90 cells (left) show reduced levels of p21 in histone overexpression nuclei. Violin plots (right) quantify this reduction (*P < 0.05, two-tailed Student’s t-test). The number (n) of cells analysed per condition is indicated. f, MTT proliferation assay. For each H3–GFP or H4–GFP overexpression, mean ± s.d. were derived from two independent clones over three replicates for each clone. (*P < 0.05, two-tailed Student’s t-test). g, Quantification of input normalized mononucleosome footprints (black arrowhead) between the heads of aged (60 days) flies overexpressing Histone 3 in glial cells (Repo-Gal4/UAS-Histone 3) and control fly heads (Repo-Gal4/+). Significance was determined by paired two-tailed t-test (ten biologically independent replicates per fly group; *P = 0.0417). The upper and lower ‘hinges’ of the boxplot correspond to the first and third quartiles of the measurements. Digests were halted after 10 min and visualized by Tapestation (Agilent) (n > 5). The lines in each lane represent the internal upper (purple) and lower (green) markers, for sizing and alignment. L, DNA ladder. h, Lifespan analysis of Repo-Gal4/UAS-Histone 3 flies and control flies (Repo-Gal4/+ and UAS-Histone 3/+) (n = 200, ***P < 0.001).
Extended Data Fig. 1
Extended Data Fig. 1. PCAs of slopes of intronic read distribution.
Principal component analysis (PCA) of the slopes of C. elegans ((a) wt 21 d vs 1 d; (b) 14 ama-1(m322) d vs wt 14 d), D. melanogaster ((c) wt heads 50 d vs 10 d, (d) RpII215 heads 50 d vs wt 50 d), M. musculus ((e) kidney: 24 mo vs 3 mo), R. norvegicus ((f) liver: 24 mo vs 6 mo), H. sapiens ((g) HUVEC and (h) IMR90: Senescent vs Proliferating). In all panels, the silhouettes of species are from PhyloPic (https://phylopic.org).
Extended Data Fig. 2
Extended Data Fig. 2. Consistency of Pol-II elongation speed estimates between samples and within genes.
(a) Scatterplots of intronic slope (−log10) for each condition and species (C. elegans, D. melanogaster, M.musculus, R. norvegicus, H. sapiens). (b) Variation of intronic slope (−log10) changes for different introns of the same gene. Distribution of variances of Pol-II speed estimates (slope per intron) for introns within the same gene. Average variance of speed estimates across all introns (i.e. between genes; global average) is shown as a dashed vertical line for C. elegans (21 d vs 1 d; 14 daf-2 d vs 14 d), D. melanogaster (heads 50 d vs 30 d; 50 d vs 10 d), M. musculus (kidney: 24 mo vs 3 mo; 3 DR mo vs 3 mo), R. norvegicus (liver: 24 mo vs 6 mo), H. sapiens (Umbilical vein endothelial (HUVECs); fibroblast fetal lung (IMR90): Senescent vs Proliferating). The vast majority of intra-gene variances are below the average inter-gene variance, suggesting that introns of the same gene have coupled Pol-II elongation speeds. In all panels, the silhouettes of species are from PhyloPic (https://phylopic.org).
Extended Data Fig. 3
Extended Data Fig. 3. Consistency of RNA Pol-II speed changes.
(a) Change of elongation rate with aging or senescence in introns of C. elegans, D. melanogaster, M. musculus and H. sapiens, before and after filtering for introns that consistently change in speed in all replicates. (b) Change of elongation rate with mutations that slow down the speed of RNA-Pol-II in introns of C. elegans and D. melanogaster before and after filtering for introns that consistently change in speed in all replicates. (c) Comparison of the change of elongation rate with aging between IMR90 and HUVEC using the same introns.
Extended Data Fig. 4
Extended Data Fig. 4. 4SU-DRB labelling and TUC conversion to calculate RNA-Pol-II elongation rate.
(ac) Schematic representation of the 4SU-DRB labelling (a), TUC conversion (b) and elongation rate calculation (c). Cell culture and eppendorf icons created with BioRender.com. (d) Percentage of mismatches in every time point of the experiment (0 mins, 15 mins, 30 mins, 45 mins) in one of the proliferating replicates. There is a noticeable increase in A-to-G and T-to-C mismatches in the last two time points.
Extended Data Fig. 5
Extended Data Fig. 5. Genes with increase in Pol-II speed are associated with metabolism and catabolism related pathways.
GO enrichment analysis of genes with increased Pol-II speed across species: C. elegans (21 d vs 1 d), D. melanogaster (heads: 50 d vs 30 d), M. musculus (kidney: 24 mo vs 3 mo), R. norvegicus (liver: 24 mo vs 6 mo), H. sapiens (IMR90: Senescent vs Proliferating). GO enrichment of (a), top 200 (b), top 300 genes with an increase in Pol-II speed change for each species (common terms between the two sets in bold). Color scale indicates the significance of the enrichment (all GO terms enriched with p-values below 0.05, with at least 10 significant genes for each GO categories, Fisher elim test). In all panels, the silhouettes of the organs were created using BioRender (https://biorender.com), and the silhouettes of species are from PhyloPic (https://phylopic.org).
Extended Data Fig. 6
Extended Data Fig. 6. Heatmap of differential expression (log2 fold change) of MSigDB (61) annotated genes for ‘regulation of DNA templated transcriptional elongation’.
Top: activators of transcriptional elongation (POSITIVE); Bottom: repressors of transcriptional elongation (NEGATIVE). Data shown for WT aging time courses: worm (21 d vs 1 d), fly heads (50 d vs 10 d), mouse liver (27 mo vs 5 mo), mouse kidneys (24 mo vs 3 mo) and human fibroblast cell line (IMR90: Senescent vs proliferating). The silhouettes of the organs were created using BioRender (https://biorender.com), and the silhouettes of species are from PhyloPic (https://phylopic.org).
Extended Data Fig. 7
Extended Data Fig. 7. Functional enrichment for across-species differential expression analysis.
GO enrichment for consistently down-regulated (top) or up-regulated (bottom) genes across species during aging (left) or ‘aging intervention’ (right) (aging up-regulated: 92 genes; aging down-regulated: 71 genes; ‘aging intervention’ up-regulated: 164 genes; ‘aging intervention’ down-regulated: 473 genes; as background for the enrichment analysis a set of 4784 orthologue genes between H. sapiens, R. norvegicus, M. musculus, D. melanogaster, C. elegans was used. All p-values *P < 0.05, significant genes > 10, fisher elim test). GO terms related to transcription and splicing are indicated in bold.
Extended Data Fig. 8
Extended Data Fig. 8. Physiological consequences of reducing Pol-II elongation speed in animal models.
(a) Survival of wild-type and ama-1(m322) mutant worms conferring a slow Pol-II elongation rate (4 replicates, BR1:1.267, P < 0,0001; BR2:1.23,P < 0.0001; BR3:1, P = 0.0342; BR4:1.263,P < 0.0001, log-rank test, Mantel-cox). (b) C. elegans lifespan analysis after CRISPR/Cas9 mediated reversion of the slow RNAPII mutation. Survival curves of the strain harbouring the slow RNAPII mutation (ama-1 m322) and wild-type controls compared to worms after CRISPR/Cas9 engineered reversion of the slow mutation back to the wild type allele (ama-1 syb2315). Animals with slow Pol-II have a significantly increased lifespan. CRISPR/Cas9 engineered reversion restored lifespan essentially back to wild-type levels. (3 replicates; n > 300 per strain). (c) Pumping rates of wild type N2 (day 1: 47 worms, day 8: 49 worms) and ama-1 mutant (day 1: 52 worms, day 8: 48 worms) worms were measured on day 1 and day 8. Pumping rates were not significantly different on day 1, but ama-1 worms showed higher pumping rates compared to wild types on day 8, suggesting that the mutant worms are healthier at old age. The error bars represent standard deviation. (d) Ex-vivo S35 incorporation assay shows no significant difference in translation rates in female fly heads between wDah control and RpII215C4 mutants both at young (10days) and old age (50 days). N = 5 biological replicates with 25 heads per replicate. The error bars show the standard error of the mean.
Extended Data Fig. 9
Extended Data Fig. 9. Examples of rare splice site changes.
for gene Ezr and Rack1 with 3 replicates young (3.5 month) and old (26 month). Line thickness encodes the number of reads supporting this junction. Rare splice sites are shown in green.
Extended Data Fig. 10
Extended Data Fig. 10. H3-GFP and H4-GFP overexpression in IMR90 cells.
(a) Western blot experiments confirm the overexpression of the H3-GFP and H4-GFP proteins. (b) Visual confirmation of the Dox induction of H3/H4 expression and FACS sorting of GFP-positive cells. Both the blots and FACS data shown are representative of data obtained from independent experiments produced using the two different IMR90 isolates. (c) Typical immunofluorescence images of H3-GFP, H4-GFP and control IMR90 cells (left) show increased DAPI levels in histone overexpression nuclei. Violin plots (right) quantify this reduction (two-tailed t-test). N specifies the number of cells analyzed per condition.

Comment in

References

    1. Fritsch C, et al. Genome-wide surveillance of transcription errors in response to genotoxic stress. Proc. Natl Acad. Sci. USA. 2021;118:e2004077118. doi: 10.1073/pnas.2004077118. - DOI - PMC - PubMed
    1. Bentley DL. Coupling mRNA processing with transcription in time and space. Nat. Rev. Genet. 2014;15:163–175. doi: 10.1038/nrg3662. - DOI - PMC - PubMed
    1. Conaway JW, Conaway RC. Transcription elongation and human disease. Annu. Rev. Biochem. 1999;68:301–319. doi: 10.1146/annurev.biochem.68.1.301. - DOI - PubMed
    1. Heintz C, et al. Splicing factor 1 modulates dietary restriction and TORC1 pathway longevity in C. elegans. Nature. 2017;541:102–106. doi: 10.1038/nature20789. - DOI - PMC - PubMed
    1. Rogalski TM, Bullerjahn AM, Riddle DL. Lethal and amanitin-resistance mutations in the Caenorhabditis elegans ama-1 and ama-2 genes. Genetics. 1988;120:409–422. doi: 10.1093/genetics/120.2.409. - DOI - PMC - PubMed

Publication types