. 2023 May;617(7959):125-131.
doi: 10.1038/s41586-023-05928-6. Epub 2023 Apr 12.

Dynamic synchronization between hippocampal representations and stepping

Affiliations

Dynamic synchronization between hippocampal representations and stepping

Abhilasha Joshi et al. Nature. 2023 May.

Abstract

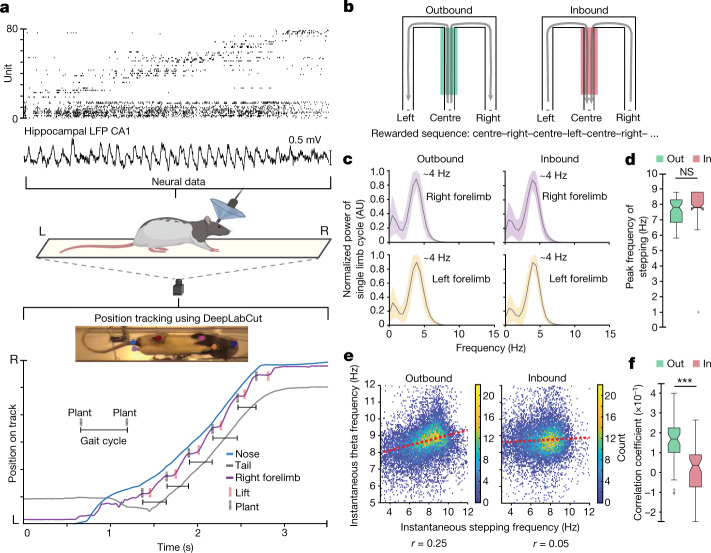
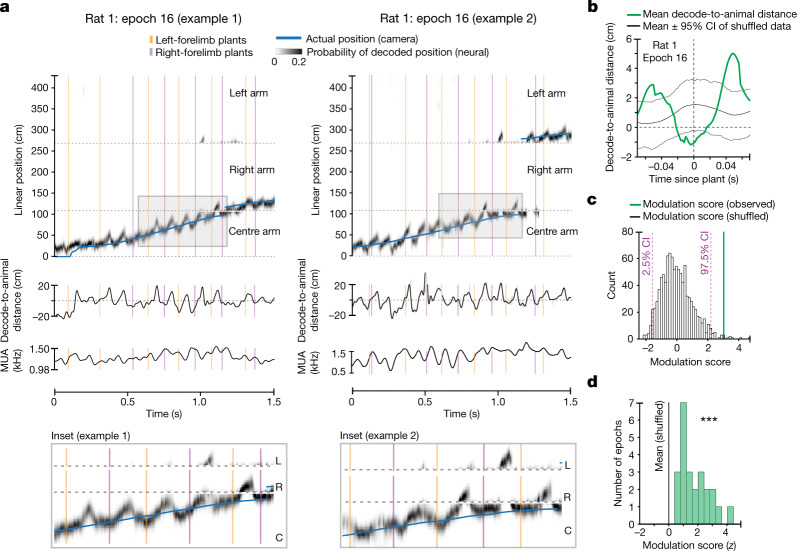
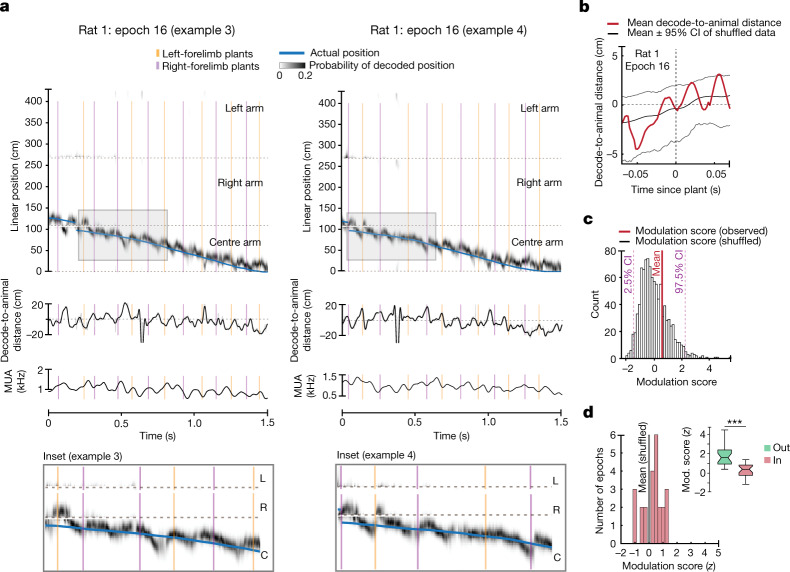
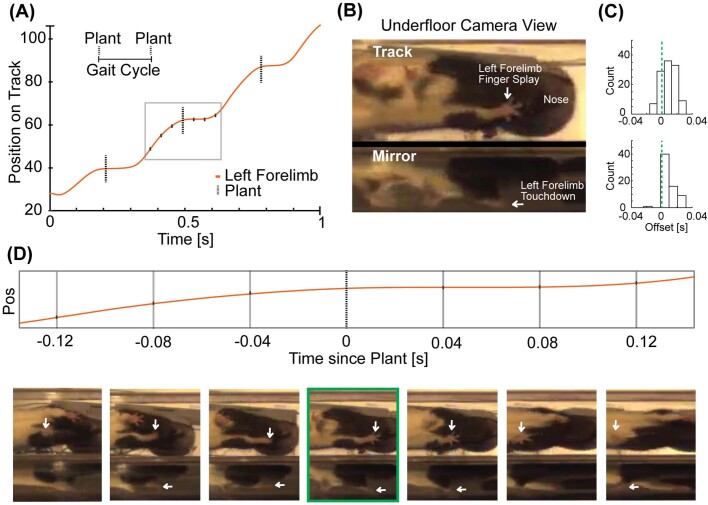
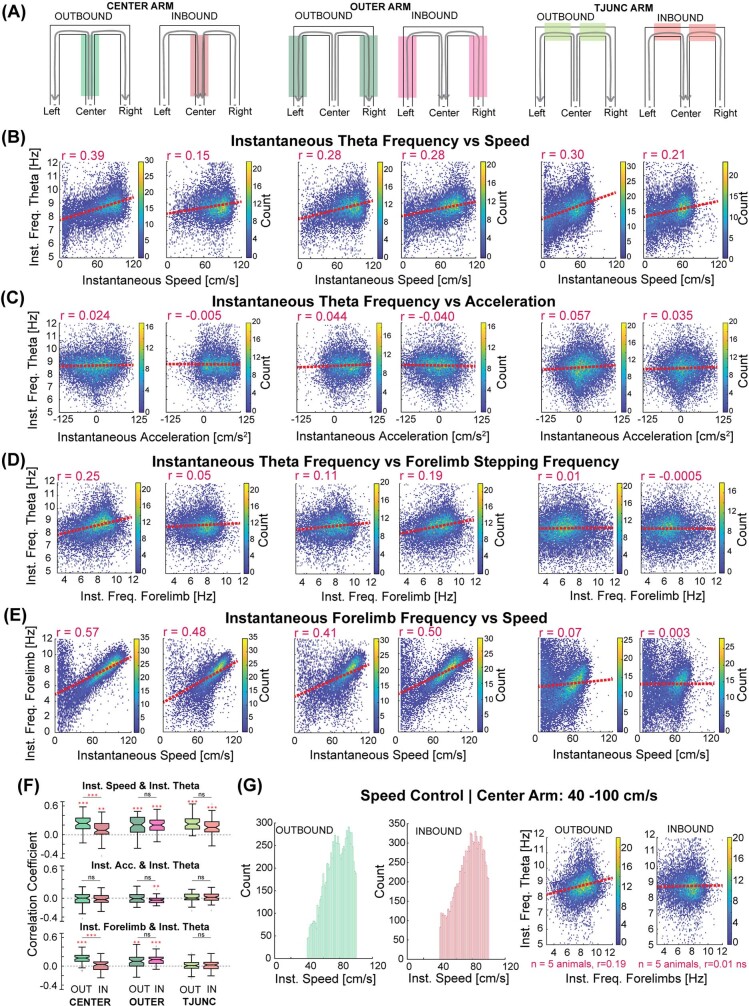
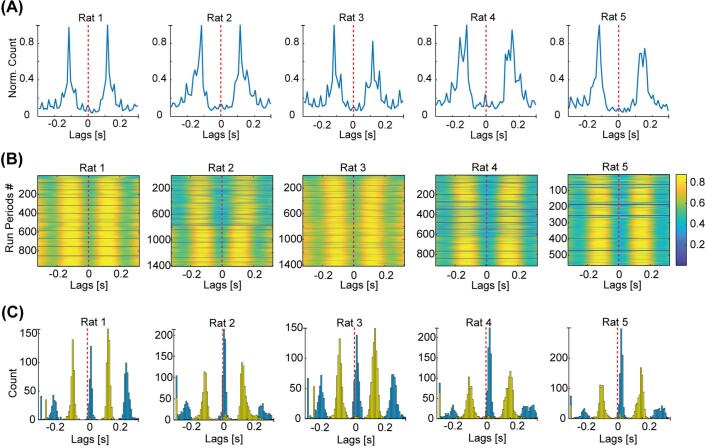
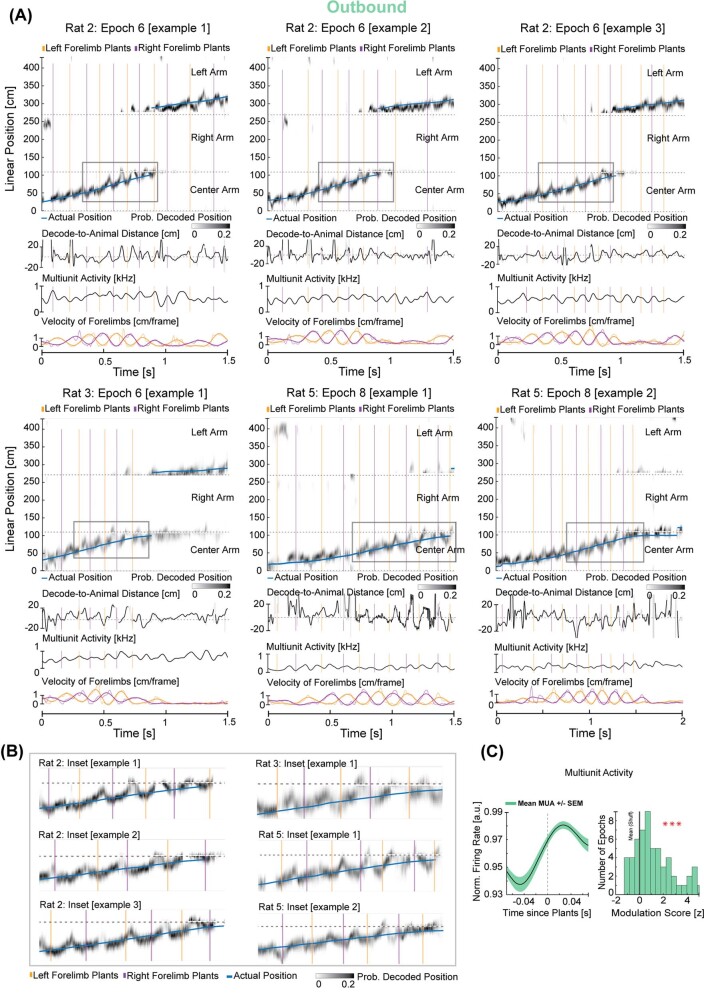
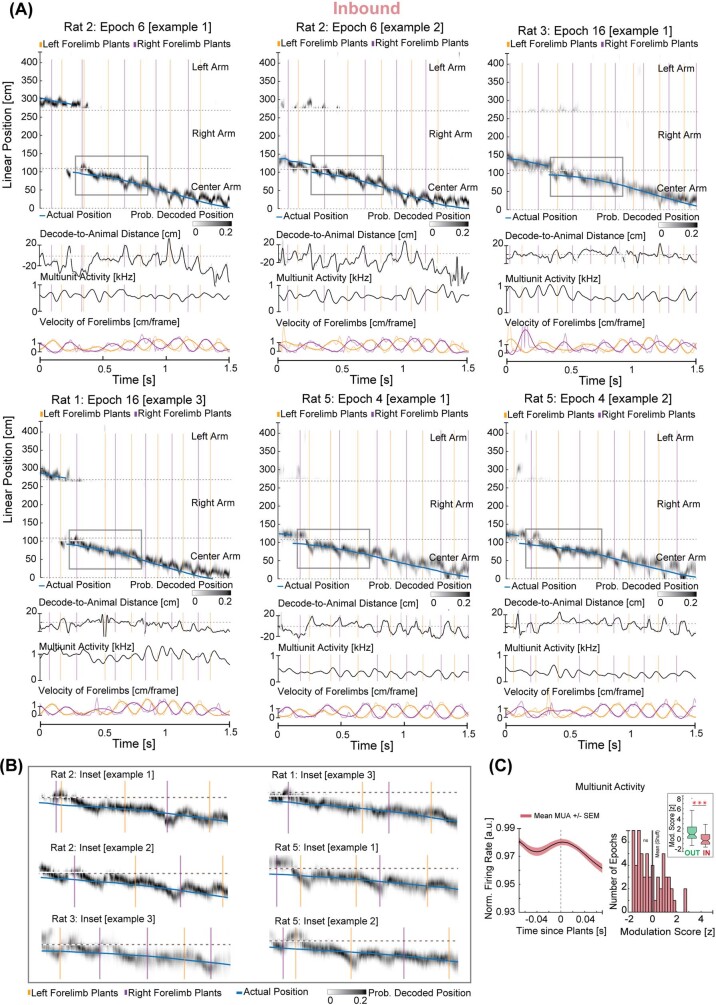
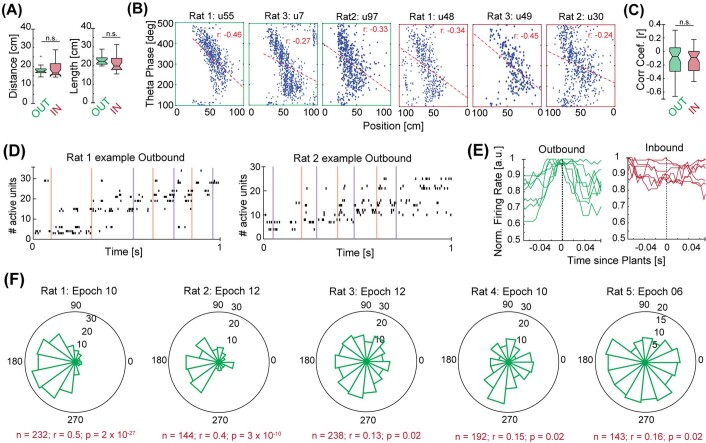
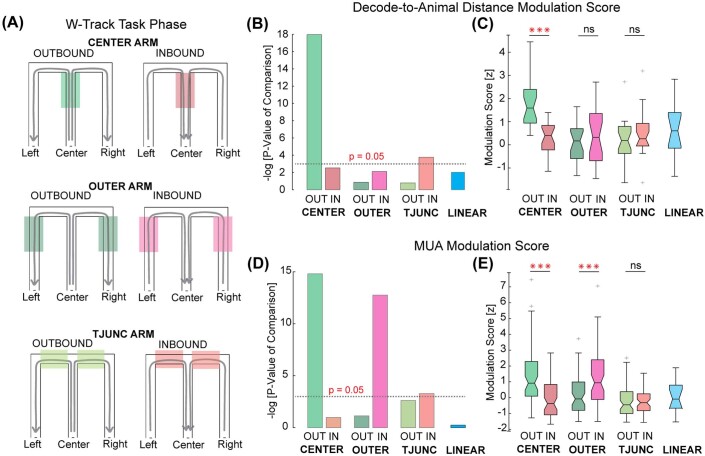
The hippocampus is a mammalian brain structure that expresses spatial representations1 and is crucial for navigation2,3. Navigation, in turn, intricately depends on locomotion; however, current accounts suggest a dissociation between hippocampal spatial representations and the details of locomotor processes. Specifically, the hippocampus is thought to represent mainly higher-order cognitive and locomotor variables such as position, speed and direction of movement4-7, whereas the limb movements that propel the animal can be computed and represented primarily in subcortical circuits, including the spinal cord, brainstem and cerebellum8-11. Whether hippocampal representations are actually decoupled from the detailed structure of locomotor processes remains unknown. To address this question, here we simultaneously monitored hippocampal spatial representations and ongoing limb movements underlying locomotion at fast timescales. We found that the forelimb stepping cycle in freely behaving rats is rhythmic and peaks at around 8 Hz during movement, matching the approximately 8 Hz modulation of hippocampal activity and spatial representations during locomotion12. We also discovered precisely timed coordination between the time at which the forelimbs touch the ground ('plant' times of the stepping cycle) and the hippocampal representation of space. Notably, plant times coincide with hippocampal representations that are closest to the actual position of the nose of the rat, whereas between these plant times, the hippocampal representation progresses towards possible future locations. This synchronization was specifically detectable when rats approached spatial decisions. Together, our results reveal a profound and dynamic coordination on a timescale of tens of milliseconds between central cognitive representations and peripheral motor processes. This coordination engages and disengages rapidly in association with cognitive demands and is well suited to support rapid information exchange between cognitive and sensory-motor circuits.


Conflict of interest statement

The authors declare no competing interests.

Figures

Fig. 1
Fig. 1. The structure of locomotor activity and its relationship to the hippocampal theta rhythm.
a, Top, example spike raster from high-density neural recordings of the rat hippocampus (rat 1, n = 77 neurons) during navigation on a transparent track. For position tracking, a high-speed camera captures the bottom view at 125 frames per second. A machine-learning algorithm, DeepLabCut (ref. ), is trained to track the nose, forelimbs, hindlimbs and base of the tail of the rat. L, left; R, right; LFP, local field potential. Bottom, simultaneously monitored displacement of the nose, tail, and right forelimb. Plant (black dotted vertical lines) and lift (red dotted vertical lines) times of the right-forelimb stepping cycle are labelled. The schematic of the rat, track and camera was created using Biorender. b, Schematic of the w-track task. The behavioural apparatus and rewarded inbound and outbound trajectories are shown with arrows. The centre arm is shaded to denote a region experienced during both inbound and outbound trials and used for quantifications below. c, Power spectral density analysis of the stepping cycle of each forelimb during outbound (left) and inbound (right) trials. Trials for all rats combined. Shaded regions represent s.e.m. AU, arbitrary units. d, Comparison of the peak frequency of forelimb stepping observed when rats traversed the centre portion of the track during outbound (green) and inbound (red) trials (n = 61 epochs in 5 rats, outbound, median: 7.8 Hz, interquartile range (IQR): 6.8–8.3 Hz; inbound, median: 7.8 Hz, IQR: 7.8–8.9 Hz; outbound versus inbound Kruskal–Wallis test: P = 0.11; individual animal P values: P (rat 1), 0.3; P (rat 2), 0.1; P (rat 3), 0.6; P (rat 4), 0.1; P (rat 5), 0.2; NS, not significant). Centre lines show the median; box limits indicate the 25th and 75th percentiles; whiskers extend 1.5 × IQR from the 25th and 75th percentiles; outliers are represented by grey symbols. e, Correlation between instantaneous forelimb stepping frequency and instantaneous hippocampal theta frequency during outbound (left) and inbound (right) runs, presented in binned scatter plots. The colour scale corresponds to the count in each bin. Trials for all rats combined. f, Correlation coefficients between instantaneous forelimb stepping frequency and instantaneous hippocampal theta frequency for outbound and inbound trials across epochs (n = 61 epochs in 5 rats, average difference = 0.14, paired two-sided Wilcoxon signed-rank test: P = 3.3 × 10−8; individual animal P values: P (rat 1), 0.02; P (rat 2), 0.01; P (rat 3), 2 × 10−3; P (rat 4), 0.03; P (rat 5), 8 × 10−3; adjusted P values: P (rat 1), 0.02; P (rat 2), 0.02; P (rat 3), 8 × 10−3; P (rat 4), 0.03; P (rat 5), 0.02). Centre lines show the median; box limits indicate the 25th and 75th percentiles; whiskers extend 1.5 × IQR from the 25th and 75th percentiles; outliers are represented by grey symbols. ***P < 0.0005).
Fig. 2
Fig. 2. Synchronization between hippocampal spatial representations and forelimb plant times.
a, Estimation of the represented position on the basis of clusterless decoding during outbound runs on the centre arm of the w-track. Blue trace represents the linearized position of the rat’s nose. Grey density represents the decoded position of the rat on the basis of spiking. Note that the decoded position can be ahead of, near or behind the rat’s current position. Orange and purple vertical lines represent the plant times of the left and the right forelimb, respectively. Shaded box indicates inset enlarged below. C, centre; R, right; L, left. b, Mean decode-to-animal distance trace triggered by forelimb plant times that precede non-local representations greater than 10 cm ahead of the rat’s current position for the selected region (60–100 cm) (green line; data from rat 1, epoch 16). Grey lines represent the 95% confidence interval (CI) of the shuffled distribution. The dotted line at zero indicates decode-to-animal distance values corresponding to the actual position of the rat’s nose, and positive or negative values indicate represented positions ahead or behind the actual position of the rat, respectively. c, Decode-to-animal distance modulation score of the observed data (vertical line, green) and the histogram of the modulation score for the shuffled distributions (bars, grey). d, Distribution of the decode-to-animal distance modulation score for the observed data in all rats (green bars) versus the mean of the modulation score for the shuffled data (black vertical line; n = 24 epochs in 4 rats, two-sided t-test: P = 1.6 × 10−8; individual animal P values: P (rat 1), 4 × 10−3; P (rat 2), 5 × 10−3; P (rat 3), 4 × 10−4; P (rat 5), 0.04; Benjamini–Hochberg adjusted P values: P (rat 1), 7 × 10−3; P (rat 2), 7 × 10−3; P (rat 3), 2 × 10−3; P (rat 5), 0.04). P < 0.0005.
Fig. 3
Fig. 3. Engagement between hippocampal neural representations and stepping rhythm is dependent on task phase.
a, Estimation of the represented position on the basis of clusterless decoding (as in Fig. 2) during inbound runs on the centre arm of the w-track. Blue trace represents the linearized position of the rat’s nose. Grey density represents the decoded position of the rat on the basis of spiking. Orange and purple vertical lines represent the plant times of the left and the right forelimb, respectively. Note that the decode-to-animal distance and MUA rhythmically fluctuate during the inbound runs. Shaded box indicates inset enlarged below. C, centre; R, right; L, left. b, Decode-to-animal distance trace triggered by forelimb plant times that precede non-local representations greater than 10 cm ahead of the rat’s current position for the selected region (60–100 cm) (red line; data from rat 1, epoch 16). Grey lines represent the 95% CI of the shuffled distribution. The dotted line at 0 indicates decode-to-animal distance values corresponding to the actual position of the rat’s nose. c, Decode-to-animal distance modulation score of the observed data (vertical line, red) and the histogram of the modulation score for the shuffled distributions (bars, grey). d, Distribution of modulation scores for the observed data in all rats (red bars) and the mean of the modulation score for the shuffled data (grey vertical line, n = 24 epochs in 4 rats, two-sided t-test: P = 0.08; individual animal P values: P (rat 1), 0.8; P (rat 2), 0.4; P (rat 3), 0.3; P (rat 5), 0.01; adjusted P values: P (rat 1), 0.8; P (rat 2), 0.5; P (rat 3), 0.5; P (rat 5), 0.05). Inset, comparison between the decode-to-animal distance modulation score during outbound (green) and inbound (red) runs on the w-track shows a stronger modulation of decode-to-animal distance by forelimb plants during outbound runs on the centre arm (4 rats, 24 epochs, Wilcoxon signed-rank test: P = 4.3 × 10−5; individual animal P values: P (rat 1), 0.03; P (rat 2), 0.04; P (rat 3), 0.03; P (rat 5), 0.06; adjusted P values: P (rat 1), 0.05; P (rat 2), 0.05; P (rat 3), 0.05; P (rat 5), 0.06; ***P < 0.0005). Centre lines show the median; box limits indicate the 25th and 75th percentiles; whiskers extend 1.5 × IQR from the 25th and 75th percentiles.
Extended Data Fig. 1
Extended Data Fig. 1. Validation of the locomotor tracking and detecting forelimb plant times.
a, Example displacement of a reference forelimb and detected plant times (dashed vertical lines) highlighting one complete gait cycle as a rat ran on a transparent track. b, Bottom view (track) and a 45-degree mirror view (mirror) are marked to highlight the two views used for manually detecting ‘fingersplay’ and ‘touchdown’ times (see Methods). c, Histogram of plant-fingersplay and plant-touchdown offsets shows close correspondence of these two (plant – handsplay median offset/IQR=0.008s, 0.016s, n = 114 plants; plant – touchdown median offset/IQR=0.008s, 0.008s, number of plants = 66). We note here that the human estimates involve somewhat subjective judgements and are not obviously more accurate than those of the algorithm. d, Screenshots of three frames on either side of the algorithm detected plant times (highlighted in green box) show the limb placement before and after the plant time.
Extended Data Fig. 2
Extended Data Fig. 2. Task-phase-specific relationship between the hippocampal theta rhythm and the stepping rhythm.
a, Schematic illustrating the different task phases on the w-track. Grey arrows indicate the direction of movement indicating the trial type (outbound or inbound) in different track regions (shaded boxes). This parcellation defined the 6 task phases on the w-track used in this study: Centre Arm – Outbound; Centre Arm – Inbound; Outer Arms – Outbound; Outer Arms – Inbound; T-Junction Arms – Outbound; T-Junction Arms – Inbound. b, Density plots of the instantaneous hippocampal theta frequency and instantaneous speed on different task phases on the w-track corresponding to categories in a. Correlation coefficients (r) for the combined data are reported on the top left of each panel. Distributions of correlation coefficients computed per epoch for be are shown in f. Colour corresponds to the count in each bin. Outbound vs. inbound trials on the centre arm, average correlation difference = 0.14, Kruskal–Wallis test: p = 7.4 x 10⁻⁶; individual animal p values: p (rat 1): 7 x 10⁻³; p (rat 2): 0.5, p (rat 3): 3 x 10⁻⁴, p (rat 4): 0.07, p (rat 5): 9 x 10⁻³; Benjamini–Hochberg adjusted p values: p (rat 1): 0.01, p (rat 2): 0.5, p (rat 3): 1 x 10⁻³, p (rat 4): 0.09, p (rat 5): 0.01 (comparison to no correlation: outbound, t-test: p = 7.8 x 10⁻¹⁸, individual animal p values: p (rat 1): 9 x 10⁻⁴, p (rat 2): 1 x 10⁻⁴, p (rat 3): 6 x 10⁻⁵, p (rat 4): 9 x 10⁻⁵, p (rat 5): 1 x 10⁻⁴; Benjamini–Hochberg adjusted p values: p (rat 1): 9 x 10⁻⁴, p (rat 2, rat 3, rat 4, rat 5): 2 x 10⁻⁴; inbound, t-test: p = 6.2 x 10⁻⁵, individual animal p values: p (rat 1): 0.1, p (rat 2): 1 x 10⁻⁵, p (rat 3): 0.2, p (rat 4): 4 x 10⁻³, p (rat 5): 7 x 10⁻³; Benjamini–Hochberg adjusted p values: p (rat 1): 0.1, p (rat 2): 1 x 10⁻⁴, p (rat 3): 0.2, p (rat 4): 9 x 10⁻³, p (rat 5): 0.01). c, Density plots of the instantaneous hippocampal theta frequency and instantaneous acceleration of the rat on different task phases on the w-track show low correlation coefficients (5 rats, 61 epochs). These variables were not consistently modulated across rats as evidenced by the distribution of correlation coefficients (r, Extended Data Fig. 1f) on the centre arm during outbound and inbound trials (median correlation outbound: 3 x 10⁻³; t-test for outbound values compared to 0, p = 0.41; median correlation inbound: −0.03; t-test for inbound values compared to 0, p = 0.42). Colour corresponds to the count in each bin. d, Density plots of the instantaneous hippocampal theta frequency and instantaneous forelimb stepping frequency on different task phases on the w-track (5 rats, 61 epochs). Forelimb stepping frequency was strongly correlated with hippocampal theta frequency during outbound trials on the centre arm (two-sided t-test of r values compared to 0: p = 4.8 x 10⁻¹⁶; individual animal p values: p (rat 1): 5 x 10⁻⁴, p (rat 2): 6 x 10⁻⁴, p (rat 3): 1 x 10⁻⁴, p (rat 4): 1 x 10⁻³, p (rat 5): 1 x 10⁻⁴; Benjamini–Hochberg method adjusted p values: p (rat 1): 7 x 10⁻⁴, p (rat 2): 7 x 10⁻⁴, p (rat 3): 3 x 10⁻⁴, p (rat 4): 1 x 10⁻³, p (rat 5): 3 x 10⁻⁴) but we found no consistent correlation on inbound runs (two-sided t-test of r values compared to 0: p = 0.25; individual animal p values: p (rat 1): 0.1, p (rat 2): 0.1, p (rat 3): 0.3, p (rat 4): 0.8, p (rat 5): 0.02; Benjamini–Hochberg adjusted p values: p (rat 1): 0.2, p (rat 2): 0.2, p (rat 3): 0.3, p (rat 4): 0.8, p (rat 5): 0.1). Further, the outbound correlation coefficients were significantly different from those observed during inbound trials on the centre arm (Fig. 1d). Distribution of correlation coefficients for other task phases calculated per epoch is reported in f. Colour corresponds to the count in each bin. Note, Extended Data Fig. 1 row D, column 1 is the same as Fig. 1e. Centre lines show the medians; box limits indicate the 25th and 75th percentile; whiskers extend 1.5 times the interquartile range from the 25th and 75th percentiles; outliers are represented by grey symbols. e, Density plots of the instantaneous forelimb stepping frequency and instantaneous running speed of the rat on different task phases on the w-track (n = 61 epochs in 5 rats). Colour corresponds to the count in each bin. f, Distribution of the correlation coefficients computed per epoch during different task phases on the w-track. Asterisks (*) indicate that the distribution of correlation coefficients is significantly different from zero (two-sided t-test, p < 0.05). Comparisons of the same track region experienced during outbound and inbound portions on the w-track are highlighted using paired two-sided Wilcoxon signed-rank test. *p < 0.05, **p < 0.005, ***p < 0.0005. g, Running speed control: correlations controlled for the rat’s running speed on the centre region of the track during outbound and inbound trials. Analysis was restricted to running speeds of 40–100 cm/s. Histogram of instantaneous speeds during outbound and inbound trials included for analysis (left) and resulting binned scatter plots (right) show that outbound trials on the centre arm have higher correlation coefficients compared to those on inbound portions of the centre arm.
Extended Data Fig. 3
Extended Data Fig. 3. Individual forelimb cross-correlations during runs.
a, Normalized cross-correlograms of left- and right-forelimb plant times on the w-track show a trough at zero indicating that the dominant gait motif in the reported running speeds corresponds to trotting, where the limbs strike the ground in alternating sequence. b, Cross-correlation heat maps of individual left and right-forelimb stepping cycles during each run on the track. c, The distribution of maxima (peaks) and minima (troughs) values of the cross-correlations of each run shown in b is plotted in a histogram to display a lack of overlap between the left and right forelimb, confirming that the rats are rarely if ever using a gait where both forelimbs hit the ground at the same time (for example, during bounding).
Extended Data Fig. 4
Extended Data Fig. 4. Prominent synchronization of forelimb plant times with neural representation of current position during outbound trials.
a, Individual examples as in Fig. 2 from rat 2, rat 3 and rat 5. Blue trace represents the linearized position of the rat’s nose. Grey density represents the decoded position of the rat based on spiking. Note that the decoded position can be ahead of, near, or behind the rat’s actual position. Orange and purple vertical lines represent the plant times of the left and right forelimb, respectively. b, Insets correspond to shaded areas in a enlarged to highlight individual examples of the synchronization between hippocampal representations and forelimb plants. Note, forelimb plant times coincide with hippocampal representation of the actual location of the rat. c, Left, forelimb-plant-triggered MUA (mean +/− SEM) is modulated during outbound trials. Right, correspondingly, the distribution of the MUA modulation score for the observed data in all rats (green, bars) is significantly different from the mean of the modulation score for the shuffled data (black, vertical line; n = 61 epochs in 5 rats, two-sided t-test: p = 3.9 x 10⁻⁷; individual animal p values: p (rat 1): 4 x 10⁻⁴, p (rat 2): 0.07, p (rat 3): 0.5, p (rat 4): 6 x 10⁻⁴, p (rat 5): 3 x 10⁻³; adjusted p values: p (rat 1): 1 x 10⁻³, p (rat 2): 0.09, p (rat 3): 0.5, p (rat 4): 1 x 10⁻³, p (rat 5): 5 x 10⁻³, consistent trends observed in 4/5 rats). Note, rat 3 had 15 electrodes targeted in the hippocampus instead of 30 for rat 1, rat 2, rat 4 & rat 5. ***p < 0.0005.
Extended Data Fig. 5
Extended Data Fig. 5. Examples of hippocampal spatial representations and forelimbs during inbound trials.
a, Individual examples as in Fig. 2 from rat 2, rat 3 and rat 5. Blue trace represents the linearized position of the rat’s nose. Grey density represents the decoded position of the rat based on spiking. Orange and purple vertical lines represent the plant times of the left and right forelimb, respectively. Note that the decode-to-animal distance, MUA, and stepping rhythmically fluctuate during the inbound runs—shaded regions in zoomed insets below. b, Insets are shaded areas in a enlarged to highlight individual examples of hippocampal representations and forelimb plants during inbound trials on the centre arm. Note, the lack of coordination between forelimb plants and hippocampal representation during inbound trials. On these trials, forelimb plants could occur when hippocampal decode represents positions that are ahead, concurrent, or behind the actual location of the rat. c, Left, forelimb-plant-triggered MUA (mean +/− SEM) shows low modulation during inbound trials. Right, correspondingly, the distribution of the MUA modulation score for the observed data in all rats (red, bars) is significantly different from the mean of the modulation score for the shuffled data (black, vertical line, 5 rats, 61 epochs, two-sided t-test: p = 0.37, individual animal p values: p (rat 1): 0.6, p (rat 2): 0.1, p (rat 3): 0.3, p (rat 4): 0.8, p (rat 5): 0.2). Inset: comparison of the MUA modulation score during the outbound (green) and inbound (red) runs on the centre arm of the w-track shows a more robust modulation during the outbound portions (n = 61 epochs in 5 rats, paired two-sided Wilcoxon signed-rank test: p = 1.7 x 10⁻⁷, individual animal p values: p (rat 1): 2 x 10⁻³, p (rat 2): 9 x 10⁻³, p (rat 3): 0.1, p (rat 4): 5 x 10⁻³, p (rat 5): 0.03; adjusted p values: p (rat 1): 0.01, p (rat 2): 0.01, p (rat 3): 0.1, p (rat 4): 0.01, p (rat 5): 0.04). ***p < 0.0005. Centre lines show the medians; box limits indicate the 25th and 75th percentile; whiskers extend 1.5 times the interquartile range from the 25th and 75th percentiles; outliers are represented by grey symbols.
Extended Data Fig. 6
Extended Data Fig. 6. Theta sequences and theta-phase precession are prevalent during both outbound and inbound task phases.
a, Left, distribution of peaks (median per epoch) of the decode-to-animal distance trace on outbound and inbound task phases on the centre arm were not statistically different (n = 24 epochs in 4 rats; outbound median: 17 cm, inbound median: 16 cm inbound; Kruskal–Wallis test: p = 0.39; individual animal p values: p (rat 1): 0.7, p (rat 2): 0.5, p (rat 3): 0.6, p (rat 5): 0.8). Right, in a complementary approach, we parsed the decode-to-animal-distance trace by theta troughs and compared their length (median per epoch) during outbound and inbound portions on the track. Here again, we did not find a consistent difference between inbound and outbound task phases on the centre arm (median length outbound: 22 cm, median length inbound 19 cm, p: 0.08; individual animal p values: p (rat 1): 3 x 10⁻³; p (rat 2): 0.9, p (rat 3): 0.9, p (rat 5): 0.8). b, Example phase-precession plots of three putative pyramidal cells during the outbound (green outer boxes) and inbound (red outer boxes) task phases on the centre arm of the track. Correlation coefficients (r, red text). c, Box plots showing the distribution of correlation coefficients computed for each active putative pyramidal cell in 3 epochs across each of 3 rats (Kruskal–Wallis test p = 0.42, individual animal p values: p (rat 1): 0.8, p (rat 2): 0.3, p (rat 3): 0.4; number of cells outbound: 57; number of cells inbound: 46). Centre lines show the medians; box limits indicate the 25th and 75th percentile; whiskers extend 1.5 times the interquartile range from the 25th and 75th percentiles. d, Examples of spike rasters of active putative pyramidal cells during outbound runs starting on the centre arm of the w-track. Cells are ordered by the mean of spike times on the outbound runs on the track. The plots illustrate that theta sequences can be observed in the spiking activity of pyramidal cells even when putative interneurons are excluded. Coloured vertical lines are plant times of the right (purple) and left (orange) forelimbs. e, Examples of forelimb-plant-triggered activity of putative pyramidal cells (each line corresponds to one cell, n = 6 examples from Rat 1 epoch 16) active during outbound and inbound task phases on the centre arm of the track, respectively. Left, cells active during outbound runs (green). Right, cells active during inbound runs (red). Note the modulation of spiking activity by steps is also observed at the level of individual pyramidal neurons. These results are complementary to Extended Data Fig. 4c and Extended Data Fig. 5c. f, Examples of circular histograms showing the prominent phase relationship between forelimb plants and hippocampal theta oscillations. Bin size: 24 degrees.
Extended Data Fig. 7
Extended Data Fig. 7. Modulation of decode-to-animal distance and MUA by forelimb plant times is most prominent during outbound trials on the centre arm of the w-track.
a, Schematic illustrating the different task phases on the w-track. Shaded portions are highlighted to illustrate regions on the track included for the analysis. b, Comparison of the decode-to-animal distance modulation score on different portions of the w-track and a separate linear track. The negative log of the p-value corresponds to the comparison of the modulation score on each portion of the track to that of its shuffled distributions. The dotted line corresponds to p = 0.05 (t-test). Note that while there was a statistically significant decode-to-animal-distance modulation on the T-junction arm during inbound trials when all rats were combined, this was not significant in any individual rats (two-sided t-test, p = 0.02; individual animal p values: p (rat 1): 0.6, p (rat 2): 0.1, p (rat 3): 0.6, p (rat 5): 0.1). c, Box plots show the distribution of decode-to-animal distance modulation scores calculated per epoch on different portions of the w-track and linear track. Asterisks (*) indicate that the paired comparisons between outbound and inbound trial types on the same track region were significant (Kruskal–Wallis test; p = 0.05). ***p < 0.0005. Centre lines show the medians; box limits indicate the 25th and 75th percentile; whiskers extend 1.5 times the interquartile range from the 25th and 75th percentiles; outliers are represented by grey symbols. d, Same as b, but for MUA modulation score. Note, as in the case of decode-to-animal-distance modulation, a statistically significant MUA modulation was observed on inbound trials on the T-junction arms (two-sided t-test, p = 0.04; individual animal p values: p (rat 1): 0.2, p (rat 2): 0.5, p (rat 3): 0.2, p (rat 4): 0.7, p (rat 5): 0.2). e. Same as c, but for MUA modulation score. ***p < 0.0005. Centre lines show the medians; box limits indicate the 25th and 75th percentile; whiskers extend 1.5 times the interquartile range from the 25th and 75th percentiles; outliers are represented by grey symbols.

Similar articles

Cited by

References

    1. O’Keefe J, Dostrovsky J. The hippocampus as a spatial map. Preliminary evidence from unit activity in the freely-moving rat. Brain Res. 1971;34:171–175. doi: 10.1016/0006-8993(71)90358-1. - DOI - PubMed
    1. Morris RG, Garrud P, Rawlins JN, O’Keefe J. Place navigation impaired in rats with hippocampal lesions. Nature. 1982;297:681–683. doi: 10.1038/297681a0. - DOI - PubMed
    1. Dusek JA, Eichenbaum H. The hippocampus and memory for orderly stimulus relations. Proc. Natl Acad. Sci. USA. 1997;94:7109–7114. doi: 10.1073/pnas.94.13.7109. - DOI - PMC - PubMed
    1. Wikenheiser AM, Redish AD. Hippocampal theta sequences reflect current goals. Nat. Neurosci. 2015;18:289–294. doi: 10.1038/nn.3909. - DOI - PMC - PubMed
    1. Colgin LL. Mechanisms and functions of theta rhythms. Annu. Rev. Neurosci. 2013;36:295–312. doi: 10.1146/annurev-neuro-062012-170330. - DOI - PubMed

Publication types