. 2023 Apr;616(7958):798-805.
doi: 10.1038/s41586-023-05937-5. Epub 2023 Apr 12.

Extrachromosomal DNA in the cancerous transformation of Barrett's oesophagus

Affiliations

Extrachromosomal DNA in the cancerous transformation of Barrett's oesophagus

Jens Luebeck et al. Nature. 2023 Apr.

Abstract

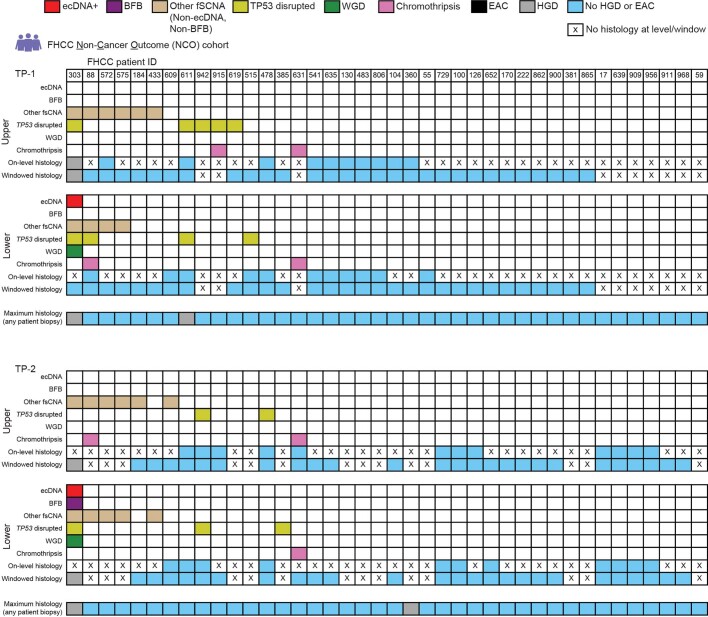
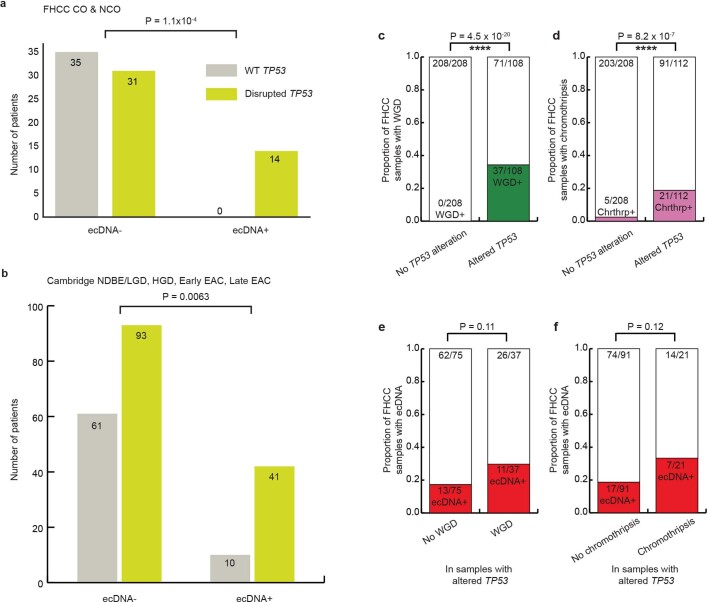
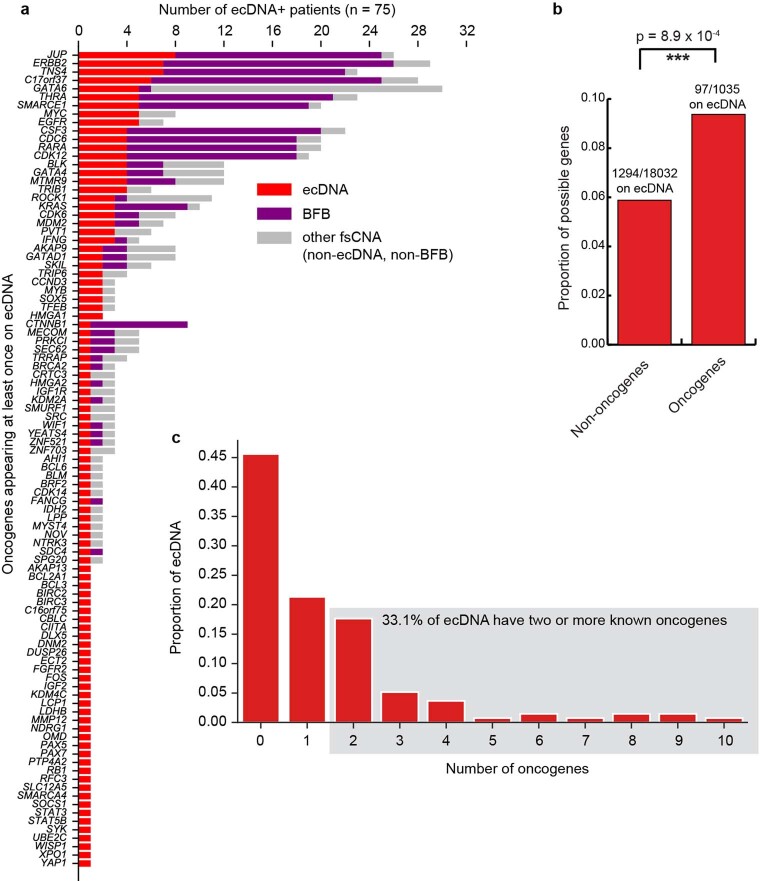
Oncogene amplification on extrachromosomal DNA (ecDNA) drives the evolution of tumours and their resistance to treatment, and is associated with poor outcomes for patients with cancer1-6. At present, it is unclear whether ecDNA is a later manifestation of genomic instability, or whether it can be an early event in the transition from dysplasia to cancer. Here, to better understand the development of ecDNA, we analysed whole-genome sequencing (WGS) data from patients with oesophageal adenocarcinoma (EAC) or Barrett's oesophagus. These data included 206 biopsies in Barrett's oesophagus surveillance and EAC cohorts from Cambridge University. We also analysed WGS and histology data from biopsies that were collected across multiple regions at 2 time points from 80 patients in a case-control study at the Fred Hutchinson Cancer Center. In the Cambridge cohorts, the frequency of ecDNA increased between Barrett's-oesophagus-associated early-stage (24%) and late-stage (43%) EAC, suggesting that ecDNA is formed during cancer progression. In the cohort from the Fred Hutchinson Cancer Center, 33% of patients who developed EAC had at least one oesophageal biopsy with ecDNA before or at the diagnosis of EAC. In biopsies that were collected before cancer diagnosis, higher levels of ecDNA were present in samples from patients who later developed EAC than in samples from those who did not. We found that ecDNAs contained diverse collections of oncogenes and immunomodulatory genes. Furthermore, ecDNAs showed increases in copy number and structural complexity at more advanced stages of disease. Our findings show that ecDNA can develop early in the transition from high-grade dysplasia to cancer, and that ecDNAs progressively form and evolve under positive selection.


Conflict of interest statement

P.S.M. is a co-founder, chairs the scientific advisory board (SAB) of and has equity interest in Boundless Bio. P.S.M. is also an advisor with equity for Asteroid Therapeutics and is an advisor to Sage Therapeutics. V.B. is a co-founder, consultant, SAB member and has equity interest in Boundless Bio and Abterra, and the terms of this arrangement have been reviewed and approved by the University of California, San Diego in accordance with its conflict of interest policies. S.W. is a member of the SAB of Dimension Genomics. H.Y.C. is a co-founder of Accent Therapeutics, Boundless Bio, Cartography Bio, and Orbital Therapeutics, and is an advisor to 10X Genomics, Arsenal Biosciences, Chroma Medicine, and Spring Discovery. R.C.F. is named on patents related to Cytosponge and associated assays that were licensed to Covidien (now Medtronic). R.C.F. has founder shares (<3%) in Cyted. R.G.W.V. is a co-founder of Boundless Bio and an advisor to Stellanova Therapeutics and NeuroTrials. L.B.A. is a compensated consultant and has equity interest in io9. His spouse is an employee of Biotheranostics. L.B.A. is an inventor on the US patent 10,776,718 for source identification by non-negative matrix factorization. L.B.A. also declares provisional patent applications for ‘Clustered mutations for the treatment of cancer’ (US provisional application serial number 63/289,601) and ‘Artificial intelligence architecture for predicting cancer biomarker’ (serial number 63/269,033). S.M.L. is a co-founder of io9, and also declares a provisional patent application for ‘Methods and biomarkers in cancer’ (US provisional application serial number 114198-1160). J.L. is a part-time paid consultant for Boundless Bio, and the terms of this arrangement have been reviewed and approved by the University of California, San Diego in accordance with its conflict of interest policies. P.S.M., V.B., J.L. and S.W. declare a patent application related to this work: ‘Methods and compositions for detecting ecDNA’ (US patent application number 17/746,748). The remaining authors declare no competing interests.

Figures

Fig. 1
Fig. 1. Study and analysis designs.
a, Breakdown of the histological disease states among patients with Barrett’s oesophagus in the Cambridge selected cross-sectional study, representing the highest disease state for that patient. NDBE, non-dysplastic Barrett’s oesophagus. b, The FHCC cohort consisted of 80 patients for whom biopsies were collected prospectively. The cohort was separated later into two groups of 40 patients who had cancer outcomes (CO) and non-cancer outcomes (NCO). c, Sample collection at time points TP-1 and TP-2 for sequencing biopsies and histology biopsies. Two sequencing biopsies were collected at each time point. Before sequencing, ethylenediaminetetraacetic acid (EDTA) application and microdissection were performed to isolate Barrett’s oesophagus (BE) tissue and improve purity for sequencing. Highlighted box indicates isolated Barrett’s oesophagus tissue (box width indicates approximately 50 µm). d, WGS biopsies and histology biopsies were collected independently. Some histology and sequencing biopsies were taken at the same level of the oesophagus (on-level), and some histology biopsies fell within a ±1-cm window of the measured height of the sequencing biopsy (windowed histology). e, Experimental workflow for analysing the WGS samples. A brief overview of the process by which biopsies were selected, sequenced and characterized by AmpliconArchitect.
Fig. 2
Fig. 2. Association of ecDNA with histology.
a, Characterization of the ecDNA status and cancer stage of patient samples from the Cambridge cohorts of patients with early- and late-stage EAC. b, Comparison of the ecDNA status and histological group of samples reveals an association between ecDNA and early-stage EAC. The odds ratio (OR) and the confidence interval (CI) of the OR are shown. c, Characterization of the ecDNA status and on-level histology of samples collected for FHCC CO patients across time points TP-1 and TP-2 for the two oesophageal sequencing samples (‘upper’ and ‘lower’). The maximum histology of any biopsy from that time point is also shown. Asterisk indicates cancer diagnosis made at next endoscopy (1.44 and 8.16 months after TP-2 for patients 568 and 772, respectively). d, Comparison of ecDNA status in any FHCC patient sample and cancer-outcome status among patients reveals an association between ecDNA and cancer outcome. e, Among FHCC CO patients, the proportion of TP-1 samples without HGD or EAC in on-level histology (having Barrett’s oesophagus or LGD) versus with HGD in the on-level histology, separated by ecDNA status, shows an enrichment for ecDNA with advanced disease status (Fisher’s exact test, one-sided). f, Among FHCC CO patients, the proportion of TP-2 samples without EAC in on-level histology (having HGD or Barrett’s oesophagus) versus with EAC in on-level histology, separated by ecDNA status, shows an association between ecDNA and the development of EAC (Fisher’s exact test, one-sided).
Fig. 3
Fig. 3. ecDNA and the malignant transformation.
a, Timeline of sample collection for FHCC CO patient 391 relative to patient age. Summary of the ecDNA status and windowed-histology status for four endoscopies, with the time interval between each indicated. The distance of the biopsy from the gastro-oesophageal junction (GEJ) is also shown. The two resection samples are labelled as E8 and C5. Two distinct species of ecDNA are labelled as ecDNA-1 and ecDNA-2. b, Inferred phylogeny of Barrett’s oesophagus samples from patient 391 across the four endoscopies, starting from TP53 alteration, with branching reporting the ecDNA formation events, annotated by the histological status of the sample (windowed). c, Left, structure of ecDNA-1, first detected in endoscopy 2, in which HGD was detected within ±1 cm. Right, structure of ecDNA-2, first detected in endoscopy 3, in which EAC was diagnosed and present within ±1 cm.
Fig. 4
Fig. 4. ecDNA properties.
a, Proportion of patients with ecDNA detected in any sample across all study cohorts. b, Maximum genomic copy number (CN) of ecDNA segments in pre-cancer samples and EAC (or EAC-linked for FHCC) samples, coloured by sample study source. c, Complexity score of focally amplified ecDNA-positive genomic regions for pre-cancer and EAC samples. d, For ecDNAs identified across multiple FHCC samples that were determined to be clonal on the basis of amplicon similarity, the increase in ecDNA copy number for each pair of clonal ecDNAs, separated by the difference in associated histology of the two samples, shows an association between increasing copy number and increasing histological severity. e, Number of distinct ecDNAs per sample, among the ecDNA-positive samples, from all combined sources of data. f, Comparative overlap of Barrett’s-oesophagus-associated oncogenes found on ecDNA in the four cohorts. g, For oncogenes recurrently detected on ecDNA in samples from different patients, the number of patients with a sample that has the listed oncogene included on ecDNA. h, Oncogene copy number for the focally amplified oncogene with the highest copy number on each unique focal amplification (ecDNA or non-ecDNA fsCNA) is significantly higher on ecDNA versus non-ecDNA fsCNA.
Extended Data Fig. 1
Extended Data Fig. 1. Oncoprint tables for the Cambridge data.
a, Oncoprint table for samples from Cambridge patient with Barrett’s oesophagus and EAC segregated by histology type showing ecDNA status, histology or cancer stage (if applicable) TP53 alteration (by mutational analysis, involving at least one copy), BFB status, other fsCNA (non-BFB, non-ecDNA) status and prior therapy (chemotherapy or radiation) on the tumours in patients with cancer. b, Proportion of Cambridge EAC tumour samples with ecDNA separated by tumour stage I versus stage II or higher.
Extended Data Fig. 2
Extended Data Fig. 2. Oncoprint tables for the FHCC cancer-outcome data.
Oncoprint tables of samples from FHCC CO patient WGS samples encoding ecDNA status, BFB status, other fsCNA (non-BFB, non-ecDNA) status, TP53 alteration (at least one gene copy affected), WGD status and chromothripsis status, as well as on-level and windowed histology for each time point and both upper and lower oesophageal samples for time points TP-1 and TP-2. Maximum histology from any histology biopsy is shown at the bottom of each time point. Asterisk indicates cancer diagnosis made at next endoscopy since biopsies from the diagnostic EAC endoscopy were unavailable for CO patient ID 772 and lacked sufficient DNA for CO patient ID 568, so biopsies from the penultimate endoscopy were substituted (occurring 1.44 and 8.16 months after TP-2 for patients 568 and 772, respectively).
Extended Data Fig. 3
Extended Data Fig. 3. Oncoprint tables for the FHCC non-cancer-outcome data.
Oncoprint tables of FHCC NCO patient WGS samples encoding ecDNA status, BFB status, other fsCNA (non-BFB, non-ecDNA) status, TP53 alteration (at least one gene copy affected), WGD status and chromothripsis status, as well as on-level and windowed histology for each time point and both upper and lower oesophageal samples for time points TP-1 and TP-2. Maximum histology from any histology biopsy is shown at the bottom of each time point.
Extended Data Fig. 4
Extended Data Fig. 4. Analysis of ecDNA evolution.
The KRAS-bearing ecDNA focal amplification detected in biopsies from FHCC NCO patient 303 at time point TP-1 and time point TP-2. Amplicon similarity analysis reveals a common origin of the ecDNA, and ecDNA copy number and complexity increased during the 1.61 years between samples. P value assessed against a beta-distribution model fit to distribution of similarity scores among genomically overlapping focal amplifications from independent samples (Supplementary Information).
Extended Data Fig. 5
Extended Data Fig. 5. Oncoprint tables for FHCC non-cancer-outcome long-term follow-ups.
a, Oncoprint tables of biopsies from NCO patients from the FHCC cohort with long-term follow-ups (in orange, collected median 9.6 years after TP-2). b, Distribution of FHCC NCO follow-up durations from TP-2 to the time at which the patient was last known to be alive (top, mean = 13.9 years) or TP-2 to death (bottom, mean = 8.6 years).
Extended Data Fig. 6
Extended Data Fig. 6. Association of ecDNA with other genomic features.
a, Association of ecDNA presence and TP53 status in biopsies from patients from the FHCC cohort. b, Association of ecDNA presence and TP53 status in samples from patients from the Cambridge cohort, respectively for FHCC and Cambridge. c, Proportion of FHCC samples with WGD separated by TP53 alteration status. d, Proportion of FHCC samples with chromothripsis separated by TP53 alteration status. e, Proportion of TP53 alteration FHCC samples with ecDNA, separated by WGD status. f, Proportion of TP53 alteration FHCC samples with ecDNA, separated by chromothripsis status. All statistical differences in frequencies were assessed by one-sided Fisher’s exact test.
Extended Data Fig. 7
Extended Data Fig. 7. Focal amplification evolution.
a, Barrett’s oesophagus segment samples from patient 391 show conserved focal amplification of BFB and emergence of ecDNA between time points TP-1 and TP-2. b, The structure of ecDNA-1 detected in the lower pre-cancer sample from TP-2 in patient 391, in which HGD was in the histology window, and an identical structure derived from the adenocarcinoma resection. c, The structure of ecDNA-2, detected in the upper sample from TP-2 in patient 391, in which EAC was present in the histology window, and an identical structure derived from the adenocarcinoma resection. Amplicon similarity analysis of ecDNA-1 and -2 reveals common origins of the structures.
Extended Data Fig. 8
Extended Data Fig. 8. Sizes of intervals captured on ecDNA.
The length of predicted genomic intervals captured on ecDNA, visualized on a log10 scale, for each distinct ecDNA in the combined cohorts, compared by pre-cancer versus EAC (Mann–Whitney U test, two-sided).
Extended Data Fig. 9
Extended Data Fig. 9. Frequencies of ecDNA-borne oncogenes.
a, For oncogenes detected on ecDNA in samples from at least one patient, the number of patients with at least one sample having the oncogene listed on ecDNA, and the frequency of that gene on other types of focal amplifications. b, Proportion of the set of possible unique genes on ecDNA, separated by oncogene status. Difference assessed by one-sided Fisher’s exact test. c, Distribution of the number of oncogenes on individual ecDNA.
Extended Data Fig. 10
Extended Data Fig. 10. Frequencies of ecDNA-borne immunomodulatory genes.
a, For immunomodulatory-associated genes detected on ecDNA, the number of patients with at least one sample having the gene listed on ecDNA, and the frequency of that gene on other focal amplifications as well. b, Copy number for the highest copy number focally amplified immunomodulatory-associated gene in each unique amplicon that was ecDNA or non-ecDNA fsCNA. ecDNAs show a significantly higher copy number of immunomodulatory-associated genes on ecDNA versus non-ecDNA fsCNA (Mann–Whitney U test, one-sided).

Comment in

Similar articles

Cited by

References

    1. Turner KM, et al. Extrachromosomal oncogene amplification drives tumour evolution and genetic heterogeneity. Nature. 2017;543:122–125. doi: 10.1038/nature21356. - DOI - PMC - PubMed
    1. Nathanson DA, et al. Targeted therapy resistance mediated by dynamic regulation of extrachromosomal mutant EGFR DNA. Science. 2014;343:72–76. doi: 10.1126/science.1241328. - DOI - PMC - PubMed
    1. Kim H, et al. Extrachromosomal DNA is associated with oncogene amplification and poor outcome across multiple cancers. Nat. Genet. 2020;52:891–897. doi: 10.1038/s41588-020-0678-2. - DOI - PMC - PubMed
    1. Verhaak RGW, Bafna V, Mischel PS. Extrachromosomal oncogene amplification in tumour pathogenesis and evolution. Nat. Rev. Cancer. 2019;19:283–288. doi: 10.1038/s41568-019-0128-6. - DOI - PMC - PubMed
    1. Wu S, Bafna V, Chang HY, Mischel PS. Extrachromosomal DNA: an emerging hallmark in human cancer. Annu. Rev. Pathol. 2022;17:367–386. doi: 10.1146/annurev-pathmechdis-051821-114223. - DOI - PMC - PubMed

Publication types