. 2023 May;617(7960):395-402.
doi: 10.1038/s41586-023-05946-4. Epub 2023 Apr 12.

Noncoding translation mitigation

Affiliations

Noncoding translation mitigation

Jordan S Kesner et al. Nature. 2023 May.

Abstract

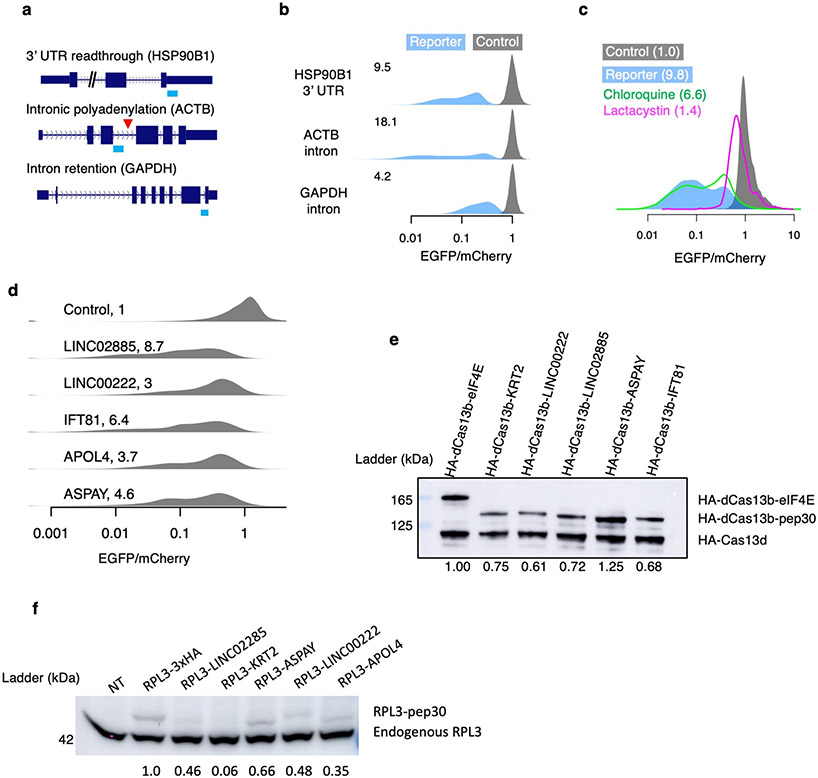
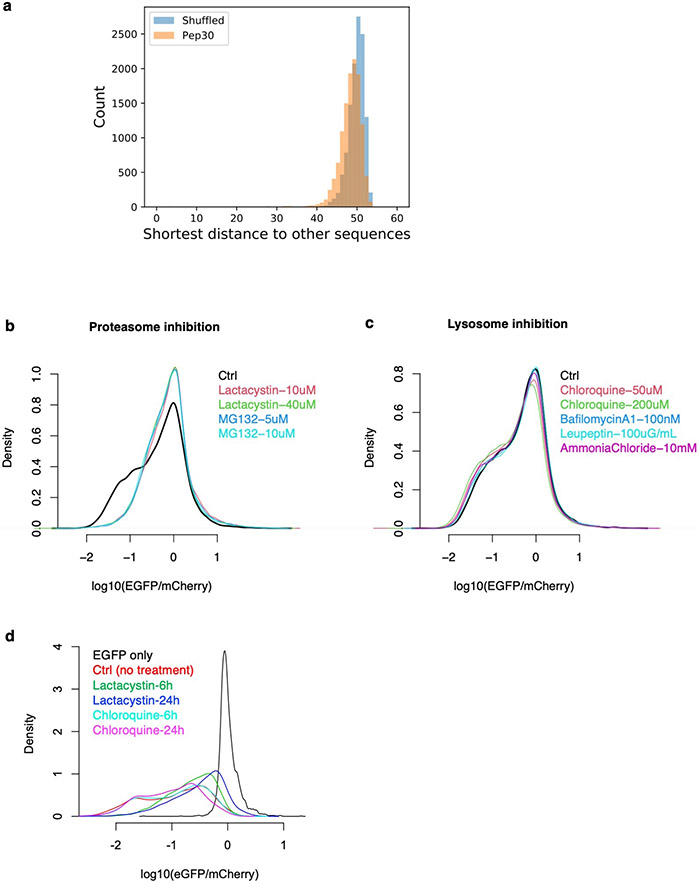
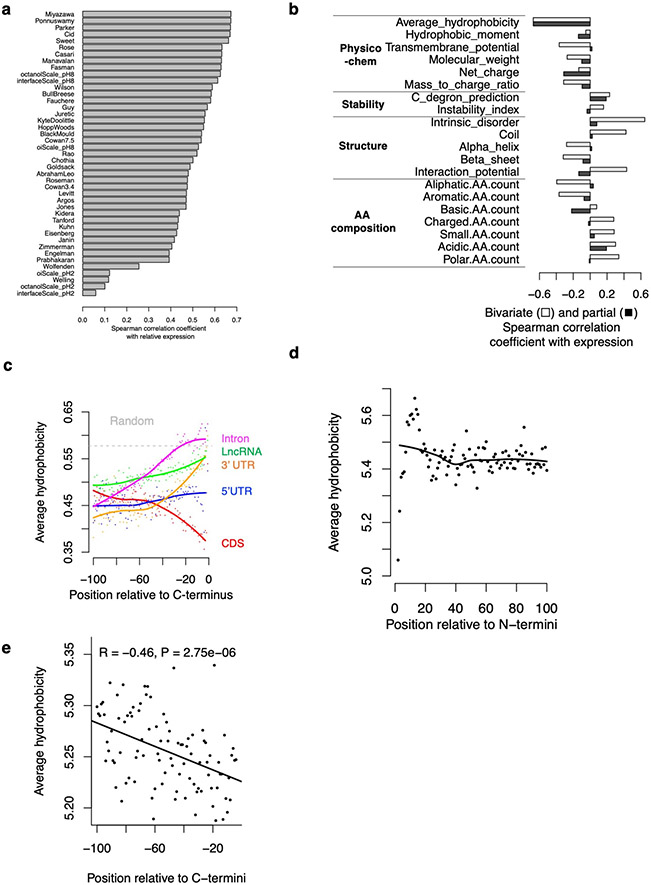
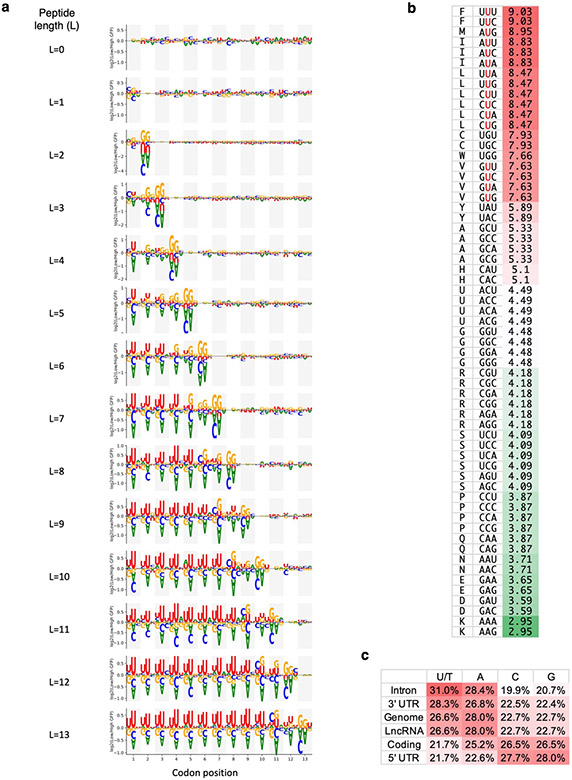
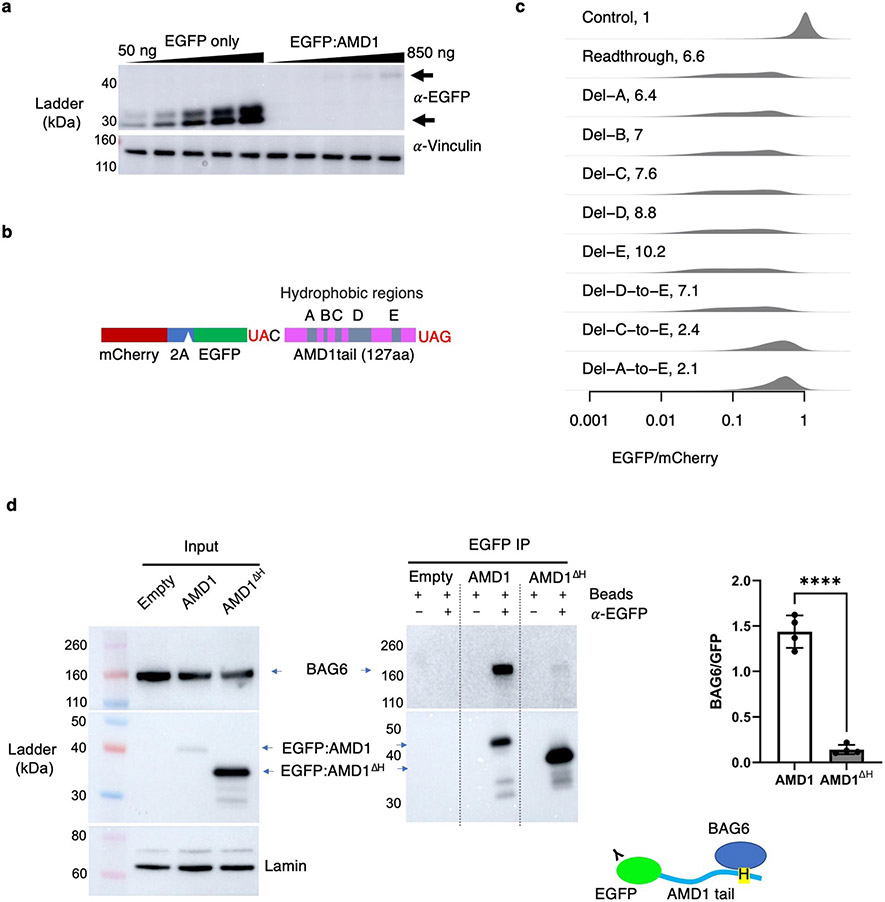
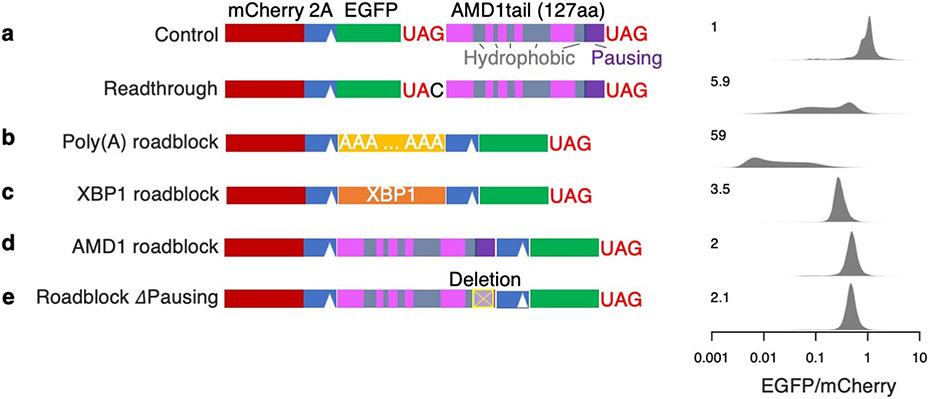
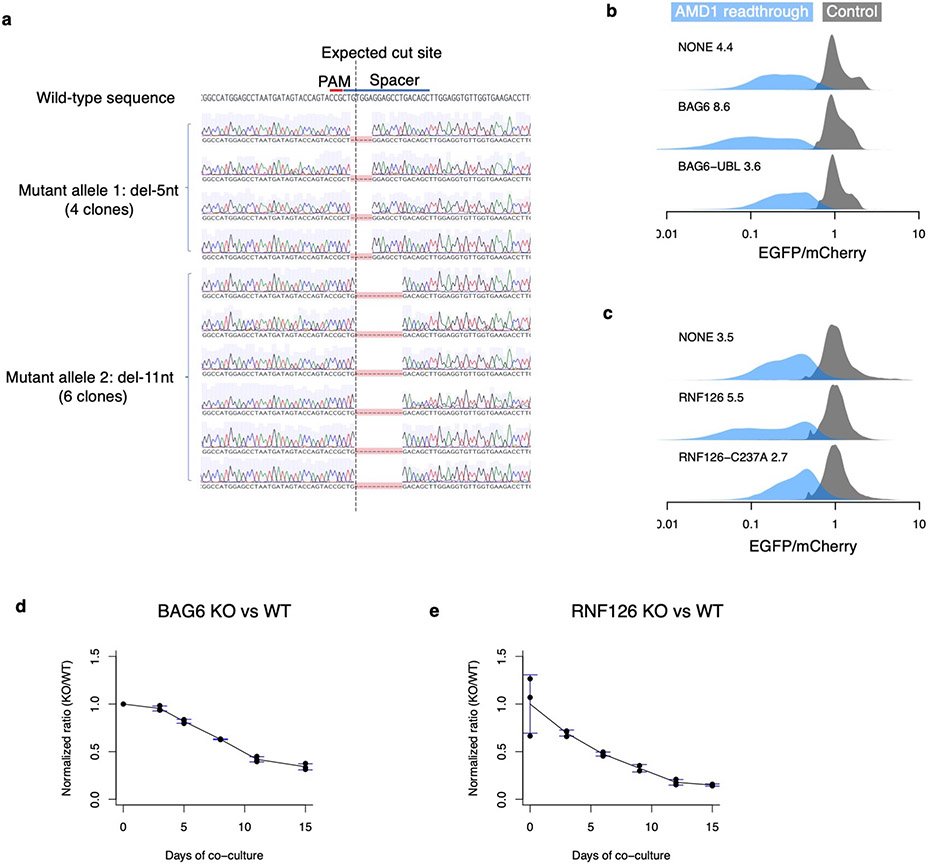
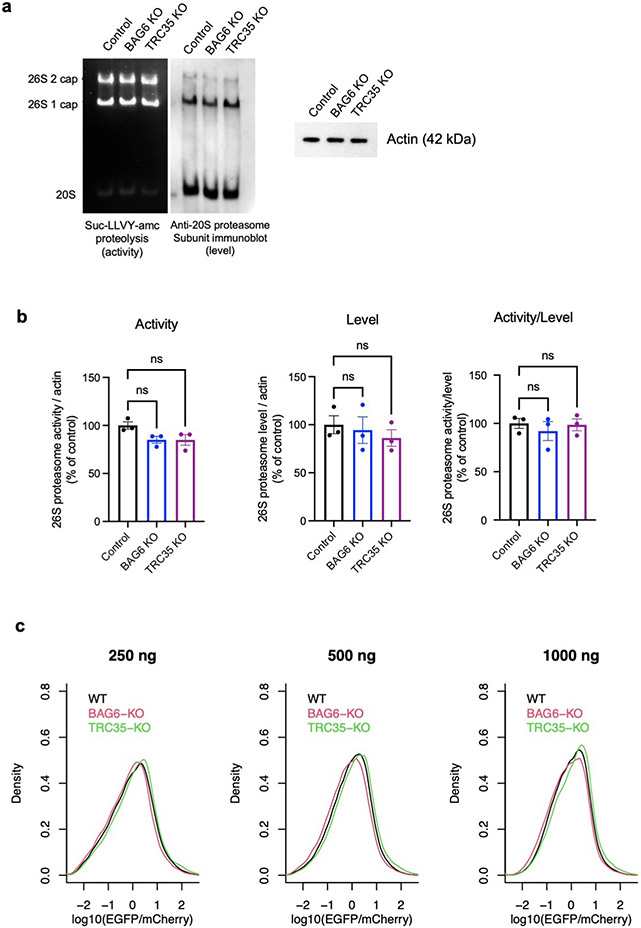
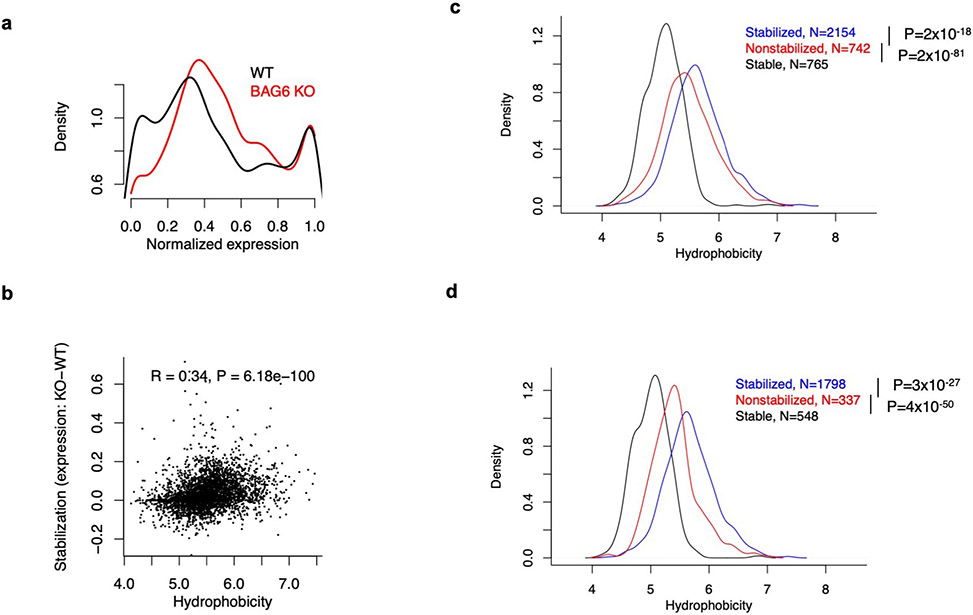
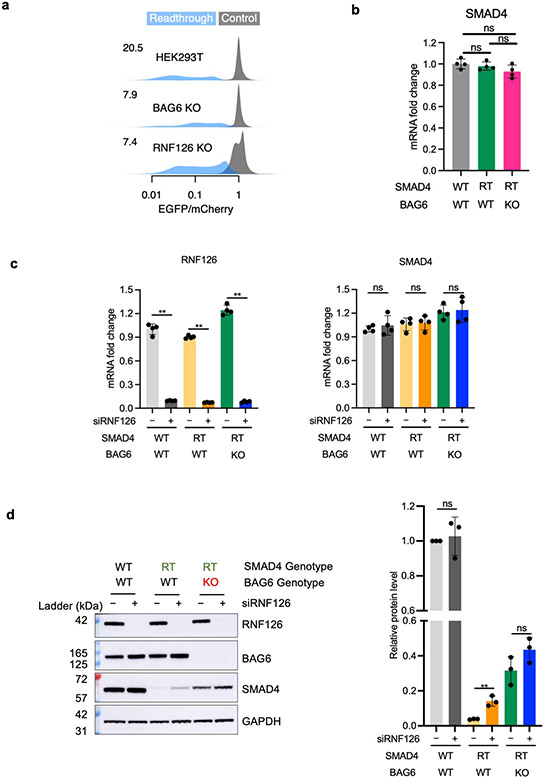
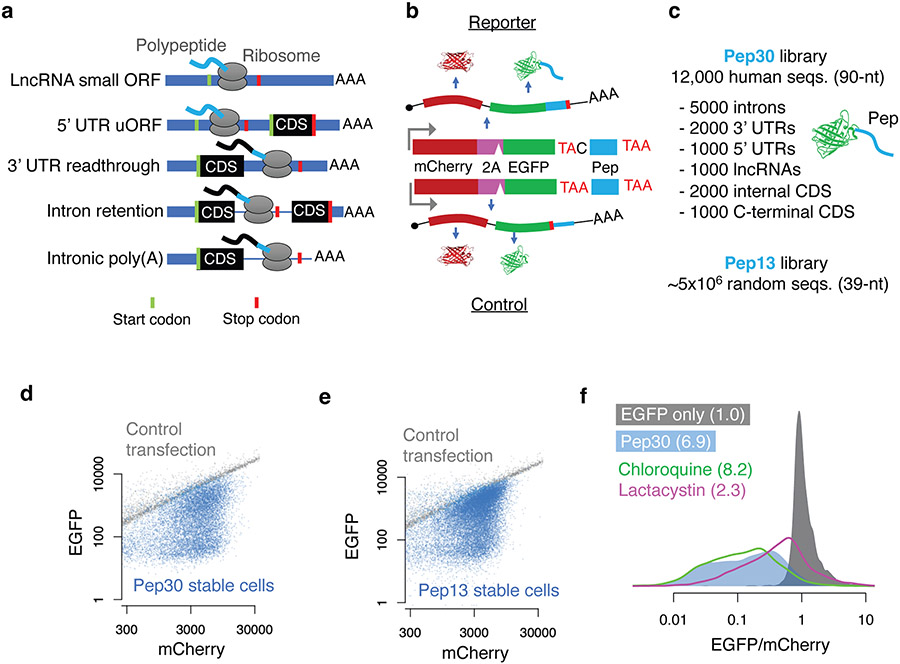
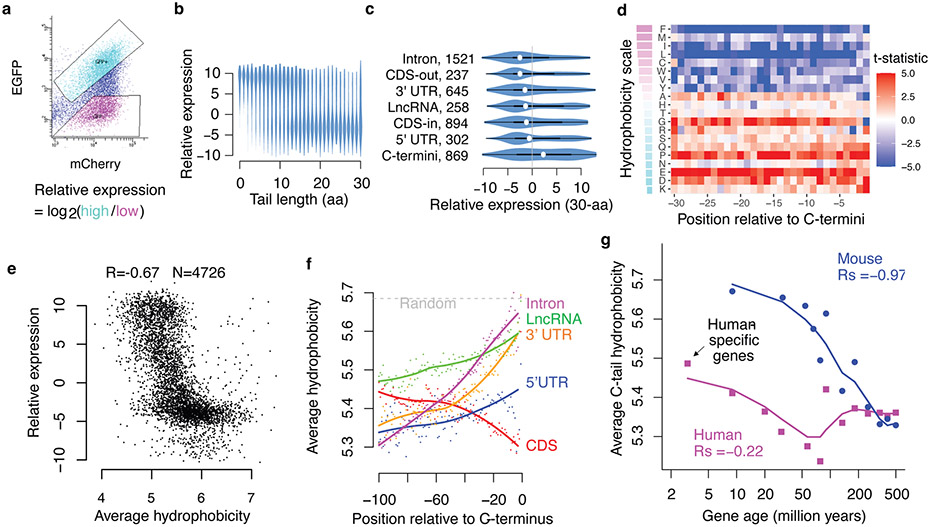
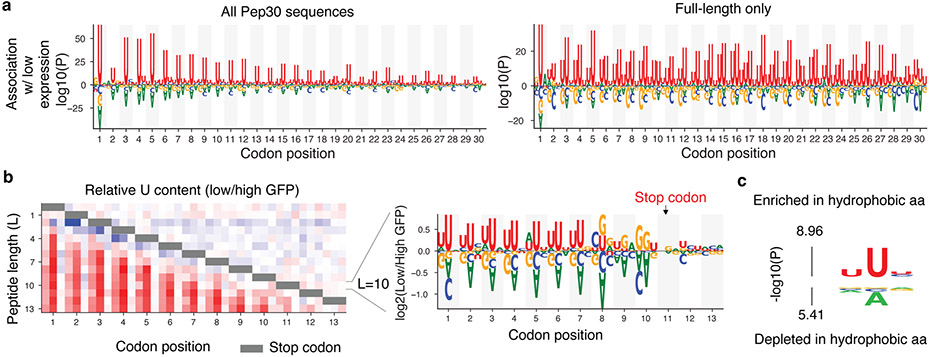
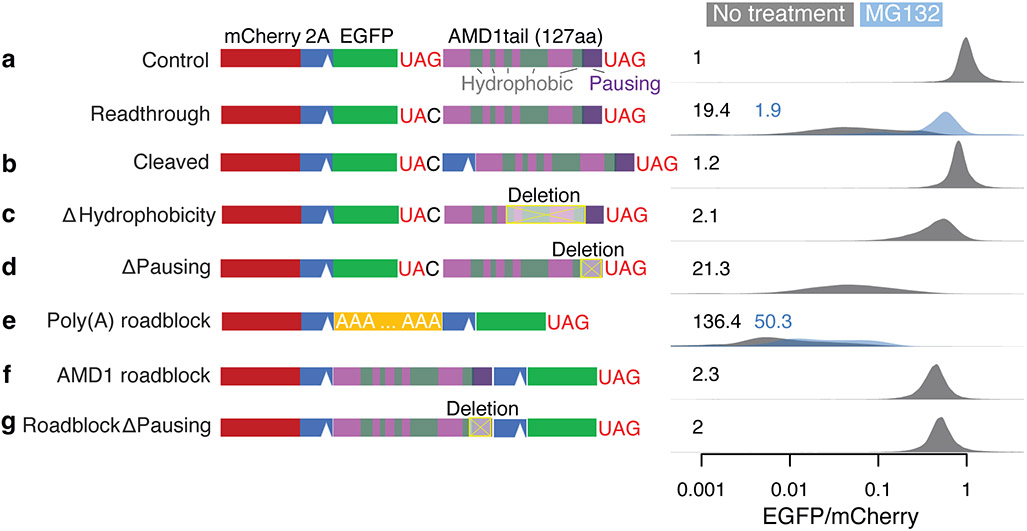
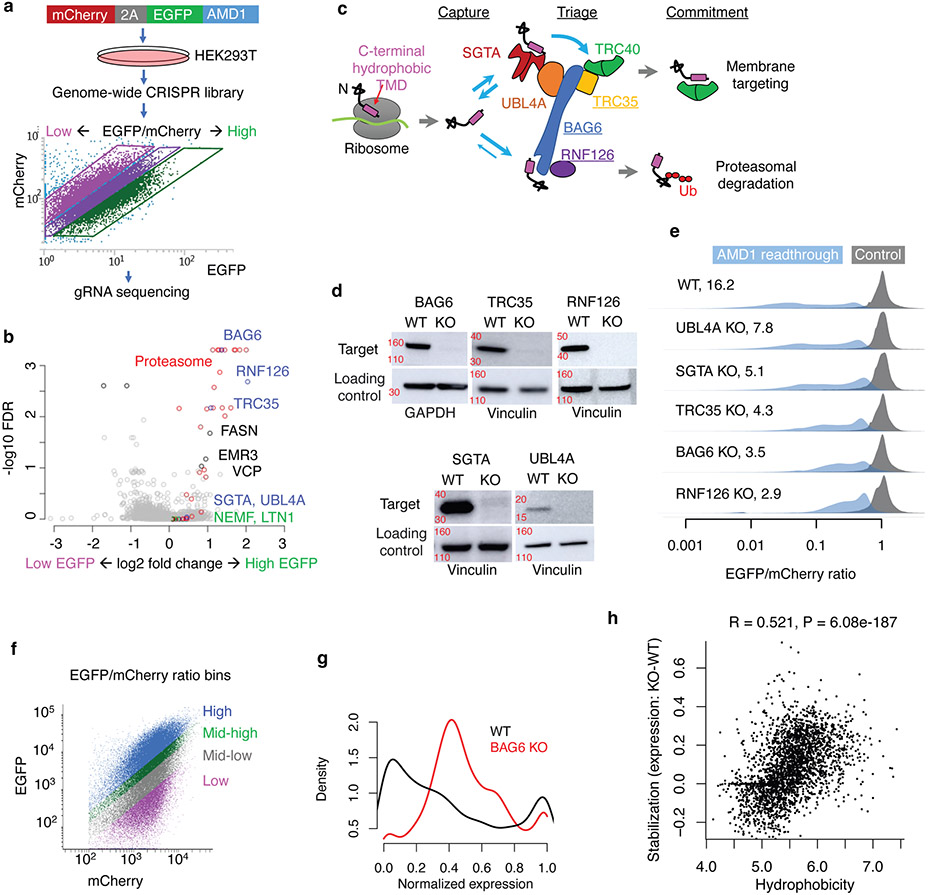
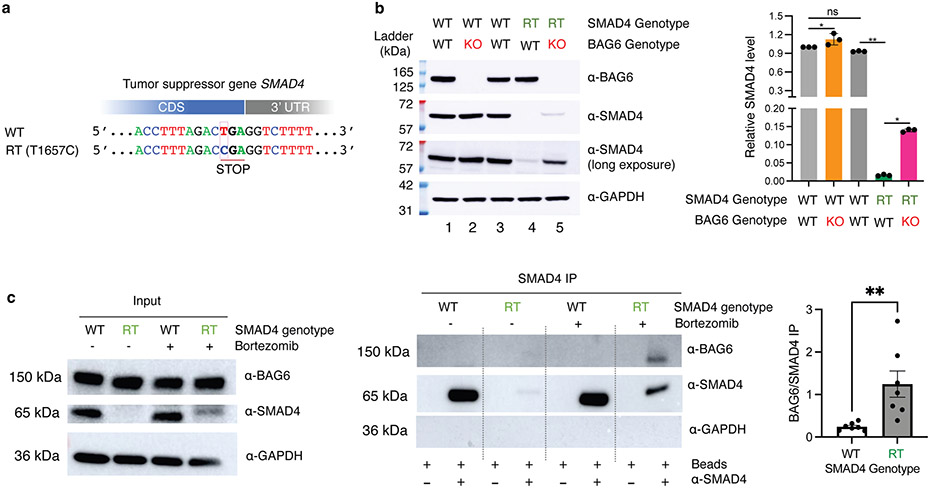
Translation is pervasive outside of canonical coding regions, occurring in long noncoding RNAs, canonical untranslated regions and introns1-4, especially in ageing4-6, neurodegeneration5,7 and cancer8-10. Notably, the majority of tumour-specific antigens are results of noncoding translation11-13. Although the resulting polypeptides are often nonfunctional, translation of noncoding regions is nonetheless necessary for the birth of new coding sequences14,15. The mechanisms underlying the surveillance of translation in diverse noncoding regions and how escaped polypeptides evolve new functions remain unclear10,16-19. Functional polypeptides derived from annotated noncoding sequences often localize to membranes20,21. Here we integrate massively parallel analyses of more than 10,000 human genomic sequences and millions of random sequences with genome-wide CRISPR screens, accompanied by in-depth genetic and biochemical characterizations. Our results show that the intrinsic nucleotide bias in the noncoding genome and in the genetic code frequently results in polypeptides with a hydrophobic C-terminal tail, which is captured by the ribosome-associated BAG6 membrane protein triage complex for either proteasomal degradation or membrane targeting. By contrast, canonical proteins have evolved to deplete C-terminal hydrophobic residues. Our results reveal a fail-safe mechanism for the surveillance of unwanted translation from diverse noncoding regions and suggest a possible biochemical route for the preferential membrane localization of newly evolved proteins.


Conflict of interest statement

CONFLICT OF INTEREST

None.

Figures

Extended Data Fig. 1 ∣
Extended Data Fig. 1 ∣. Translation surveillance of representative noncoding sequences.
a, Noncoding sequences in the HSP90B1 3’ UTR, an ACTB intron, and a GAPDH intron were cloned into the bicistronic reporter system shown in Fig. 1b. b, Density plots for the distribution of EGFP/mCherry ratios as measured by flow cytometry 24 hours after reporter transfection. The median fold loss of EGFP/mCherry ratio relative to control is shown on the top left corner of each density plot. c, Density plot of the EGFP/mCherry ratio for cells transfected with either the control or the ACTB intron reporter, alone or with simultaneous treatment of either proteasome inhibitor (lactacystin) or lysosome inhibitor (chloroquine). The numbers indicate the median fold loss of EGFP/mCherry relative to control. d-f, six noncoding sequences from the Pep30 library (KRT2 intron, APOL4 intron, LINC00222, LINC02885, ASPAY 3’ UTR, and IFT81 3’ UTR) were selected and cloned into either the original mCherry-EGFP bicistronic reporter (d, cloning failed for KRT2), fused to the C-terminus of HA-tagged PspCas13b protein (e, cloning failed for APOL4), or fused to the C-terminus of RPL3 (f, cloning failed for IFT81). d, Same as b for indicated noncoding sequences. e, Equal amount of HA-dPspCas13b-pep30 reporter plasmids were co-transfected with a HA-RfxCas13d plasmid and the protein abundance was assayed by western blotting with an HA antibody. HA-dCas13b fused to human protein eIF4E was used as a control. The abundance of HA-dCas13b-pep30 was quantified by first normalizing to HA-Cas13d then to eIF4E fusion. f, Equal amount of RPL3 reporter plasmids were transfected into HEK293T cells and western blots were performed using an RPL3 antibody, which detects both endogenous RPL3 (lower bands) and the RPL3 reporter protein (upper bands). NT: no transfection control. The level of the reporter protein was first normalized to endogenous RPL3 and then to the RPL3-3xHA sample. N=4 biological replicates.
Extended Data Fig. 2 ∣
Extended Data Fig. 2 ∣. Characterization of the Pep30 library.
a, Sequence diversity in the Pep30 library. The pairwise hamming distance (number of nucleotides that are different) between any two sequences (of 90-nt) in the library was calculated. Subsequently for each sequence, we identify the shortest distance to any other sequence in the library. The result showed that the vast majority (98%) of Pep30 sequences are at least 40 nt (out of 90 nt) different from other sequences in the library, with a median distance of 48. This is very close the distribution when the Pep30 library sequences are shuffled (median: 50). The result indicated that our Pep30 library is nearly as diverse as one can get from entirely unrelated sequences. b-d, Effect of proteasome inhibition or lysosome inhibition on the Pep30 library. b, Pep30 cells were treated with proteasome inhibitors for 8 hours and then analyzed with flow cytometry. Ctrl: Pep30 cells without treatment. c, Same as (b) for multiple lysosome inhibitors. d, longer (24h vs. 6h) proteasome inhibition but not lysosome inhibition resulted in more rescue.
Extended Data Fig. 3 ∣
Extended Data Fig. 3 ∣. Hydrophobicity analyses in the Pep30 library and the human genome.
a, The correlation coefficient between Pep30 reporter expression and average hydrophobicity calculated using various scales. b, Spearman correlation coefficient (light bar) between various properties of the Pep30 sequences and reporter expression. Dark bar: partial correlation conditioned on average hydrophobicity. c. Same as Fig. 2f with a different hydrophobicity scale (Ponnuswamy instead of Miyazawa). d, Average hydrophobicity for the first 100 aa (N-termini) of annotated proteins (N= 38,933). e, Average hydrophobicity of the C-termini of annotated proteins without any annotated protein domains in the last 100aa (N=8,586). Shown are the Spearman correlation coefficient R and the P value of a two-sided Spearman’s correlation test. No adjustments were made for multiple comparisons.
Extended Data Fig. 4 ∣
Extended Data Fig. 4 ∣. Bias in the genetic code drives hydrophobicity.
a, Same as Fig. 3b (right) for all peptide lengths. b, Codons ranked by the hydrophobicity of the corresponding amino acids. c, Nucleotide composition in different types of regions in the human genome.
Extended Data Fig. 5 ∣
Extended Data Fig. 5 ∣. AMD1 3’ UTR translation mitigation.
a, Western blot confirming the loss of the EGFP-AMD1 tail fusion protein. HEK293T cells were transfected with varying amount of the AMD1 3’ UTR readthrough reporter plasmid, from 50ng to 850ng. (N = 2 biologically independent samples). b, The AMD1 3’ UTR translation reporter with the hydrophobic region in the AMD1 tail highlighted (A-E). c, Impact of deleting individual hydrophobic regions or larger regions on the EGFP/mCherry ratio. The number in each plot is the median decrease of the EGFP/mCherry ratio relative to controls. d, BAG6 co-immunoprecipitates with EGFP:AMD1 fusion protein but not a mutated fusion protein with the functional hydrophobic region C-to-E deleted (AMD1ΔH). N=4 biologically independent samples over 2 independent experiments for the quantification. Data are presented as mean values +/− s.d. P values calculated using two-sided Student’ t-test. No adjustments were made for multiple comparisons. ****: P < 0.0001.
Extended Data Fig. 6 ∣
Extended Data Fig. 6 ∣. Ribosome roadblock effect: comparing the AMD1 tail sequence, poly(A) and the XBP1 stalling sequence.
a-e, Reporter constructs shown on the left were transfected into HEK293T cells. The EGFP/mCherry ratio was quantified in individual cells using flow cytometry with distributions shown on the right on a log-10 scale. The number in each plot is the median fold-decrease of the EGFP/mCherry ratio. Note that AMD1 sequence causes less decrease in EGFP compared to both XBP1 and poly(A) sequences, and even this weak effect is independent of the putative pausing sequence in AMD1.
Extended Data Fig. 7 ∣
Extended Data Fig. 7 ∣. Characterization of the BAG6 KO cells and RNF126 KO cells.
a, Genotyping the BAG6 clonal knockout cell line. Sanger sequencing of 10 clones of PCR-amplified genomic DNA confirmed that the BAG6 KO cells contain a frameshift mutation in both alleles, one with a 5-nt deletion and the other with an 11-nt deletion around the expected Cas9 cut site. b, Re-expressing wild type BAG6 but not an inactive mutant missing the UBL domain for recruiting RNF126 (BAG6-UBL) partially reverses BAG6 KO phenotype as measured by the destabilization of AMD1 readthrough product. c, Same as b but comparing wild type RNF126 and an inactive mutant with a C237A mutation in the active site. d-e, Growth defect of BAG6 KO cells (d) and RNF126 KO cells (N=3 biologically independent samples) (e) revealed by competitive growth assays. KO cells and WT cells were mixed and co-cultured for 15 days and the relative cell numbers (KO/WT) at each time point was determined by decomposition of sanger sequencing traces as described in Methods. N=1 for day 0 of BAG6 and N=3 biologically independent samples for all other time points. Data are presented as mean values +/− s.d.
Extended Data Fig. 8 ∣
Extended Data Fig. 8 ∣. BAG6 or TRC35 knockout does not affect proteasome activity or level.
a, Representative result from in-gel proteasome activity assay showing proteasome hydrolysis activity (left) and representative immunoblot probing for a subunits levels of the 26S 1- and 2-cap proteasome and 20S proteasome (middle). Cell lysates were run on 4% nondenaturing (native) gels and incubated with fluorogenic Suc-LLVY-amc proteasome substrate to determine relative activities or immunoblotted to determine relative levels. Samples (10.5 μg protein/well) were run separately under denaturing conditions for immunoblot probing for actin as a sample processing control (right). b, The level of 26S 1- and 2-cap proteasome detected by immunoblotting normalized to actin in the same sample (left), densitometric quantification of 26S 1- and 2-cap proteasome in-gel activity normalized by actin in the same sample (middle), and the activity/level ratio (right). Data are expressed mean ± SEM for three biological replicates, where each value represents the activity/level ratio calculated by averaging four technical replicates of activity and level values. One-way ANOVA was used for statistical analysis, with P < 0.05 considered significant. c, Similar result with in vivo proteasome activity reporter assays. The proteasome activity reporter UbG76V-EGFP was co-transfected with mCherry (1:1) into cells and the EGFP/mCherry ratio measured by flow cytometry was used as an indicator of proteasome activity in cells. The distribution the EGFP/mCherry ratio in WT, BAG6 KO, and TRC35 KO cells at 250 ng, 500 ng, and 1000 ng total plasmid were shown.
Extended Data Fig. 9 ∣
Extended Data Fig. 9 ∣. Replicating the Pep30 reporter assay in BAG6 KO cells.
The sequencing-based assay shown in Fig. 5f-h was repeated starting from cell sorting. a, Same as Fig. 5g. b, Same as Fig. 5h. c, full-length Pep30 reporter sequences with a minimum of 3000 reads (all four bins combined) were divided into three groups: those that are stable in wild-type cells (normalized expression >0.8), those that are unstable in wild type cells but are stabilized (increased expression) in BAG6 KO cells, and those that are unstable in wild type cells and are not stabilized in BAG6 KO cells. Shown are the density plot of the hydrophobicity of sequences in each group. d, same as c for the replicate shown in Fig. 5. P values were calculated using two-sided Mann-Whitney U test. No adjustments were made for multiple comparisons.
Extended Data Fig. 10 ∣
Extended Data Fig. 10 ∣. BAG6 and RNF126 mediate the degradation of SMAD4 readthrough products.
a, A dual color reporter fusing SMAD4 3’ UTR encoded peptide to the C-terminus of EGFP was tested in wild-type HEK293T cells, BAG6 KO cells, and RNF126 KO cells using flow cytometry as a readout. The number on the top left corner of each density plot is the median fold loss of EGFP/mCherry in the readthrough reporter relative to control. b, No significant change of SMAD4 mRNA level with BAG6 KO. RT: readthrough. N=4 biologically independent samples. Data are presented as mean values +/− s.d. c, Efficient RNF126 knockdown and the lack of impact on endogenous SMAD4 mRNA (qRT-PCR). N=4 biologically independent samples. Data are presented as mean values +/− s.d. d, Endogenous SMAD4 readthrough protein is stabilized by both BAG6 KO and RNF126 knockdown. Representative western blots on the left and quantification on the right. N=3 biologically independent samples. Data are presented as mean values +/− s.d. One-way ANOVA was used for statistical analysis, with P < 0.05 considered significant. **: P < 0.01. No adjustments were made for multiple comparisons.
Fig. 1 ∣
Fig. 1 ∣. Noncoding translation products are unstable.
a, Noncoding translation in diverse contexts generates a C-terminal tail derived from noncoding sequences. Green/red bars indicate start/stop codons, respectively. CDS: canonical protein-coding sequences. b, Top: a mCherry-2A-EGFP bicistronic reporter for monitoring noncoding translation. Bottom: a control plasmid with a single base difference abolishing noncoding translation. Pep: noncoding sequence derived peptide. c, Two cell libraries where each cell stably expresses EGFP extended with either a sequence randomly selected from the human transcriptome (up to 30 aa, Pep30) or a random sequence (up to 13 aa, Pep13). d, flow cytometry analysis of the Pep30 (d) or Pep13 cell library (e). Also shown are cells transfected with the EGFP-only control reporter (gray). f, Density plot of the EGFP/mCherry ratio for Pep30 stable cells without treatment (light blue), or treated with proteasome inhibitor (lactacystin, magenta) or lysosome inhibitor (chloroquine, green). The numbers indicate the median fold loss of EGFP/mCherry relative to control (gray, EGFP only).
Fig. 2 ∣
Fig. 2 ∣. Noncoding translation mitigation is associated with C-terminal hydrophobicity.
a, Pep30 stable cells were sorted into high and low EGFP bins and the tail sequences (DNA) were cloned and sequenced. The relative expression of each sequence is calculated as the log2 ratio of read counts in EGFP-high vs. EGFP-low bin. b, Violin plots of relative expression for tails of varying lengths. c, Violin and box plots comparing expression of 30-aa tails encoded by various types of sequences. The box indicates the minima, maxima, upper and lower quartiles and the white dot indicates the median value. The number of sequences in each category is indicated. CDS-out: frameshifted CDS. CDS-in: inframe CDS. d, A heatmap visualizing the association (Two-sided Student’s t-test statistics capped at 5.0) between expression and the presence of each amino acid at every position in the Pep30 library. Amino acids (rows) are sorted by hydrophobicity (Miyazawa scale). e, Average hydrophobicity vs. relative expression scatter plot for tails of 30-aa length. f, Genome-scale average hydrophobicity at each residue within the last 100-aa of peptides encoded by coding (>=200aa) and various noncoding sequences (>=30aa). g, Average C-tail (last 30aa) hydrophobicity of human (magenta) and mouse (blue) genes grouped by age based on time of origination estimated from vertebrate phylogeny. The lines are a loess fit of the dots.
Fig. 3 ∣
Fig. 3 ∣. A bias in the genetic code links instability and hydrophobicity with U-content.
a, Nucleotides enriched/depleted in reporters of low EGFP expression in the Pep30 library using all sequences (left) or only sequences encoding a full-length 30aa peptide (right). Nucleotides height scaled by log10 transformation of two-sided Mann-Whitney U test P values. b, A heatmap color-coding the log2 ratio of U frequency between Pep13 sequences in GFP-low bin vs. GFP-high bin for each nucleotide and codon position (column) and peptide length (L, row). Color bar: from −1 (blue) to +1 (red). Gray bar indicates positions of stop codons. Relative frequency of all four bases for L=10 (stop codon at codon position 11) are shown on the right. c, Probability logo showing enriched and depleted nucleotides in codons of hydrophobic amin acids in the genetic code. P values were computed using two-sided Mann-Whitney U tests.
Fig. 4 ∣
Fig. 4 ∣. AMD1 3’ UTR translation mitigation.
a-g, Reporter constructs shown on the left were transfected into HEK293T cells. The EGFP/mCherry ratio was quantified in individual cells using flow cytometry with distributions shown on the right on a log-10 scale. The number in each plot is the median fold-decrease of the EGFP/mCherry ratio. Data from cells treated with the proteasome inhibitor MG-132 are shown in blue.
Fig. 5 ∣
Fig. 5 ∣. BAG6 pathway mediates proteasomal degradation of noncoding translation products.
a, A CRISPR screen using the AMD1 reporter stably integrated into HEK293T cells. b, Gene-level summary of the CRISPR screen from MAGeCK. c, Schematic of the TRC/GET pathway targeting proteins with a C-terminal hydrophobic region. d, Representative western blots confirming the depletion of TRC proteins in KO cells (N=2 biologically independent samples). GAPDH was used as loading control for BAG6 and vinculin was used for all other proteins. Approximate location of nearest kDa molecular weight markers is shown in red. e, EGFP/mCherry ratio of the AMD1 reporter in WT and KO cells. (N=1). f, WT and BAG6 KO HEK293T cells were transduced with the Pep30 library and sorted into four bins with respect to EGFP/mCherry ratio and then sequenced. g, A density plot of normalized expression of each sequence in WT and BAG6 KO cells. h, A scatter plot of stabilization vs. average hydrophobicity of each tail peptide. Shown are the Spearman correlation coefficient R and the P value of a two-sided Spearman’s correlation test. No adjustments were made for multiple comparisons.
Fig. 6 ∣
Fig. 6 ∣. SMAD4 readthrough as endogenous substrate of BAG6.
a, The mutation T1657C disrupts SMAD4 stop codon and results in readthrough (RT) translation in the 3’ UTR. b, The SMAD4 readthrough protein is barely detectable in BAG6 wild-type (WT) cells (lane 4) but is stabilized in BAG6 KO cells (lane 5). RT: readthrough with homozygous T1657C mutations. Lane 1: parental WT cells for BAG6 KO. Lane 3: parental WT cells for SMAD4 RT. Bottom: quantification, N=3 biologically independent samples. Data are presented as mean values +/− s.d. c, BAG6 co-IP with SMAD4 readthrough products. Bortezomib: proteasome inhibitor. N=7 biologically independent samples. Data are presented as mean values +/− s.d. Two-sided Student’s t-test was used to calculate P values. No adjustments were made for multiple comparisons. *: P < 0.05; **: P < 0.01.

References

    1. Ingolia Nicholas T. et al. Ribosome Profiling Reveals Pervasive Translation Outside of Annotated Protein-Coding Genes. Cell Reports 8, 1365–1379, (2014). - PMC - PubMed
    1. Ji Z, Song R, Regev A & Struhl K Many lncRNAs, 5'UTRs, and pseudogenes are translated and some are likely to express functional proteins. Elife 4, e08890, (2015). - PMC - PubMed
    1. Weatheritt RJ, Sterne-Weiler T & Blencowe BJ The ribosome-engaged landscape of alternative splicing. Nat Struct Mol Biol 23, 1117–1123, (2016). - PMC - PubMed
    1. Sudmant PH, Lee H, Dominguez D, Heiman M & Burge CB Widespread Accumulation of Ribosome-Associated Isolated 3' UTRs in Neuronal Cell Populations of the Aging Brain. Cell Rep 25, 2447–2456 e2444, (2018). - PMC - PubMed
    1. Adusumalli S, Ngian ZK, Lin WQ, Benoukraf T & Ong CT Increased intron retention is a post-transcriptional signature associated with progressive aging and Alzheimer's disease. Aging Cell 18, e12928, (2019). - PMC - PubMed

Publication types