. 2023 Apr;616(7957):504-509.
doi: 10.1038/s41586-023-05923-x. Epub 2023 Apr 12.

Chromosomal fragile site breakage by EBV-encoded EBNA1 at clustered repeats

Affiliations

Chromosomal fragile site breakage by EBV-encoded EBNA1 at clustered repeats

Julia Su Zhou Li et al. Nature. 2023 Apr.

Abstract

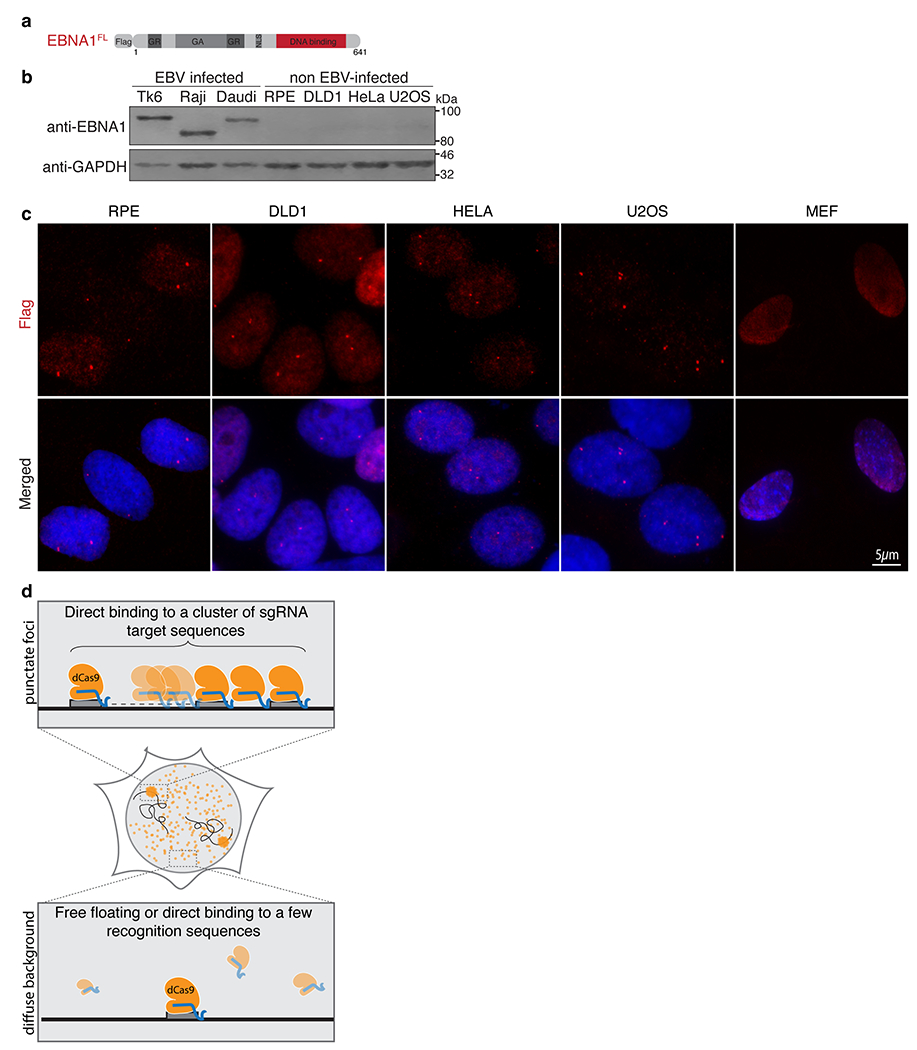
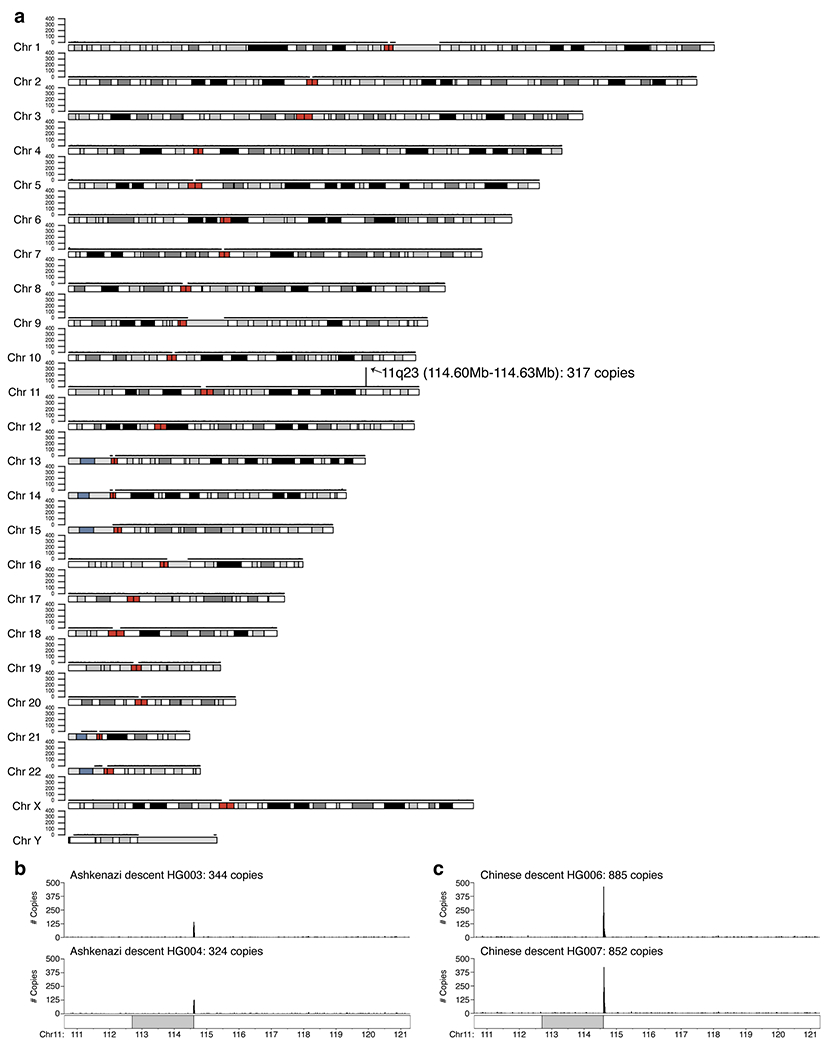
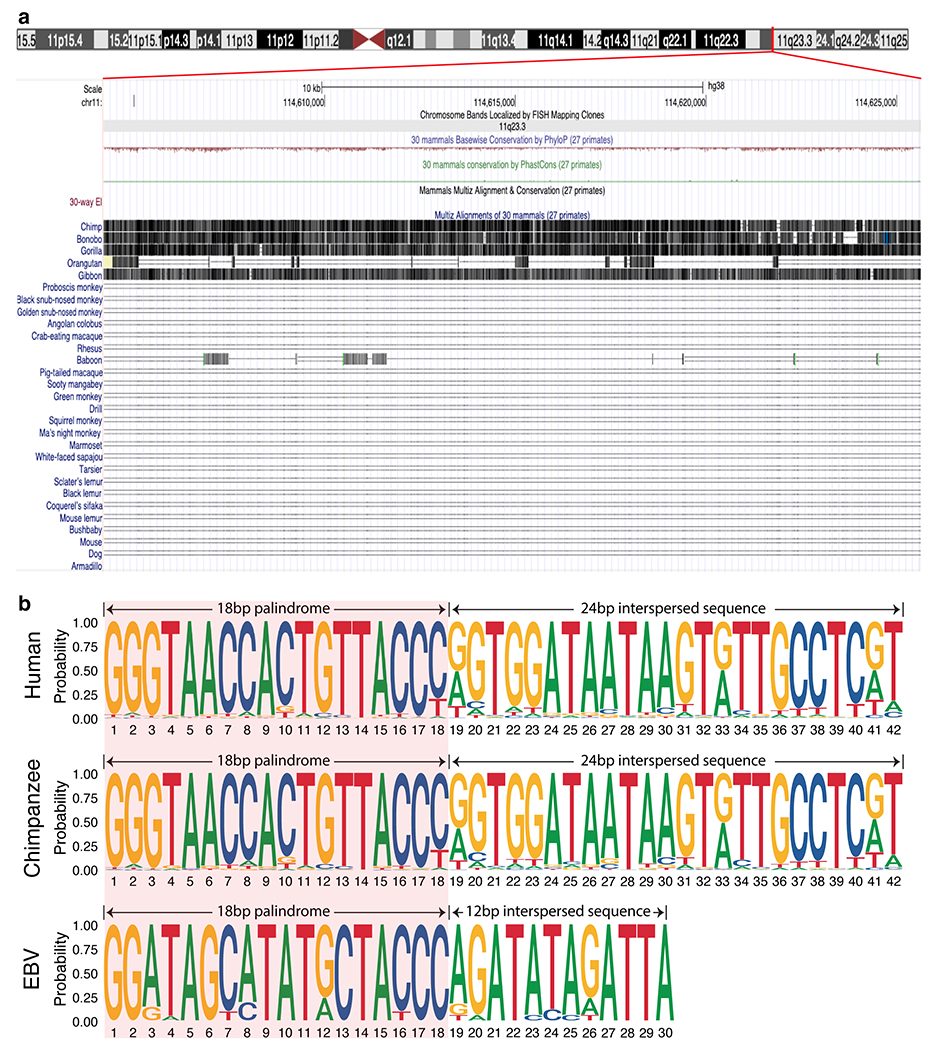
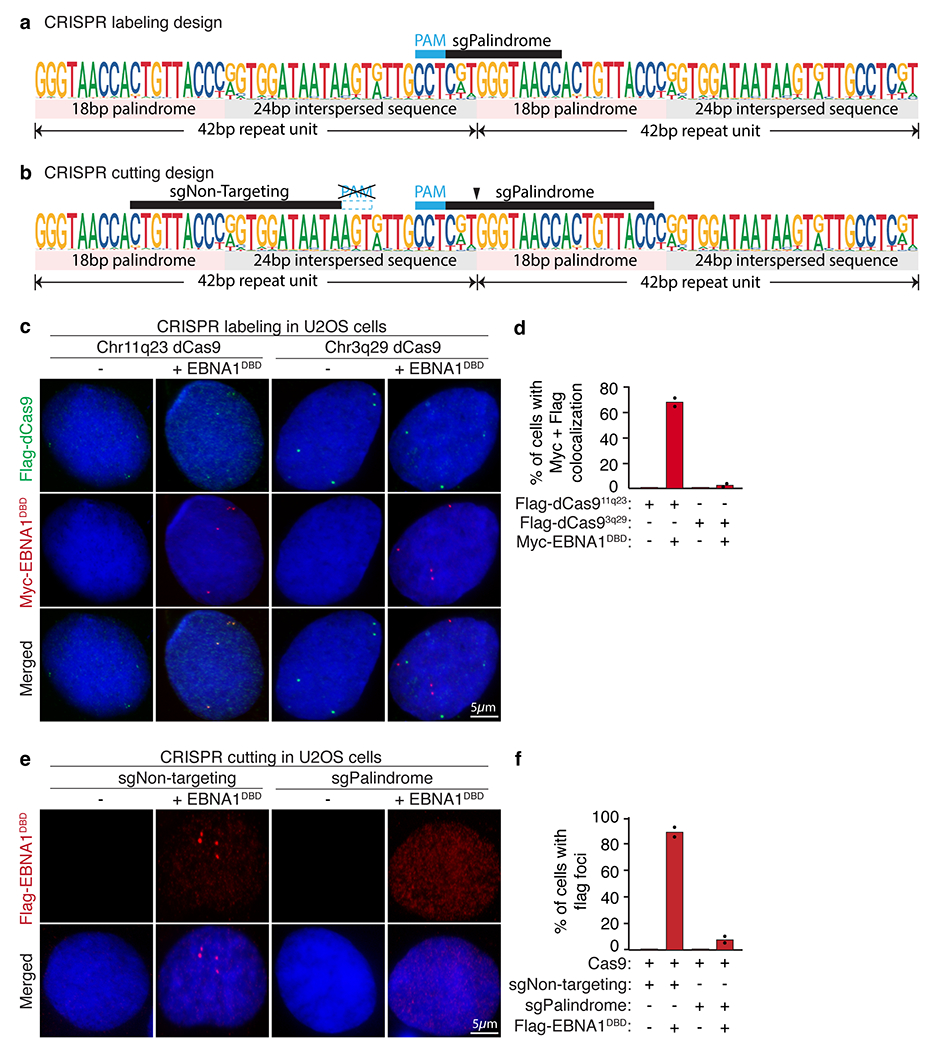
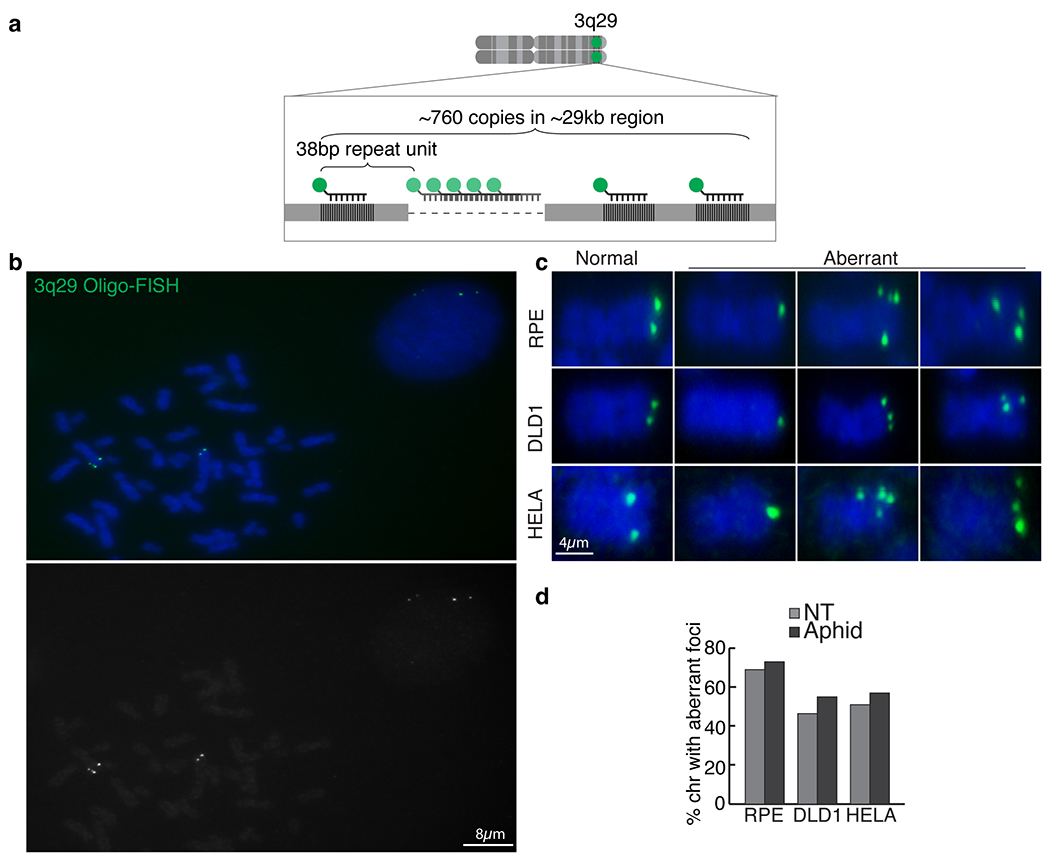
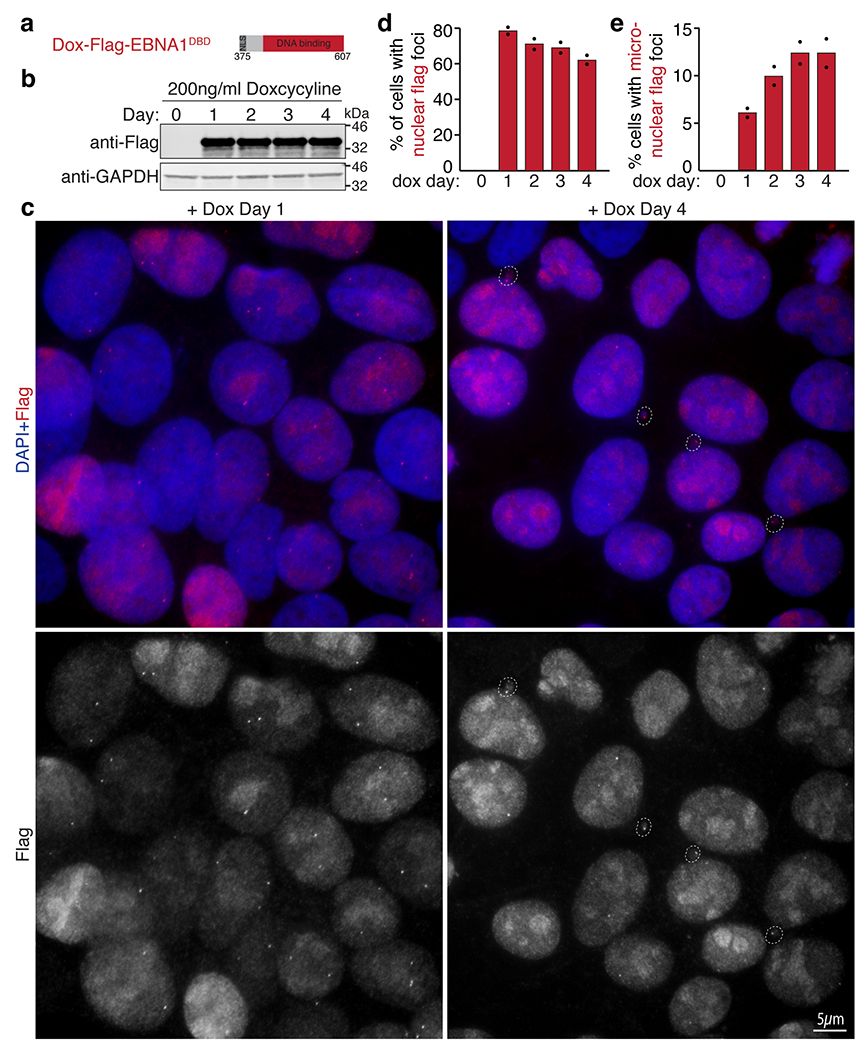
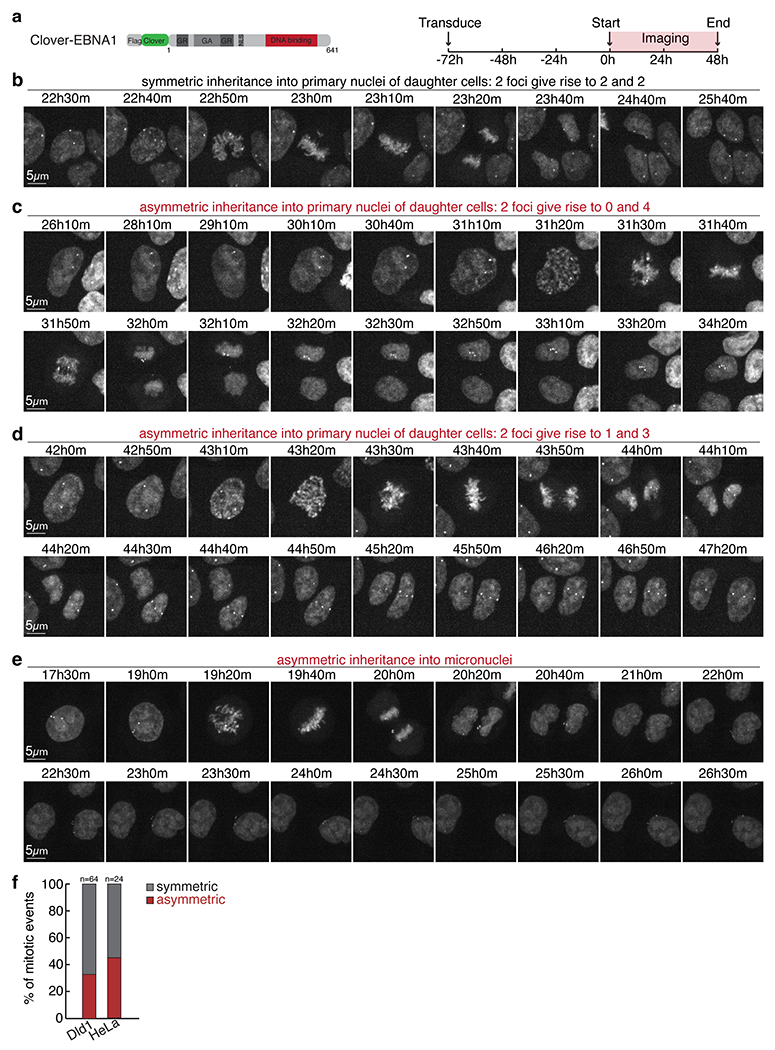
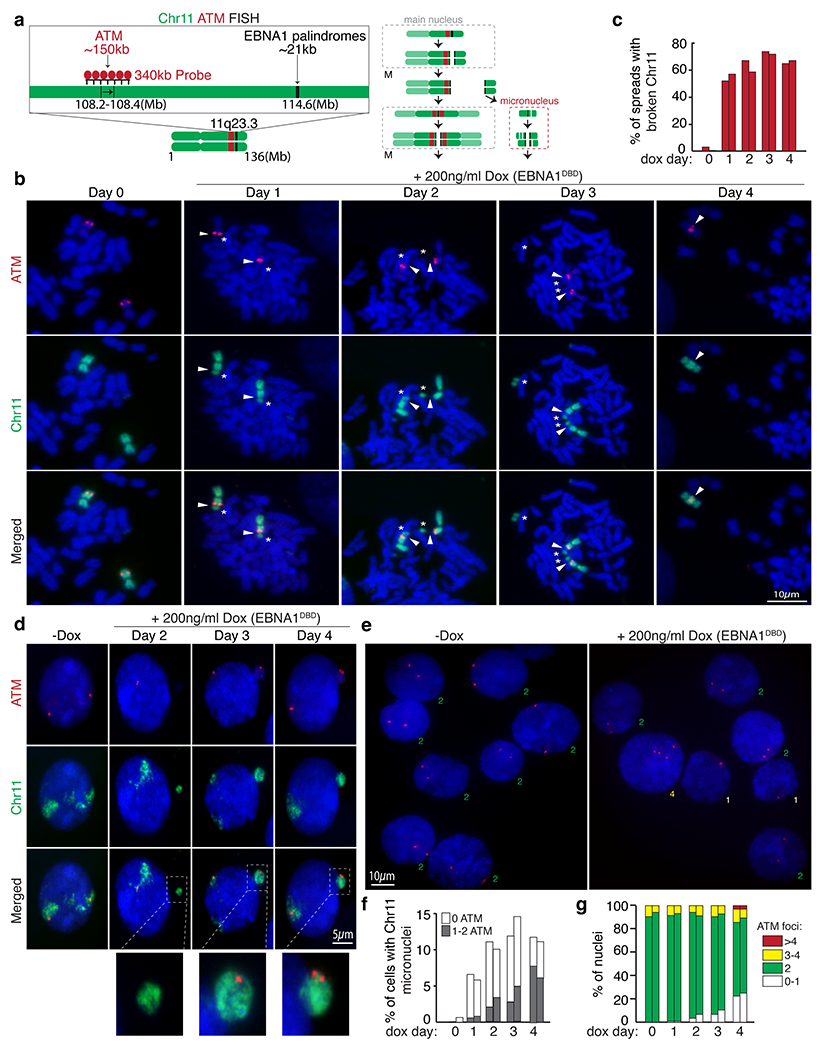
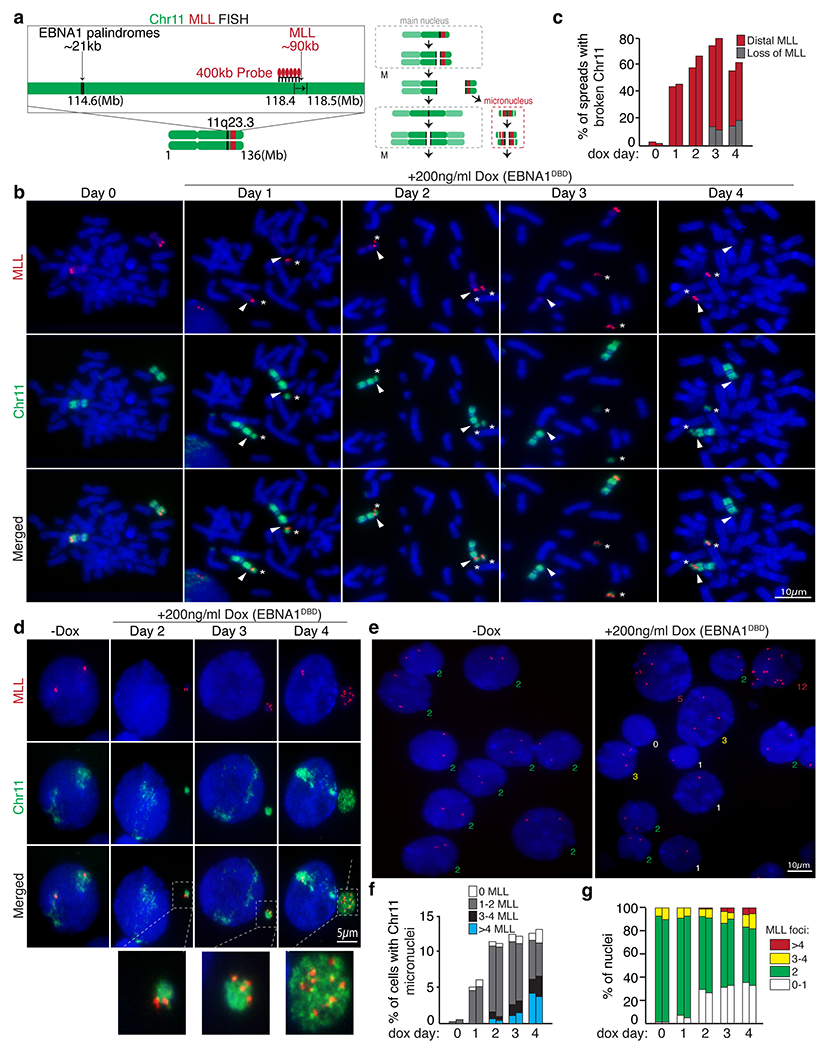
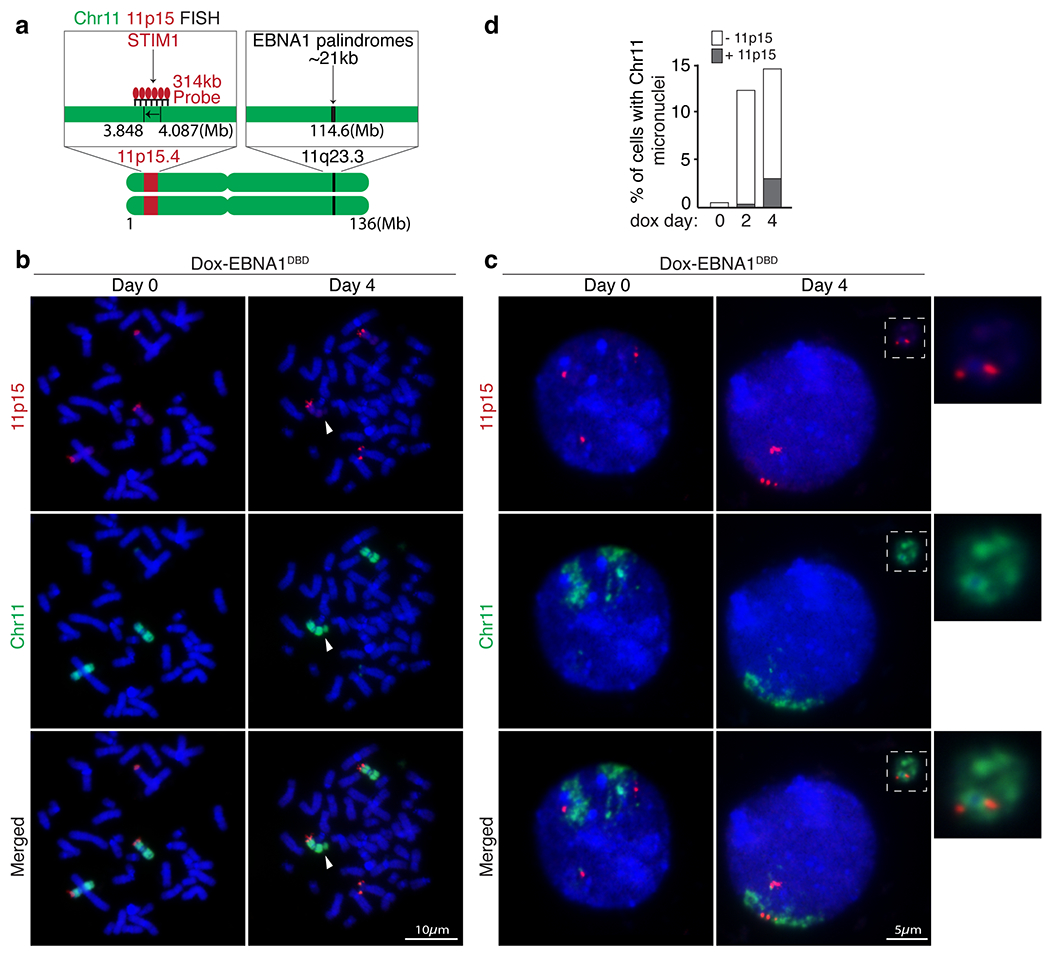
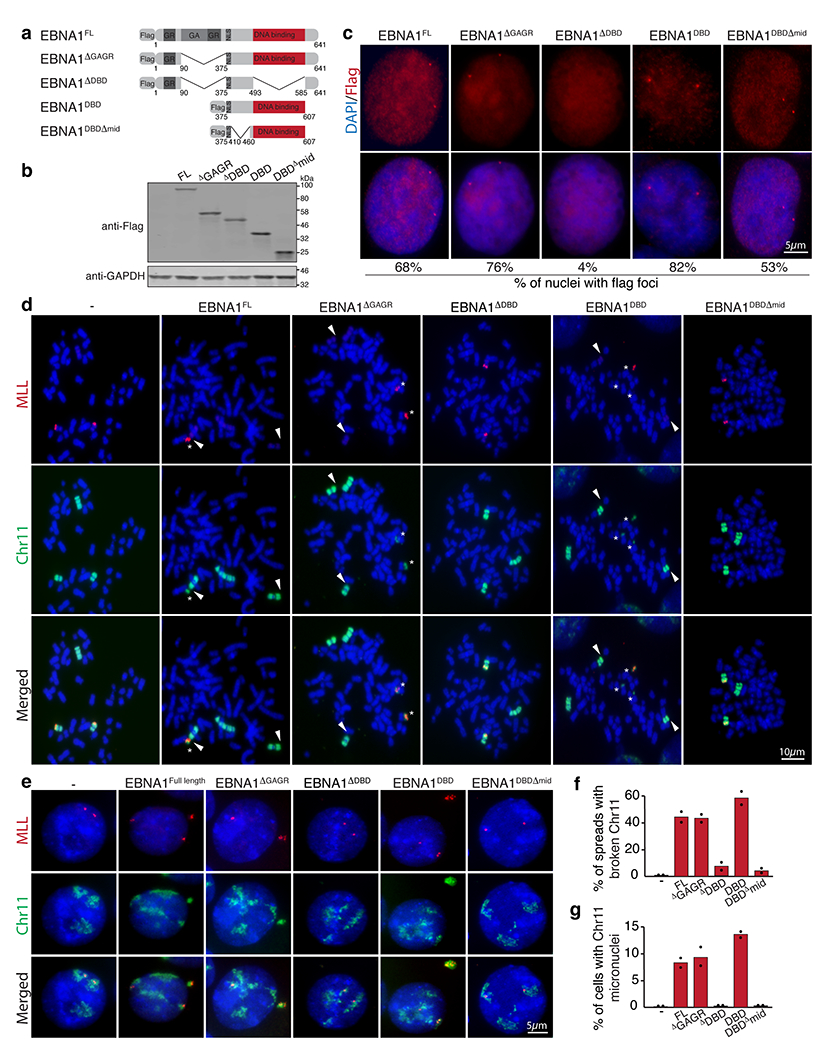
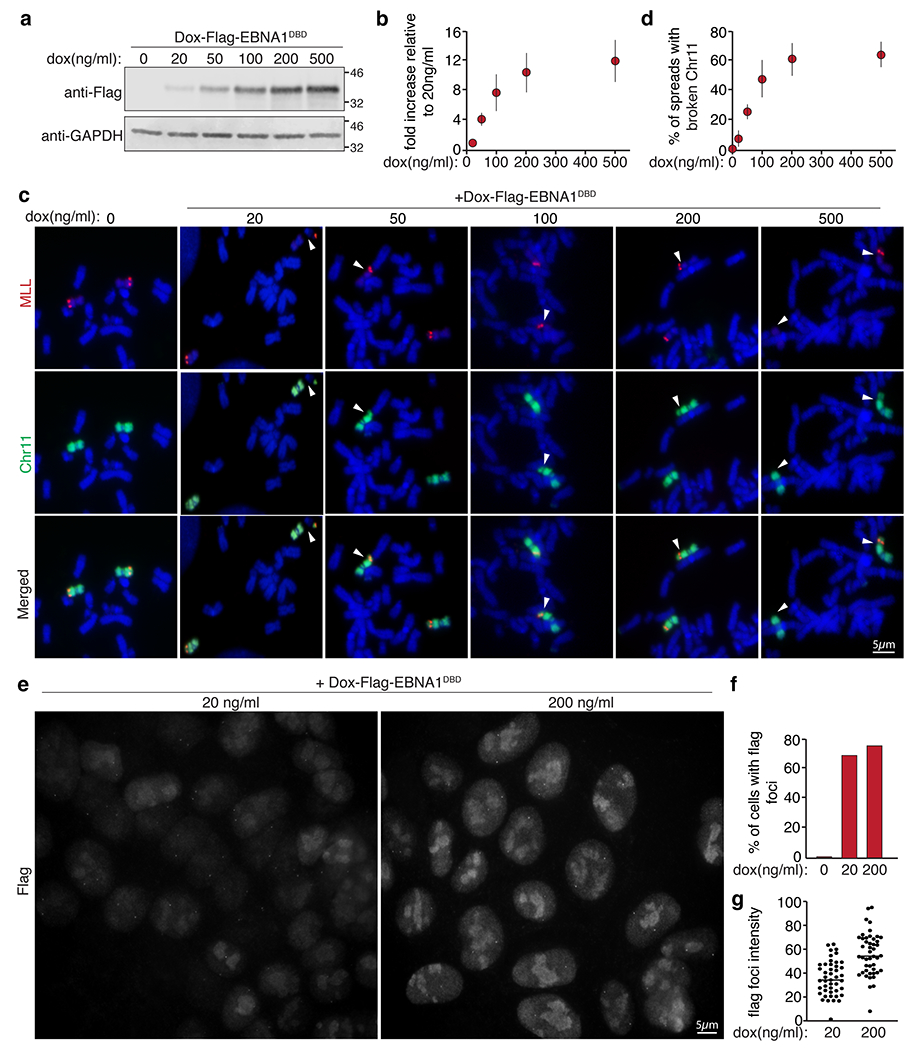
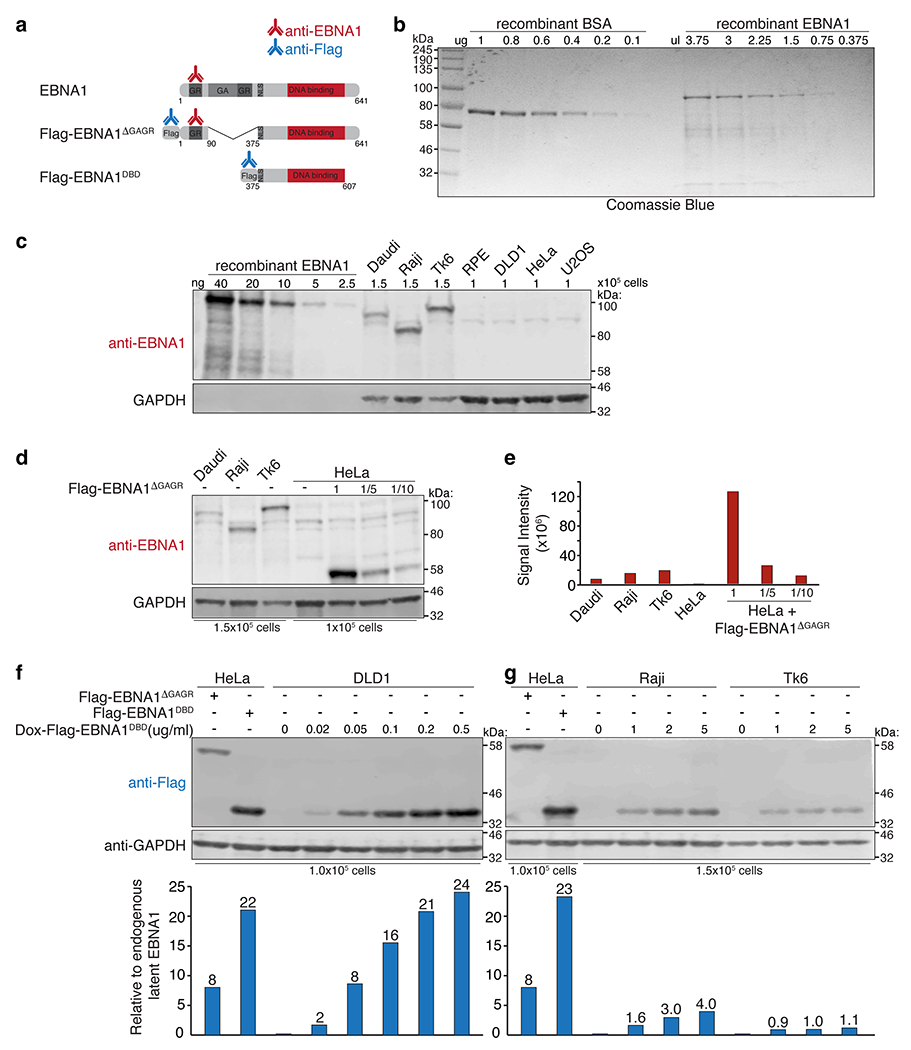
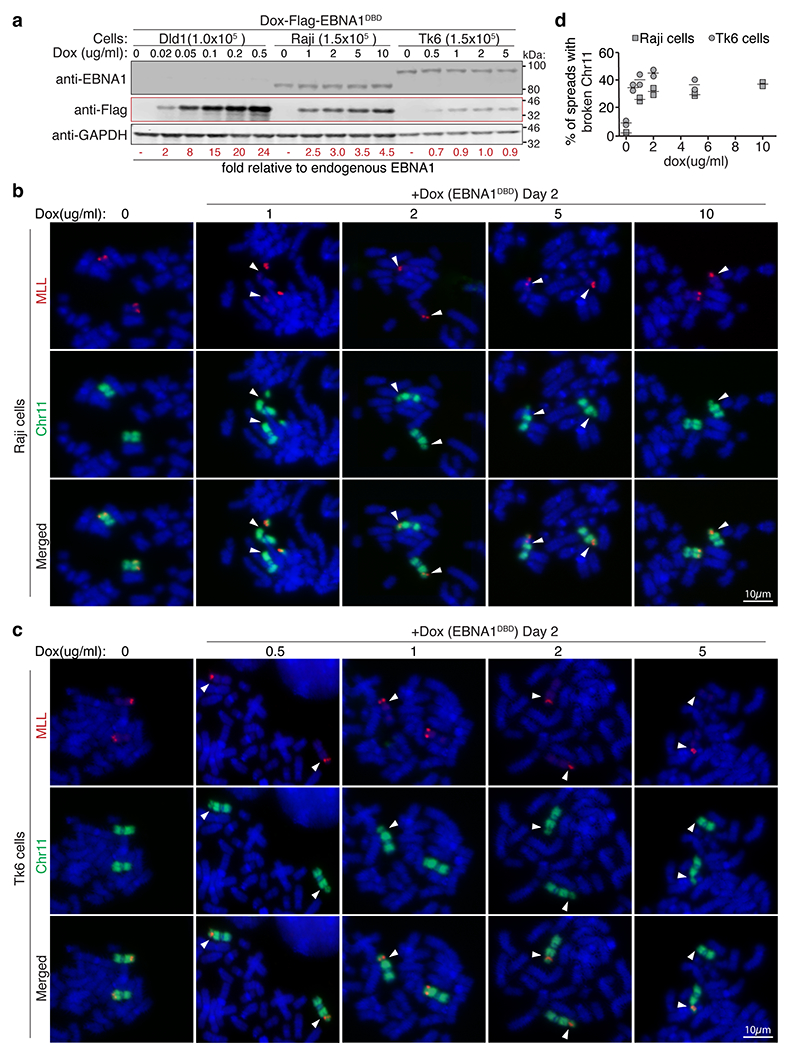
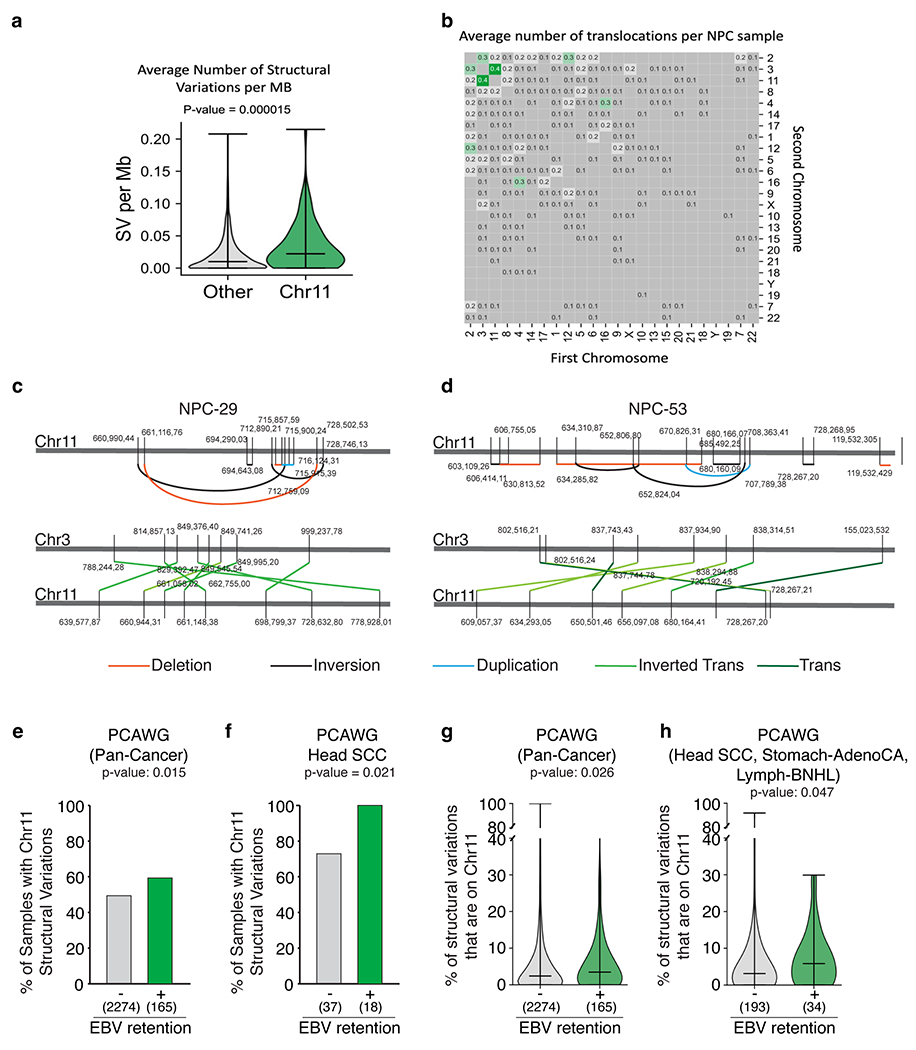
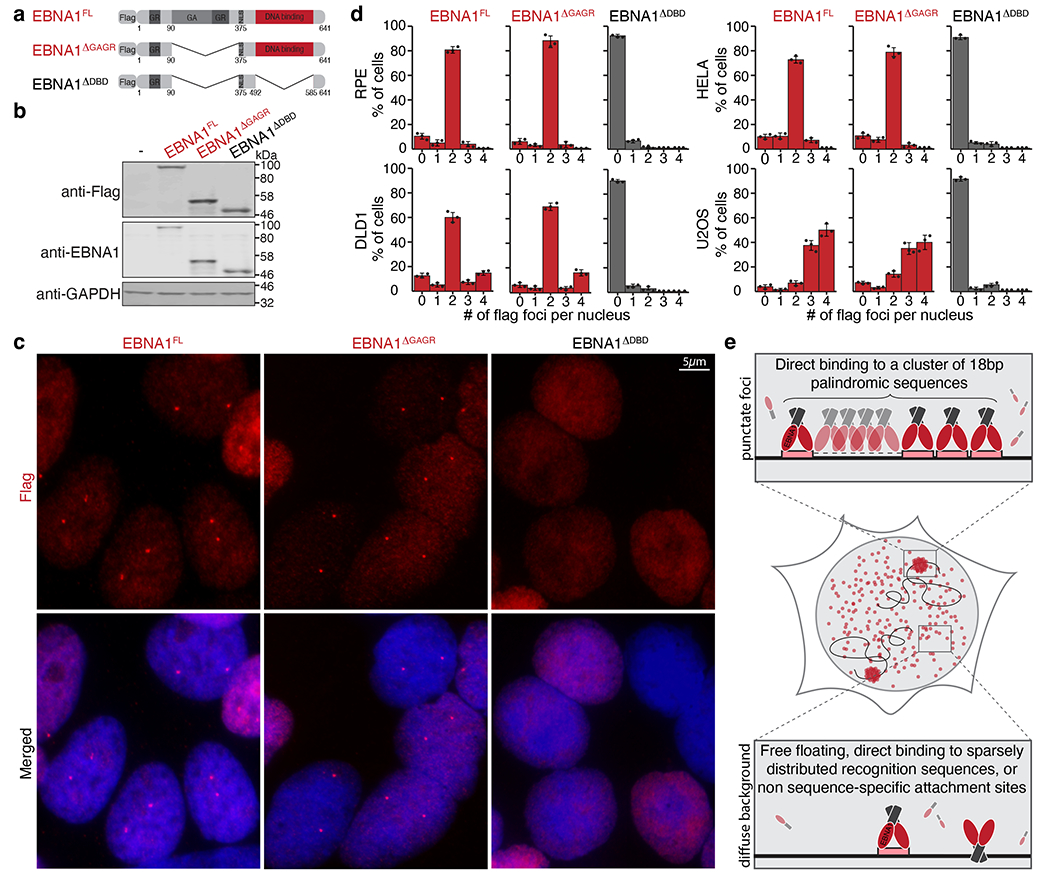
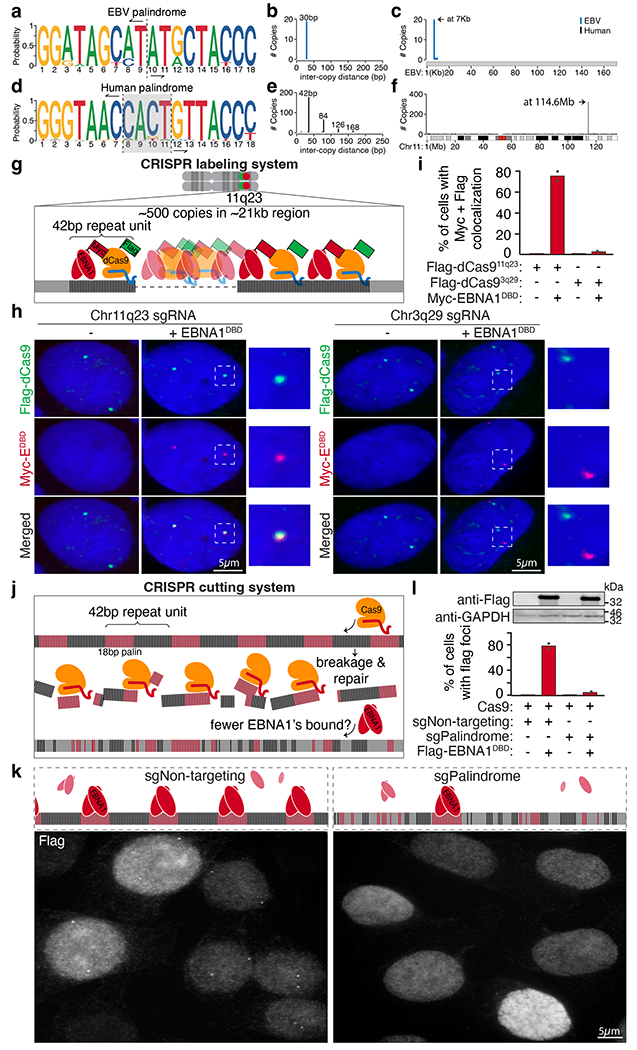
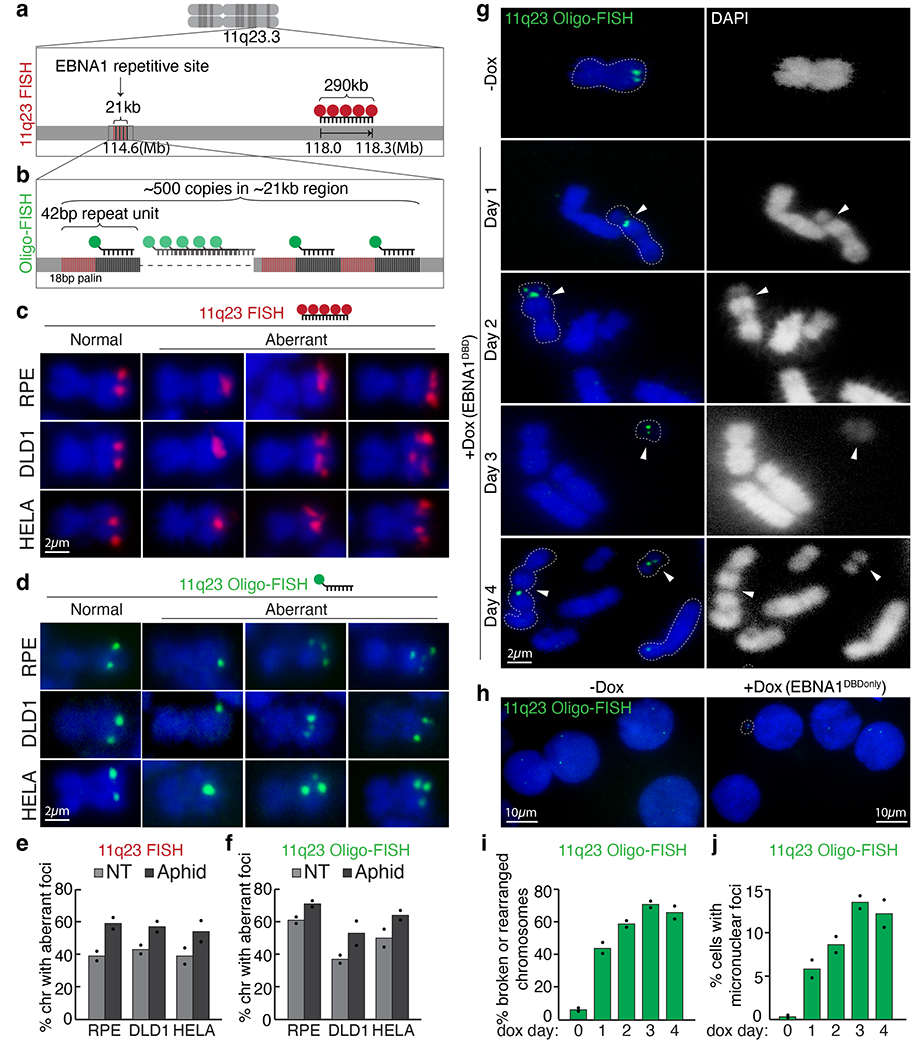
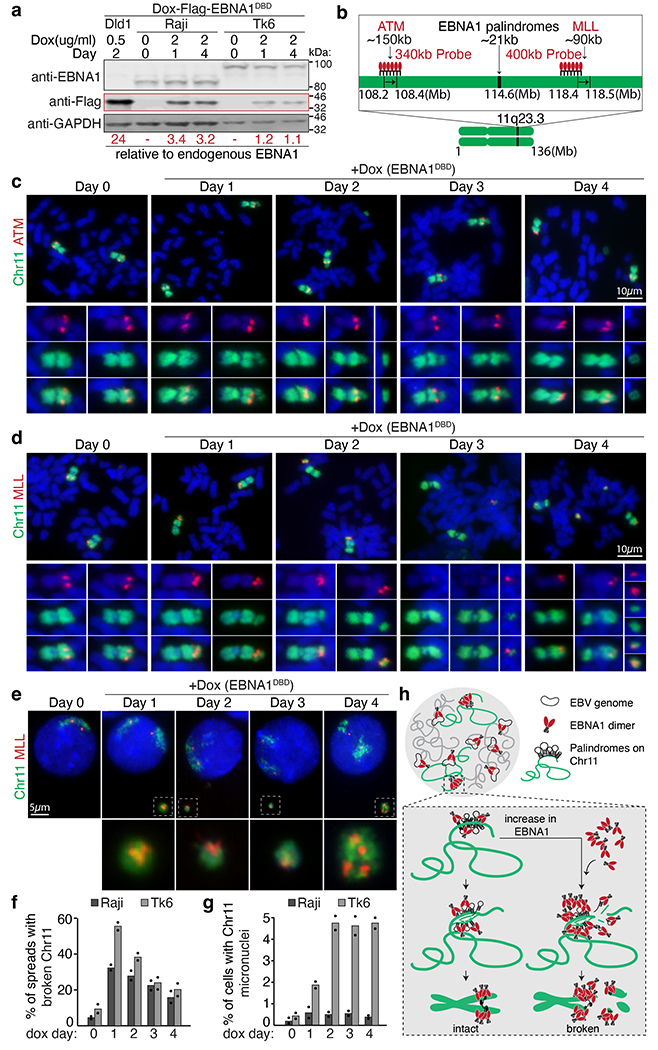
Epstein-Barr virus (EBV) is an oncogenic herpesvirus associated with several cancers of lymphocytic and epithelial origin1-3. EBV encodes EBNA1, which binds to a cluster of 20 copies of an 18-base-pair palindromic sequence in the EBV genome4-6. EBNA1 also associates with host chromosomes at non-sequence-specific sites7, thereby enabling viral persistence. Here we show that the sequence-specific DNA-binding domain of EBNA1 binds to a cluster of tandemly repeated copies of an EBV-like, 18-base-pair imperfect palindromic sequence encompassing a region of about 21 kilobases at human chromosome 11q23. In situ visualization of the repetitive EBNA1-binding site reveals aberrant structures on mitotic chromosomes characteristic of inherently fragile DNA. We demonstrate that increasing levels of EBNA1 binding trigger dose-dependent breakage at 11q23, producing a fusogenic centromere-containing fragment and an acentric distal fragment, with both mis-segregated into micronuclei in the next cell cycles. In cells latently infected with EBV, elevating EBNA1 abundance by as little as twofold was sufficient to trigger breakage at 11q23. Examination of whole-genome sequencing of EBV-associated nasopharyngeal carcinomas revealed that structural variants are highly enriched on chromosome 11. Presence of EBV is also shown to be associated with an enrichment of chromosome 11 rearrangements across 2,439 tumours from 38 cancer types. Our results identify a previously unappreciated link between EBV and genomic instability, wherein EBNA1-induced breakage at 11q23 triggers acquisition of structural variations in chromosome 11.


Figures

Extended Data Figure 1.
Extended Data Figure 1.. EBNA1 localization is enriched at a single genomic locus in the endogenous human genome.
(a) Schematic representation of the Flag-tagged allele of full length EBNA1. (b) anti-EBNA1 (Santa Cruz sc-81581) immunoblot of the indicated cell lines. Immunoblots were repeated 3 times with similar results. (c) Representative anti-Flag immunofluorescence images of Flag-EBNA1FL foci in the indicated cell lines as quantified in Figure 1d from three independent experiments. TK6 cells are established from B-lymphocytes immortalized with EBV. Raji cells and Daudi cells are derived from EBV-infected Burkitt’s Lymphoma. RPEs are hTERT-immortalized primary retinal pigment epithelial cells. DLD1s are derived from colon cancer. HeLas are derived from cervical cancer. U2OS cells are derived from osteosarcoma. MEFs are mouse embryonic fibroblasts. (d) Schematic representation of sequence-specific enrichment of dCas9 (yellow) in complex with a single sgRNA (blue) targeting a sequence (grey) clustered at a repetitive site.
Extended Data Figure 2.
Extended Data Figure 2.. The human genome contains a cluster of EBV-like 18bp imperfect palindromic sequences at 11q23.
Number of copies (y-axis) of 18bp imperfect palindromic sequences with up to 6 variant and 2 asymmetric nucleotides as plotted per 0.1 mega-base region across the human reference genome GRCh38 (a) and number of copies of 18bp imperfect palindromic sequences with up to 5 variant and 2 asymmetric nucleotides as plotted per 10 kilo-base region at 11q23 region for long-read sequenced genomes of two individuals of Ashkenazi descent (b) and two individuals of Chinese descent (c).
Extended Data Figure 3.
Extended Data Figure 3.. 11q23 repetitive site containing 18bp imperfect palindromes is evolutionarily conserved amongst the Great Apes.
(a) Pairwise sequence alignment of the 11q23 repetitive site (chr11:114,604,212-114,625,620) in the human genome against 30 mammalian genomes. Vertical lines with darker grayscale color represent higher alignment quality, whereas a horizontal single or double line represents a lack of sequence homology between the human and the aligned genome. (b) Comparison of the consensus motif logos of the repeat sequence from the human, chimpanzee, or EBV genome showing that while the 18bp palindromes are conserved amongst all three species, the interspersed sequences are distinct between the primates and EBV.
Extended Data Figure 4.
Extended Data Figure 4.. CRISPR labeling and CRISPR cutting approaches demonstrating localization of EBNA1 at the cluster of 18bp imperfect palindromic sequences at 11q23.
(a) Schematic of the consensus sequence of the 42bp repeat unit showing the sgRNA sequence (sgPalindrome) used in the CRISPR labeling approach. (b) Schematic of the consensus sequence of the 42bp repeat unit showing the sgRNA sequences (sgNon-Targeting and sgPalindrome) used in the CRISPR cutting approach. (c) Representative anti-Flag (in green) and anti-Myc (in red) IF of U2OS cells stably expressing Flag-dCas9 directed by the indicated sgRNAs with or without colocalization with Myc-EBNA1DBD as quantified in (d). (e) Representative anti-Flag IF of Flag-EBNA1DBD in U2OS cells treated with Cas9 and the indicated sgRNAs as quantified in (f).
Extended Data Figure 5.
Extended Data Figure 5.. Repetitive DNA at 3q29 forms aberrant structures on mitotic chromosomes.
(a) Schematic representation of the oligo-FISH approach using a fluorescently labeled oligo (in green) to target a portion of the repeat sequence clustered at 3q29. (b) Representative oligo-FISH (c) Zoomed-in representative oligo-FISH showing normal appearance (two dots) or fragile appearance (single dot, multiple dots) on mitotic chromosomes in the indicated cell lines as quantified in (d) with or without 0.2uM aphidicolin treatment for 24 hours.
Extended Data Figure 6.
Extended Data Figure 6.. Dox-inducible expression of EBNA1DBD in DLD1 cells.
(a) Schematic of the dox-inducible Flag-EBNA1DBD allele encoding the indicated amino acid residues of EBNA1 stably integrated in DLD1 cells. (b) Anti-Flag and anti-GADPDH western blots showing expression of Flag-EBNA1DBD induced with 200ng/ml doxycycline at the indicated days post induction. (c) Representative anti-Flag immunofluorescence images showing nuclear foci on day 1 and appearance of micronuclear foci on Day 4 as quantified in (d-e). A total of 830 cells were quantified. Data are presented as bars representing mean values from two independent experiments.
Extended Data Figure 7.
Extended Data Figure 7.. Live imaging of the inheritance of EBNA1 foci through cell division.
(a) Schematic of the clover-tagged allele of EBNA1 used for live-imaging at 10min intervals for 48 hours starting at day 3 following transduced expression in Dld1s or HeLas. Still images capturing either symmetric inheritance (b) or asymmetric inheritance of EBNA1 foci into primary nuclei (c-d) or micronuclei (e) of daughter cells as quantified in (f). 64 mitotic events were scored for DLD1 cells, 24 mitotic events for HeLa cells.
Extended Data Figure 8.
Extended Data Figure 8.. EBNA1-induced breakage of chromosome 11 produces an ATM-containing proximal fragment that undergoes micronucleation.
(a) Schematic of dual-colored FISH using whole chromosome 11 probe (green) and probe against ATM (red). (b) Representative FISH images of DLD1 cells showing intact chromosome 11’s (Day 0) and broken chromosome 11 fragments containing ATM proximal to the site of breakage at day 1 to 4 post dox induction. (c) Data represent the percentage of spreads with broken chromosome 11 from two independent experiments. 62 mitotic spreads were quantified on Day 0, 53 on Day 1, 48 on Day2, 58 on Day 3, and 61 on Day 4. (d) Representative FISH images showing micronucleation of chromosome 11 fragments with or without ATM foci. (f) Stacked bars represent the percentage of cells with chromosome 11 micronuclei with the indicated number of ATM foci from two independent experiments. 310 cells were quantified on Day 0, 220 cells on Day 1, 190 on Day 2, 214 on Day 3, and 198 on Day 4. (e) Representative FISH images showing ATM foci in primary nuclei. (g) Stacked bars represent the percentage of primary nuclei with the indicated number of ATM foci from two independent experiments. 800 cells were quantified on Day 0, 900 cells on Day 1, 750 on Day 2, 950 on Day 3, and 780 on Day 4.
Extended Data Figure 9.
Extended Data Figure 9.. EBNA1-induced breakage of chromosome 11 produces an MLL-containing distal fragment that undergoes micronucleation
(a) Schematic of dual-colored FISH using whole chromosome 11 probe (green) and probe against MLL (red). (b) Representative FISH images of DLD1 cells showing intact chromosome 11’s (Day 0) and broken chromosome 11 fragments containing MLL distal to the site of breakage at day 1 to 4 post dox induction. (c) Data represent the percentage of spreads with broken chromosome 11 from two independent experiments. 71 mitotic spreads were quantified on Day 0, 49 on Day 1, 50 on Day2, 53 on Day 3, and 71 on Day 4. (d) Representative FISH images showing micronucleation of chromosome 11 fragments with or without MLL foci. (f) Stacked bars represent the percentage of cells with chromosome 11 micronuclei with the indicated number of MLL foci from two independent experiments. 400 cells were quantified on Day 0, 210 cells on Day 1, 235 on Day 2, 190 on Day 3, and 180 on Day 4. (e) Representative FISH images showing MLL foci in primary nuclei. (g) Stacked bars represent the percentage of primary nuclei with the indicated number of MLL foci. 950 cells were quantified on Day 0, 880 cells on Day 1, 980 on Day 2, 1100 on Day 3, and 950 on Day 4.
Extended Data Figure 10.
Extended Data Figure 10.. EBNA1-induced micronucleation of chromosome 11 includes the p-arm.
(a) Schematic of dual-colored FISH using whole chromosome 11 probe (green) and probe against 11p15 (red) on the p-arm. (b) Representative FISH images of DLD1 cells showing 11p15 on the p-arm of either intact chromosome 11’s (Day 0) or broken chromosome 11 fragments (Day 4) upon induced expression of EBNA1. (c) Representative FISH images showing that EBNA1-induced micronucleation of chromosome 11 (Day 4) includes 11p15 on the p-arm. (d) Stacked bars represent the percentage of cells with chromosome 11 micronuclei with or without 11p15. 400 cells were quantified on Day 0, 310 cells on Day 2 and 380 cells on Day 4.
Extended Data Figure 11.
Extended Data Figure 11.. EBNA1-induced breakage at 11q23 is dependent on the DNA binding domain.
(a) Schematic of the Flag-tagged alleles of EBNA1 expressed in HeLa cell that harbor two copies of chromosome 11 and a derivative chromosome 11 lacking 11q23. (b) anti-Flag immunoblot of cells expressing the indicated alleles. (c) Anti-Flag immunofluorescence showing localization of the indicated EBNA1 alleles. Numbers indicate the percentage of nuclei with flag foci. (d) Representative dual colored FISH showing chromosome 11’s in HeLa cells, including two copies of chromosome 11 (in green) harboring MLL (in red) and one derivative chromosome 11 lacking MLL. White arrows indicate the site of breakage proximal to MLL as quantified in (f). 48 mitotic spreads were quantified for non-transduced HeLas, 65 for HeLas expressing EBNA1FL, 98 for HeLas expressing EBNA1ΔGAGR, 40 for HeLas expressing EBNA1ΔDBD, 69 for HeLas expressing EBNA1DBD, and 82 for HeLas expressing EBNA1DBDΔmid. Data are presented as bars representing mean values from two independent experiments. (e) Representative FISH images of interphase nuclei showing micronucleation of chromosome 11 fragments containing MLL as quantified in (g). 210 cells were quantified for non-transduced HeLas, 150 for HeLas expressing EBNA1FL, 195 for HeLas expressing EBNA1ΔGAGR, 170 for HeLas expressing EBNA1ΔDBD, 230 for HeLas expressing EBNA1DBD, and 210 for HeLas expressing EBNA1DBDΔmid. Data are presented as bars representing mean values from two independent experiments.
Extended Data Figure 12.
Extended Data Figure 12.. EBNA1 abundance has a dose-dependent effect on the frequency of breakage at 11q23 in DLD1 cells.
(a) anti-Flag immunoblot of dox-induced Flag-EBNA1DBD expression levels at the indicated doxycycline concentrations as quantified in (b). Data are presented as mean values +/− SEM from three independent experiments. (c) Dual colored FISH of mitotic chromosome 11 (in green) and MLL (in red) showing breakage proximal to MLL at day two following induction with the indicated doxycycline concentrations as quantified in (d). A total of 786 mitotic spreads were counted. Data are presented as mean values +/− SEM from three independent experiments. (e) Representative anti-Flag immunofluorescence images of Flag-EBNA1DBD expression at 20ng/ml or 200ng/ml. (f) Percentage of cells with flag foci. (g) Intensity of flag foci of 90 signals are quantified with horizontal bars representing the mean values.
Extended Data Figure 13.
Extended Data Figure 13.. Cell lines latently infected with EBV express EBNA1 levels slightly below the levels required to induce 11q23 breakage.
(a) Schematic of the antibodies used to quantify EBNA1. (b) Coomassie blue staining of recombinant BSA next to recombinant EBNA1 (Abcam 138345). (c) anti-EBNA1 (Santa Cruz sc-81581) immunoblot of recombinant EBNA1 next to whole cell lysates of the indicated cell lines. Anti-GAPDH immunoblot shows variation amongst the EBV-infected cell lines when loading the same number of cells. (d) anti-EBNA1 immunoblot of EBNA1 in the indicated EBV-infected cell lines next to HeLa cells expressing Flag-EBNA1ΔGAGR loaded at the indicated dilutions. (e) Bar graph represents signal intensity values normalized to number of cells loaded showing that the 1x Flag-EBNA1ΔGAGR in HeLa cells is expressed at 14-fold relative to baseline EBNA1 in Daudi cells and 8-fold in Raji cells and Tk6 cells. Immunoblots were repeated 3 times where S.D. values were below +/− 10%. (f-g) Anti-Flag immunoblot of HeLa cells, DLD1 cells, Raji cells, and Tk6 cells expressing the indicated Flag-tagged EBNA1 alleles. Bar graph represents fold relative to latent EBNA1 in Raji or Tk6 cells, calculated using the Flag-EBNA1ΔGAGR allele as 8-fold. Immunoblots were each repeated 3 times, S.D. values were below +/− 10%.
Extended Data Figure 14.
Extended Data Figure 14.. Elevated levels of EBNA1 trigger breakage at 11q23 in cells latently infected with EBV.
(a) anti-EBNA1 immunoblot verifies the presence of latent EBV genomes in Raji and Tk6 cells where baseline endogenous EBNA1 levels are largely unaffected by induced expression of Flag-EBNA1DBD. Anti-Flag immunoblot shows doxycycline-inducible expression of Flag-EBNA1DBD. Numbers (in red) indicate fold relative to baseline endogenous EBNA1 levels, calculated using Flag-EBNA1DBD levels in DLD1 cells previously determined to be 2, 8, 15, 20, and 24-fold. Immunoblots were repeated 3 times, S.D. Values were below +/− 10%. Representative dual-colored FISH images of chromosome 11 (in green) and MLL (in red) showing 11q23 breakage proximal to MLL (indicated by the white arrows) in either (b) Raji cells or Tk6 cells (c) as quantified in (d) following two days of treatment with the indicated dox concentrations. A total of 228 mitotic spreads were quantified for Raji cells. A total of 284 spreads were quantified for Tk6 cells. Data are presented as horizontal bars representing means from two independent experiments.
Extended Data Figure 15.
Extended Data Figure 15.. Prevalence of chromosome 11 structural variations across EBV-infected Nasopharyngeal Carcinoma (NPC) and Pan-Cancer Analysis of Whole Genomes (PCAWG).
Average number of structural variations (SV) per Mb (a) and translocations (b) of n=78 EBV-infected NPC genomes. Bars represent the minimum, median and the maximum values observed in each violin plot (Two-sided Mann-Whitney U rank test, P-value is indicated, not corrected for multiple hypothesis testing). (c-d) Schematic of clustered structural variations (deletions, inversions, duplications, inverted translocations) on chromosome 11 in NPC genomes. (e-f) Proportion of samples with or without detectable EBV that harbor at least two chromosome 11 structural variations (Two-sided Fisher’s exact test, p-value is indicated, not corrected for multiple hypothesis testing; corrected p-values are 0.08 for pan-cancer and 0.05 for Head-SCC). (g-h) Proportion of structural variations (SV) that are on chromosome 11 in samples with or without detectable EBV. Bars represent the minimum, median and the maximum values observed in each violin plot (Two-sided Mann-Whitney U rank test. P-value is indicated, not corrected for multiple hypothesis testing).
Fig. 1 |
Fig. 1 |. Sequence-specific DNA-binding domain mediates enrichment of EBNA1 at a single genomic locus in the endogenous human genome.
a, Schematic representation of the Flag-tagged alleles of EBNA1. GR, glycine– arginine-rich region; GA, glycine–alanine repeat region; NLS, nuclear localization signal. b, Representative immunoblots of cells expressing the indicated Flag-tagged alleles of EBNA1. For gel source data, see Supplementary Fig. 1. c, Representative anti-Flag (red) immunofluorescence micrographs showing localization of the alleles in DLD1 cells. Scale bar, 5 μm. d, Quantification of localization of the alleles of EBNA1 in the indicated cell lines either at day 1 following transient expression in RPE, HeLa and U2OS cells, or at day 2 following stable transduction in DLD1 cells. A total of 908 RPE cells, 902 DLD1 cells, 901 HeLa cells and 893 U2OS cells were counted. Data are presented as mean values Å} s.e.m. from three independent experiments. e, Schematic representation of the hypothesis that EBNA1 foci formation is mediated by sequence-specific enrichment through the DNA-binding domain (red) at a recognition sequence (pink) clustered at a repetitive site in the human genome.
Fig. 2 |
Fig. 2 |. A cluster of regularly interspersed copies of an 18-bp imperfect palindromic sequence at 11q23 mediates sequence-specific enrichment of EBNA1.
a–c, Consensus motif logo (a), inter-copy distance (b) and position (c) of 18-bp palindromic repeats in the EBV genome. d–f, Consensus motif logo (d), inter-copy distance (e) and position (f) of 18-bp imperfect palindromic repeats with up to 6 variant and 2 asymmetric nucleotides on human chromosome 11. Vertical dashed lines in the consensus motif logos represent the point of symmetry of the palindromes. The grey shaded area highlights the 4-bp non-palindromic core of the human palindrome. g, Schematic representation of the CRISPR labelling system. h, Representative anti-Flag (green) and anti-MYC (red) immunofluorescence micrographs showing localization of Flag–dCas9 directed by the indicated sgRNAs labelling either 11q23 or 3q29 with and without expression of MYC–EBNA1(DBD). Scale bars, 5 μm. i, Quantification of staining in h. A total of 95 cells were counted for Flag–dCas9 labelling 11q23. A total of 110 cells were counted for Flag–dCas9 labelling 3q29. Data are presented as bars representing mean values from two independent experiments. j, Schematic representation of the CRISPR cutting system. k, Representative anti-Flag immunofluorescence micrographs showing localization of Flag–EBNA1(DBD) in cells treated with either non-targeting sgRNA (sgNon-targeting) or palindrome-targeting sgRNA (sgPalindrome). Scale bar, 5 μm. For gel source data, see Supplementary Fig. 1. l, Quantification of staining in k. A total of 410 cells were counted for Cas9-mediated cutting with non-targeting sgRNA. A total of 630 cells were counted for Cas9-mediated cutting with palindrome-targeting sgRNA. Data are presented as bars representing mean values from two independent experiments.
Fig. 3 |
Fig. 3 |. Repetitive DNA containing the 18-bp imperfect palindromes forms aberrant structures characteristic of fragile DNA and undergoes breakage and micronucleation after induced EBNA1 expression.
a, Schematic representation of 11q23 FISH using a fluorescently labelled BAC probe (in red) that hybridizes to the indicated genomic locus. b, Schematic representation of oligo-FISH using a fluorescently labelled oligonucleotide (in green) that hybridizes to the sequence adjacent to the 18-bp palindrome as part of the 42-bp repeat unit. c,d, Representative 11q23 FISH (c) and oligo-FISH (d) images showing normal or aberrant foci on mitotic chromosomes in the indicated cell lines with or without 24 h of 0.2 μM aphidicolin. Scale bars, 2 μm. e,f, Quantification of staining in c,d, respectively. For 11q23 FISH with BAC probe, a total of 255 chromosomes were counted for RPE, 236 for DLD1 and 256 for HeLa cells. For 11q23 oligo-FISH, a total of 235 chromosomes were counted for RPE, 202 for DLD1 and 196 for HeLa cells. Data are presented as bars representing mean values from two independent experiments. NT, non treated. g, Representative 11q23 oligo-FISH images of mitotic chromosomes with and without Dox-inducible expression of EBNA1(DBD). Arrowheads indicate oligo-FISH signals that localized at either a gap on centric chromosomes or on small acentric fragments. Dashed lines outline the oligo-FISH-containing chromosomes. DAPI staining is shown as either merged in blue or separately in white. Scale bar, 2 μm. h, Quantification of 11q23 oligo-FISH staining in g. A total of 101 chromosomes were counted on day 0, 98 on day 1, 80 on day 2, 90 on day 3, and 83 on day 4. Data are presented as bars representing mean values from two independent experiments. i, Representative 11q23 oligo-FISH of interphase nuclei with and without Dox-inducible expression of EBNA1(DBD). Scale bars, 10 μm. j, Quantification of staining in i. A total of 800 interphase cells were counted on day 0, 276 on day 1, 253 on day 2, 241 on day 3, and 260 on day 4. Data are presented as bars representing mean values from two independent experiments.
Fig. 4 |
Fig. 4 |. Elevated abundance of EBNA1 triggers 11q23 breakage and micronucleation in cells latently infected with EBV.
a, Representative immunoblots of Raji cells and TK6 cells expressing Flag–EBNA1(DBD) at day 0, 1 and 4. Numbers under the blots indicate levels of Dox-induced Flag-EBNA1(DBD) relative to endogenous EBNA1, calculated using Dox-induced Flag–EBNA1(DBD) in DLD1 cells previously determined to be 24-fold (Extended Data Fig. 13). A total of 1.5 Å~ 105 Raji or TK6 cells and 1.0 Å~ 105 DLD1 cells were loaded in each lane. Immunoblot was carried out three times, with standard deviations below 10%. For gel source data, see Supplementary Fig. 1. b, Schematic of dualcoloured FISH using a BAC probe against whole chromosome 11 (green) and a BAC probe (in red) against either ATM or MLL. c,d, Representative FISH images showing breakage of chromosome 11 distal to ATM (c) or proximal to MLL (d). Scale bars, 10 μm. e, Representative FISH images showing micronucleation of MLL-containing chromosome 11 fragments. Scale bar, 5 μm. f, Quantification of the frequency of 11q23 breakage. For Raji cells, 105 mitotic spreads were counted on day 0, 122 on day 1, 107 on day 2, 98 on day 3, and 98 on day 4. For TK6 cells, 109 mitotic spreads were counted on day 0, 90 on day 1, 162 on day 2, 81 on day 3, and 67 on day 4. Data are presented as bars representing mean values from two independent experiments. g, Quantification of the frequency of micronucleation. For Raji cells, 700 cells were counted on day 0, 801 on day 1, 905 on day 2, 510 on day 3, and 810 on day 4. For TK6 cells, 1,840 cells were counted on day 0, 646 on day 1, 676 on day 2, 738 on day 3, and 632 on day 4. Data are presented as bars representing mean values from two independent experiments. h, Schematic of the proposed role of EBNA1.

Comment in

References

    1. Pope JH, Horne MK & Scott W Transformation of foetal human keukocytes in vitro by filtrates of a human leukaemic cell line containing herpes-like virus. Int. J. Cancer 3, 857–866 (1968). - PubMed
    1. Hsu JL & Glaser SL Epstein-barr virus-associated malignancies: epidemiologic patterns and etiologic implications. Crit. Rev. Oncol. Hematol 34, 27–53 (2000). - PubMed
    1. Thorley-Lawson DA & Gross A Persistence of the Epstein-Barr virus and the origins of associated lymphomas. N. Engl. J. Med 350, 1328–1337 (2004). - PubMed
    1. Rawlins DR, Milman G, Hayward SD & Hayward GS Sequence-specific DNA binding of the Epstein-Barr virus nuclear antigen (EBNA-1) to clustered sites in the plasmid maintenance region. Cell 42, 859–868 (1985). - PubMed
    1. Bochkarev A, et al. Crystal structure of the DNA-binding domain of the Epstein-Barr virus origin-binding protein EBNA 1. Cell 83, 39–46 (1995). - PubMed

Publication types