. 2023 Apr;616(7957):543-552.
doi: 10.1038/s41586-023-05706-4. Epub 2023 Apr 12.

Genomic-transcriptomic evolution in lung cancer and metastasis

Collaborators, Affiliations

Genomic-transcriptomic evolution in lung cancer and metastasis

Carlos Martínez-Ruiz et al. Nature. 2023 Apr.

Abstract

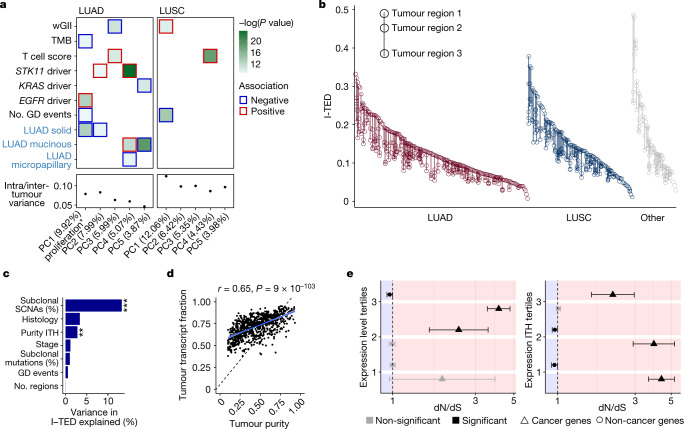
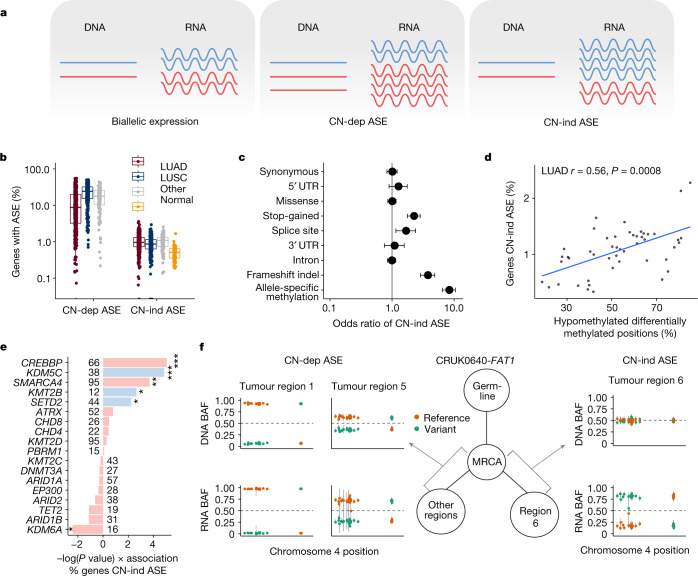
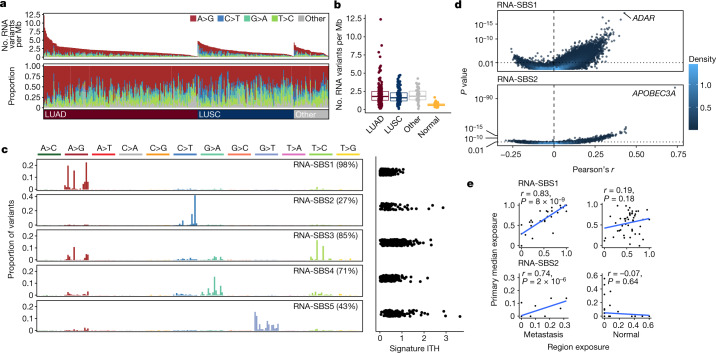
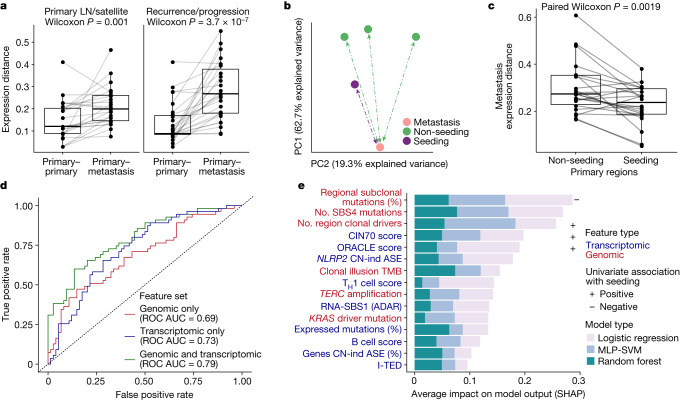
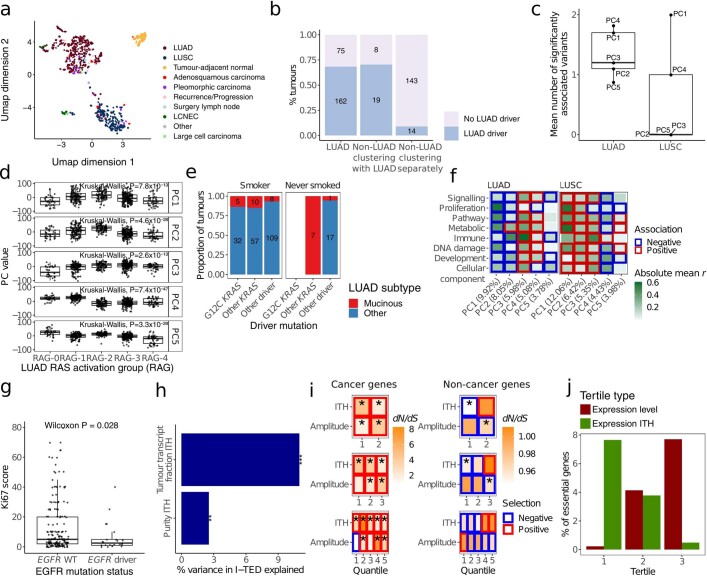
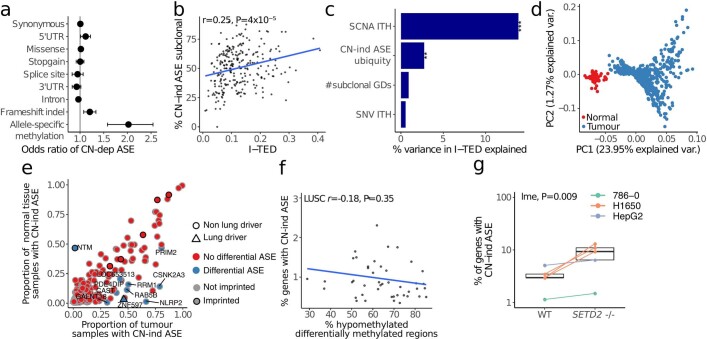
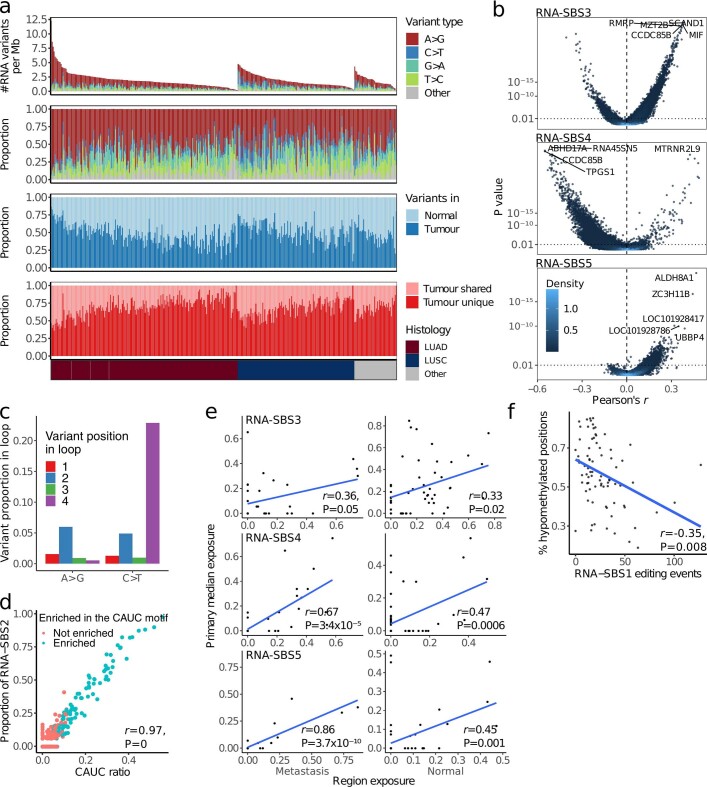
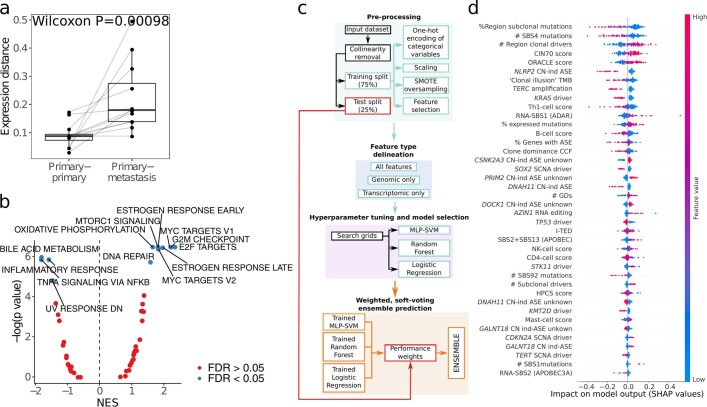
Intratumour heterogeneity (ITH) fuels lung cancer evolution, which leads to immune evasion and resistance to therapy1. Here, using paired whole-exome and RNA sequencing data, we investigate intratumour transcriptomic diversity in 354 non-small cell lung cancer tumours from 347 out of the first 421 patients prospectively recruited into the TRACERx study2,3. Analyses of 947 tumour regions, representing both primary and metastatic disease, alongside 96 tumour-adjacent normal tissue samples implicate the transcriptome as a major source of phenotypic variation. Gene expression levels and ITH relate to patterns of positive and negative selection during tumour evolution. We observe frequent copy number-independent allele-specific expression that is linked to epigenomic dysfunction. Allele-specific expression can also result in genomic-transcriptomic parallel evolution, which converges on cancer gene disruption. We extract signatures of RNA single-base substitutions and link their aetiology to the activity of the RNA-editing enzymes ADAR and APOBEC3A, thereby revealing otherwise undetected ongoing APOBEC activity in tumours. Characterizing the transcriptomes of primary-metastatic tumour pairs, we combine multiple machine-learning approaches that leverage genomic and transcriptomic variables to link metastasis-seeding potential to the evolutionary context of mutations and increased proliferation within primary tumour regions. These results highlight the interplay between the genome and transcriptome in influencing ITH, lung cancer evolution and metastasis.

Trial registration: ClinicalTrials.gov NCT01888601.


Conflict of interest statement

S.V. is a co-inventor to a patent to detect molecules in a sample (US patent no. 10578620). M.A.B. has consulted for Achilles Therapeutics. A.M.F. is co-inventor to a patent application to determine methods and systems for tumour monitoring (PCT/EP2022/077987). M.J-H. has consulted for, and is a member of, the Achilles Therapeutics Scientific Advisory Board and Steering Committee; has received speaker honoraria from Pfizer, Astex Pharmaceuticals and Oslo Cancer Cluster; and holds patent PCT/US2017/028013 relating to methods for lung cancer detection. This patent has been licensed to commercial entities and under terms of employment. M.J.-H. is due a share of any revenue generated from such license(s). A. Hackshaw has received fees for being a member of independent data monitoring committees for Roche-sponsored clinical trials and academic projects co-ordinated by Roche. C.S. acknowledges grant support from AstraZeneca, Boehringer-Ingelheim, Bristol Myers Squibb, Pfizer, Roche-Ventana, Invitae (previously Archer Dx Inc — collaboration in minimal residual disease sequencing technologies) and Ono Pharmaceutical. C.S. is an AstraZeneca Advisory Board member and chief investigator for the AZ MeRmaiD 1 and 2 clinical trials, and is also co-chief investigator of the NHS Galleri trial, funded by GRAIL, and a paid member of GRAIL’s Scientific Advisory Board. He receives consultant fees from Achilles Therapeutics (where he is also a Scientific Advisory Board member), Bicycle Therapeutics (where he is also a Scientific Advisory Board member), Genentech, Medicxi, Roche Innovation Centre – Shanghai, Metabomed (until July 2022) and the Sarah Cannon Research Institute, had stock options in Apogen Biotechnologies and GRAIL until June 2021, currently has stock options in Epic Bioscience and Bicycle Therapeutics, and has stock options in and is co-founder of Achilles Therapeutics. C.S. is an inventor on a European patent application relating to assay technology to detect tumour recurrence (PCT/GB2017/053289); the patent has been licensed to commercial entities and under his terms of employment C.S is due a revenue share of any revenue generated from such license(s). C.S. holds patents relating to targeting neoantigens (PCT/EP2016/059401), identifying clinical response to immune checkpoint blockade (PCT/EP2016/071471), determining HLA loss of heterozygosity (PCT/GB2018/052004), predicting survival rates of patients with cancer (PCT/GB2020/050221), identifying patients whose cancer responds to treatment (PCT/GB2018/051912), detecting tumour mutations (PCT/US2017/28013), methods for lung cancer detection (US20190106751A1) and identifying insertion/deletion mutation targets (European and US, PCT/GB2018/051892), and is co-inventor to a patent application to determine methods and systems for tumour monitoring (PCT/EP2022/077987). C.S. is a named inventor on a provisional patent protection related to a ctDNA detection algorithm. G.A.W. is employed by and has stock options in Achilles Therapeutics. N.M. has received consultancy fees and has stock options in Achilles Therapeutics. N.M. holds European patents relating to targeting neoantigens (PCT/EP2016/ 059401), identifying clinical response to immune checkpoint blockade (PCT/ EP2016/071471), determining HLA loss of heterozygosity (PCT/GB2018/052004) and predicting survival rates of patients with cancer (PCT/GB2020/050221). D.A.M. reports speaker fees from AstraZeneca, Eli Lilly and Takeda, consultancy fees from AstraZeneca, Thermo Fisher, Takeda, Amgen, Janssen and Eli Lilly and has received educational support from Takeda and Amgen. S.C.T. has acted as a consultant for Revolution Medicines. N.J.B. is a co-inventor to a patent to identify patients whose cancer responds to treatment (PCT/GB2018/051912), a co-inventor on a patent for methods for predicting anti-cancer response (US14/466,208) and has a patent application (PCT/GB2020/050221) on methods for cancer prognostication. R.S. reports non-financial support from Merck and Bristol Myers Squibb (BMS); research support from Merck, Puma Biotechnology and Roche; and personal fees from Roche, BMS and Exact Sciences for advisory boards. E.L.C. is employed by and has stocks in Achilles Therapeutics.

Figures

Fig. 1
Fig. 1. Expression diversity in the TRACERx 421 cohort.
a, Relationship between PCs of transcriptomic diversity and genomic (black labels) and clinical (blue labels) variables. Displayed are the top PCs within LUADs (n = 480 regions from 190 tumours) and LUSCs (n = 303 regions from 119 tumours) that together explain at least 30% of the total variance, alongside their median ratio of heterogeneity (intratumour heterogeneity of PC activity divided by intertumour heterogeneity of PC activity). The colour of the border around each square indicates the direction of the association between each covariate and PC. In total, 39 variables were tested (Methods). Significance was determined using a mixed-effects linear model with purity as a fixed covariate and tumour as a random variable. Only features significant (P < 0.05) after FDR correction with at least one PC are displayed. *PC1 in LUAD was strongly negatively associated with the expression of hallmark gene sets related to proliferation (Extended Data Fig. 1f, Methods). GD, genome doubling; TMB, tumour mutational burden; wGII, weighted genome instability index. b, I-TED, calculated as the mean normalized gene expression correlation distance for a given region paired with every other region from the same tumour, displayed by histology. c, Proportion of variance in I-TED explained by selected genomic and clinical features from a linear model using 260 tumours with at least 2 primary tumour regions, and purity and genome instability estimates. Histological types represented by only a single tumour were excluded to ensure a sufficiently large sample size to estimate the effect of histology. **P = 0.003, ***P = 5.15 × 10−10. d, ASCAT-derived tumour purity and RNA estimate of the tumour transcripts fraction. Each dot represents one tumour region. A modified version of ASCAT was used to estimate the proportion of tumour and non-tumour cells within an admixed sequencing sample. e, dN/dS, inferring positive and negative selection of truncating somatic mutations, for cancer genes and non-cancer genes, by tertiles of median gene expression across the cohort (left) and by tertiles of gene expression ITH across the cohort (right). Dots represent the estimated dN/dS and the error bars represent the 95% confidence intervals calculated using the genesetdnds function in R from the package dNdScv. A dN/dS estimate is considered significant if the 95% confidence intervals do not overlap 1. Expression level tertiles contained 76, 24 and 9 cancer genes, and 4,856, 5,100 and 5,166 non-cancer genes, for tertiles 3, 2 and 1, respectively. Expression ITH tertiles contained 54, 24 and 31 cancer genes and 4,994, 5,082 and 5,046 non-cancer genes, for tertiles 3, 2 and 1, respectively. Median expression levels and expression ITH were based on the total number of tumour samples collected at surgical resection from tumours with more than one sample at that time point (n = 845 regions from 283 tumours).
Fig. 2
Fig. 2. ASE in NSCLC.
a, Schematic displaying the concepts of biallelic expression, CN-dependent ASE (CN-dep ASE) and CN-independent ASE (CN-ind ASE). b, Proportion of evaluable (containing an expressed SNP) genes affected by CN-dependent ASE and CN-independent ASE in tumours and normal tissue samples. LUAD, n = 454 regions from 144 tumours; LUSC, n = 293 regions from 88 tumours; Other, other subtypes, n = 130 regions from 38 tumours; Normal, tumour-adjacent normal lung tissue, n = 95. c, Points indicate odds ratio estimates for CN-independent ASE when somatic point mutations, or ASM (in samples for which both RRBS and RNA-seq were available) was concomitantly detected in the same gene, by type of alteration. Bars indicate 95% confidence intervals. Odds ratios for the links between CN-independent ASE and mutations and between CN-independent ASE and ASM are based on 876 primary tumour regions from 332 tumours and on 96 tumour regions from 31 tumours, respectively. d, Relationship in LUAD between the proportion of evaluable genes with CN-independent ASE and the ratio of differentially hypomethylated clusters of neighbouring CpGs compared to all differentially methylated genomic positions. The P value was calculated using a linear mixed-effects model with tumour as the random variable. e, Linear mixed-effects model showing the impact of driver mutations in candidate epigenetic modifier genes (mutated in more than five tumours) and tumour mutational burden on the proportion of evaluable genes with CN-independent ASE. Factors independently associated with increased CN-independent ASE in a multivariable model are coloured blue. *P < 0.05, **P < 0.01, ***P < 0.001. f, An example of genomic–transcriptomic mirrored subclonal allelic imbalance occurring in FAT1 within CRUK0640. DNA and RNA B allele frequencies (BAFs) for each SNP in FAT1 are plotted and coloured according to the reference and variant status of each allele for each region sampled within the tumour. In this instance, there is evidence of CN-dependent ASE in two regions and CN-independent ASE in one region. These events favour overexpression of different parental alleles and occur on different branches of the phylogenetic tree; a simplified version is displayed. MRCA, most recent common ancestor.
Fig. 3
Fig. 3. RNA-SBS signatures in NSCLC.
a, RNA-editing overview (from top to bottom): number and type of RNA substitutions per Mb per primary tumour, tumours are sorted from left to right by histological subtype and by number of substitutions; proportion of each editing type per tumour; NSCLC histological subtype per tumour. b, Number of RNA substitutions detected per tumour by histological subtype of NSCLC and in normal adjacent lung tissue. LUAD, n = 190; LUSC, n = 119; Other, other subtypes, n = 43; Normal, tumour-adjacent normal lung tissue, n = 96. Boxes represent the lower quartile, median and upper quartile. c, Left, trinucleotide profile of each RNA-SBS signature (left). Only samples from patients with more than 20 RNA variants were considered, n = 333. Right, signature ITH measured as standard deviation of each signature exposure across tumour regions divided by the mean exposure of each signature across the cohort, based on 280 tumours with more than 20 RNA variants and more than one region. The percentage of tumours with signature activity in at least one primary region is indicated in parentheses. d, Volcano plot showing the Pearson’s r correlations between the number of RNA-SBS1 (top) or RNA-SBS2 (bottom) substitutions with the expression of all genes in the transcriptome. P values were calculated using a linear mixed-effects model, using the tumour of origin of each region as random effect. P values were adjusted for repeated measures. Correlations were based on 765 primary tumour regions with at least 20 RNA variants from 329 tumours. Colour indicates dot density, with light coloured points belonging to areas of high density in the plot. e, Correlation between the exposure of RNA-SBS signatures within tumour-adjacent normal lung tissue and their respective primary tumour regions, and metastatic tumour regions and their respective seeding regions in the primary tumour. Primary tumour exposure was calculated as the median exposure across all primary regions for the comparison with tumour-adjacent normal tissue, and across all seeding regions for the comparison with metastases. Only primary–metastasis pairs where more than 20 RNA substitutions were detected in the metastasis and primary region were used (n = 50 pairs for normal samples, n = 31 for metastases). P values were computed with a two-sided t test testing the null hypothesis that the Pearson correlation coefficient r = 0.
Fig. 4
Fig. 4. Transcriptional landscape of seeding tumour regions.
a, Expression distance between primary regions compared to either metastatic LN regions or pulmonary nodules resected at the time of surgery (left) or metastatic regions resected at relapse within the same patient (right). Only tumours containing two or more regions with at least one metastatic region sampled are shown (n = 50 primary–metastasis pairs from 35 tumours). b, First two PCs for all available primary and metastatic tumour regions in an example tumour, CRUK0361, based on gene expression levels. The region containing the seeding clone was more proximal to the metastatic sample than other primary regions. c, Expression distance between metastatic samples and their paired primary samples across the cohort depending on whether the region contained a seeding clone(s). The analysis was run on 22 metastatic samples that had gene expression data for both seeding and non-seeding primary regions. d, ROC curves for ensemble models trained on each feature set: genomic only (red), transcriptomic only (blue), combined genomic and transcriptomic (green) and assessed against the held-out test dataset. The predictions are based on 516 primary tumour regions from 206 tumours for which seeding status could be established and for which all metrics tested could be measured (307 non-seeding regions, 209 seeding), with a 75/25% training/test dataset split. e, Mean Shapley additive explanations (SHAP) values (calculated across the held-out test dataset) for each feature in the combined ensemble model, capturing the importance of each feature for model prediction. Label colours indicate the feature type, genomic (red) or transcriptomic (blue), and box colours indicate the model type from which the SHAP values were extracted. The symbols at the end of the bars indicate either a significantly positive (+) or negative (–) association, with increased weight for seeding potential based on a two-sided Wilcoxon test comparing seeding to non-seeding regions. MLP-SVM, multilayer perceptron with support vector machine. All box plots in this figure represent the lower quartile, median and upper quartile, whiskers represent lower and higher bound ±1.5× interquartile range. All Wilcoxon tests shown here (paired or unpaired) were two sided.
Extended Data Fig. 1
Extended Data Fig. 1. Patterns of expression diversity in the TRACERx cohort.
a. Uniform manifold approximation and projection (UMAP) showing the distribution of each primary tumour region in the cohort based on gene expression. n = 914 tumour regions collected at surgical resection from 352 primary tumours, n = 33 recurrence/relapse samples from 24 tumours and n = 96 paired normal samples from 96 tumours. LUAD: Lung adenocarcinoma; LUSC: Lung squamous cell carcinoma; LCNEC: Large cell neuroendocrine carcinoma. b. Percentage of tumours with and without ‘LUAD drivers’ (driver mutations enriched in LUADs) in LUAD, non-LUADs clustering with LUADs in the UMAP and non-LUADs clustering apart from LUADs. Number of tumours within each category is annotated. c. Mean number of variables significantly associated with each principal component (PC) of gene expression after randomly sub-sampling the number of LUAD regions to match that of LUSC regions (n = 303) for 50 iterations. LUAD subtypes were not included in this comparison to ensure an equal number of variables between LUAD and LUSC. d. PC associations with each of the different RAS activation groups (RAG) developed by East and colleagues. PC activity different significantly between RAGs. Analysis based on 480 tumour regions collected at surgical resection from 190 LUAD tumours where RAG could be estimated. e. Proportion of LUAD tumours in smokers (comprising current and ex-smokers) and never smokers, split by LUAD subtype, with either G12C KRAS driver mutations, non-G12C KRAS driver mutations or driver mutations in other genes. Numbers annotated indicate the number of tumours per category. f. Pearson’s r between each PC and functional groups comprising the fifty MSigDb Hallmark gene sets. Pearson’s r values were averaged within the functional group to which each hallmark was assigned across LUAD, n = 480 tumour regions from 190 tumours; and LUSC, n = 303 tumour regions from 119 tumours. The colour of the border around each square indicates the direction of the association between each covariate and PC for significant (FDR<0.05) associations. Significance was determined through a mixed effects linear model using purity as a fixed covariate and tumour as a random variable; P values were calculated by hallmark and combined within MSigDB functional group using the harmonic mean. g. Immuno-histochemical staining for Ki67 proliferation marker in LUAD tumours with and without EGFR driver mutations. Only the 196 LUAD tumours within which Ki67 was measured are displayed. Significance was calculated through a two-sided unpaired Wilcoxon test. WT: Wild type. h. Percentage of variance in Intra-Tumour Expression Distance (I-TED) that was explained by intra-tumour variance in tumour transcript fraction and intra-tumour variance in tumour purity, in a linear regression. Analysis based on 258 tumours with at least two primary tumour regions, and purity and tumour transcript fraction estimates. ***:P value = 5.03 × 10−8; **:P value = 0.007. i. dN/dS in non-cancer and cancer genes for different quantiles of ITH or expression amplitude. Asterisks indicate significance whereby the 95% confidence interval of the dN/dS estimate did not overlap 1 signalling either negative (blue square) or positive (red square) selection. Broadly, lower quantiles of ITH tended towards negative selection in non-cancer genes, whereas the opposite was true for cancer genes. Results based on bootstrapping from the total number of tumour samples resected at surgery of the primary tumour from tumours with more than one sample at that time point, 845 regions from 285 tumours. j. Percentage of all essential genes from the Project Achilles list (n = 604) in lung cancer for tertiles of expression ITH or amplitude. All box plots in this figure represent lower quartile, median and upper quartile, whiskers represent lower/higher bound +/− 1.5 x interquartile range.
Extended Data Fig. 2
Extended Data Fig. 2. Genomic and transcriptomic links with allele-specific expression.
a. Points indicate odds ratio estimates for copy-number dependent allele-specific expression (CN-dependent ASE) when somatic point mutations, or allele-specific methylation (where both RRBS and RNA-Seq were available) were concomitantly detected in the same gene, by type of alteration. Bars indicate 95% confidence intervals. Odds ratio for the links between CN-dependent ASE and mutations; and CN-dependent ASE and ASM are based on 876 primary tumour regions from 332 tumours, and 96 tumour regions from 31 tumours, respectively. b. Relationship between the proportion of CN-independent ASE in a tumour that is subclonal, being found in a subset of regions within a given tumour, and intra-tumour expression diversity. The Pearson correlation coefficient is shown (r = 0.25, P = 4 × 10−5). c. Percentage of variation in I-TED that was explained by single nucleotide variant (SNV), SCNA and CN-independent ASE ITH, as well as the number of subclonal whole genome duplication events (GDs) per tumour. The linear regression was based on 269 tumours where all variables could be calculated. ***:P = 2.4 × 10−10; **:P = 0.004. d. PCA of CN-independent ASE patterns in TRACERx421 tumours (n = 877 tumour regions) and normal tissue (n = 95) samples where CN-independent ASE could be estimated. Samples are coloured by tissue type. Values within parentheses on the axes indicate the proportion of variance explained by each principal component. e. Genes with CN-independent ASE in either tumour or normal tissue samples. Genes with an enrichment of CN-independent ASE in tumours are marked in blue, lung cancer genes are represented by triangles and imprinted genes have a black outline. Enrichment was defined as FDR < 0.05 from a Fisher’s exact test per gene. The number of regions used to calculate enrichment varied per gene between 5 and 850 (median = 164) for tumours and between 5 and 95 (median = 35) for normal tissue. f. Relationship in LUSC between the proportion of evaluable genes with CN-independent ASE and the ratio of differentially hypo-methylated clusters of neighbouring CpGs compared to all differentially methylated genomic positions. The Pearson correlation coefficient is shown; P value was calculated using a linear mixed-effects model with tumour as random variable (r = −0.18, P = 0.35). g. Percentage of evaluable genes affected by CN-independent ASE in wild type (WT) and SETD2 deficient isogenic cell lines. Expression data was obtained from publicly available datasets from three separate studies in three different cell lines: in total, data from 10 cell lines across 3 experiments (n = 6, 2 and 2). Boxes represent lower quartile, median and upper quartile. P values were calculated using a linear mixed effects model, using the study of origin of each sample as a random effect. SETD2-/-: inactivation of the SETD2 gene.
Extended Data Fig. 3
Extended Data Fig. 3. Patterns of RNA variant diversity in TRACERx.
a. Overview of RNA substitutions in the primary tumour lung TRACERx cohort, from top to bottom: Number and type of RNA variants per megabase per tumour, tumours are sorted from left to right by histological subtype and by number of variants; Proportion of each variant type per tumour; Proportion of variants present in any of the normal samples; Proportion of tumour-specific RNA variant sites shared across at least two tumours. NSCLC histological subtype per patient. LUAD, lung adenocarcinomas, n = 190; LUSC, lung squamous cell carcinomas, n = 119; Other, other subtypes, n = 43; tumour-adjacent normal lung tissue, n = 96. b. Volcano plots showing Pearson correlations between the number of RNA variant signature substitutions and gene expression for all genes in the transcriptome, split by RNA single-base substitution (SBS) signature. P values were calculated using a linear mixed effects model, using tumour of origin of each region as random effect. The genes with the 5 most significant correlations with each signature are labelled. P values were adjusted for repeated measures. Correlations were based on 765 primary tumour regions with at least 20 RNA variants from 329 tumours. Colour indicates dot density, with light coloured points belonging to areas of high density in the plot. c. Proportion of RNA variants relative to variant type (A>G or C>T) in 4nt RNA loops. C>T substitutions were more prevalent in the 4th nucleotide of 4nt RNA hairpin loops, consistent with APOBEC RNA editing activity. d. Proportion of substitutions assigned to RNA-SBS2 activity compared to the proportion of RNA variants at CAT[C>T] motif sites per tumour region (CAUC ratio). Blue dots represent regions where RNA editing at these motifs was enriched (Fisher’s test P<0.05 for C>T substitutions at each site compared to C sites in a 40nt genomic region). P values were computed based on a two-sided t test testing the null hypothesis that the Pearson correlation coefficient (r) = 0, within 892 tumour regions and 77 tumour-adjacent normal tissue samples with at least 10 C>T variants. e. Pearson correlation between the exposure of RNA-SBS signatures within metastatic tumour regions and their respective seeding regions in the primary tumour (left); and tumour-adjacent normal lung tissue and their respective primary tumour regions (right). Primary tumour exposure was calculated as the median exposure across all primary regions for the comparison with normal tumour-adjacent tissue, and of all seeding regions for the comparison with metastases. Only primary-metastasis pairs where more than 20 RNA substitutions were detected in the metastasis and primary region were used (n = 50 pairs for normals, n = 31 for metastases). P values were computed based on a two-sided t test testing the null hypothesis that the Pearson correlation coefficient = 0. f. Pearson correlation between the activity of RNA-SBS1 and the global levels of methylation in a tumour region (measured as the percentage of all differentially methylated positions that are differentially hypomethylated clusters of neighbouring CpGs). Methylation data and sufficient RNA substitutions for signature deconvolution were available for 80 regions from 31 tumours. P values were calculated using a linear mixed effects model, using tumour of origin of each region as a random effect.
Extended Data Fig. 4
Extended Data Fig. 4. Transcriptional features of metastasis.
a. Expression distance between paired primary tumour regions; compared to distance between paired primary and non-LN intrathoracic metastatic tumour regions. Only patients with two or more primary regions and at least one metastatic region sampled are shown (12 primary-metastasis pairs from 8 tumours). Boxes represent lower quartile, median and upper quartile, whiskers represent lower/higher bound +/− 1.5 x interquartile range. Significance was tested using a paired Wilcoxon test (P = 0.00098). b. Gene set enrichment analysis (GSEA) of functional groups from hallmark gene sets between metastasis seeding and non-seeding regions. Only tumours where both seeding and non-seeding regions had RNA-seq were included (n = 37, 122 regions). Dots coloured by a significant enrichment after FDR correction. Mean normalised enrichment score (NES) is displayed on the x-axis and indicates the enrichment for a given gene set, and the negative log of the adjusted P value is displayed on the y-axis. c. Overview schematic of the machine learning framework used to predict whether a region contains a metastasis-seeding clone(s). MLP-SVM: multilayer-perceptron with support vector machine terminal layer. d. Individual Shapley Additive Explanations (SHAP) values for the most important features across the combined ensemble. Positive SHAP values indicate weighting towards a prediction of metastasis seeding whereas negative SHAP values indicate a weighting towards prediction of metastasis non-seeding. Colour scale represents the value of the feature across the test dataset (red=high values, blue=low values). For instance, high values of the ORACLE expression marker (red dots) were associated with a higher likelihood of a region being seeding (positive SHAP values) in the combined ensemble. The predictions were based on 516 primary tumour regions from 206 tumours where seeding status could be established and where all metrics tested could be measured (307 non-seeding regions, 209 seeding), with a 75%-25% training-test dataset split. TMB: tumour mutational burden; CN-ind ASE: Copy number-independent allele specific expression; HPCS: High Plasticity Cell State; GD: genome doubling; CCF: cancer cell fraction; Clone dominance CCF: maximum CCF at terminal nodes of a phylogenetic tree; SCNA: somatic copy number alteration.

Comment in

References

    1. Black JRM, McGranahan N. Genetic and non-genetic clonal diversity in cancer evolution. Nat. Rev. Cancer. 2021;21:379–392. doi: 10.1038/s41568-021-00336-2. - DOI - PubMed
    1. Bailey C, et al. Tracking cancer evolution through the disease course. Cancer Discov. 2021;11:916–932. doi: 10.1158/2159-8290.CD-20-1559. - DOI - PMC - PubMed
    1. Jamal-Hanjani M, et al. Tracking the evolution of non-small-cell lung cancer. N. Engl. J. Med. 2017;376:2109–2121. doi: 10.1056/NEJMoa1616288. - DOI - PubMed
    1. PCAWG Transcriptome Core Group et al. Genomic basis for RNA alterations in cancer. Nature. 2020;578:129–136. doi: 10.1038/s41586-020-1970-0. - DOI - PMC - PubMed
    1. Marjanovic ND, et al. Emergence of a high-plasticity cell state during lung cancer evolution. Cancer Cell. 2020;38:229–246.e13. doi: 10.1016/j.ccell.2020.06.012. - DOI - PMC - PubMed

Publication types

Substances

Associated data