. 2023 Apr;616(7957):563-573.
doi: 10.1038/s41586-023-05771-9. Epub 2023 Apr 12.

Antibodies against endogenous retroviruses promote lung cancer immunotherapy

Collaborators, Affiliations

Antibodies against endogenous retroviruses promote lung cancer immunotherapy

Kevin W Ng et al. Nature. 2023 Apr.

Abstract

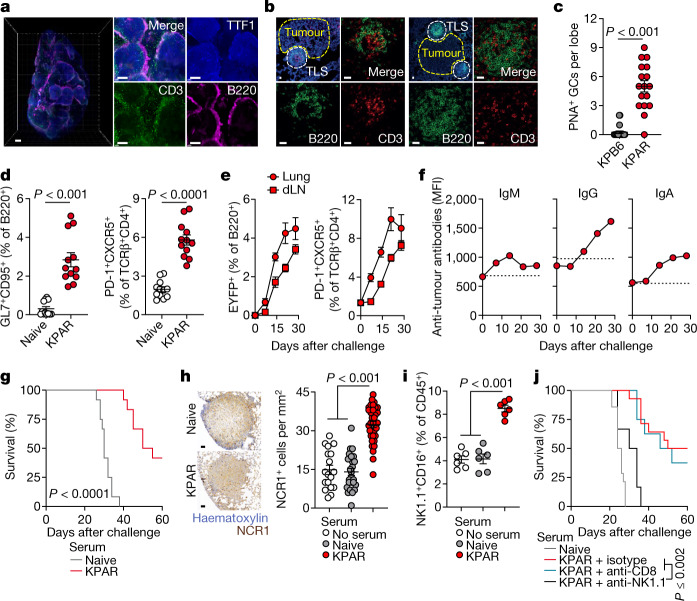
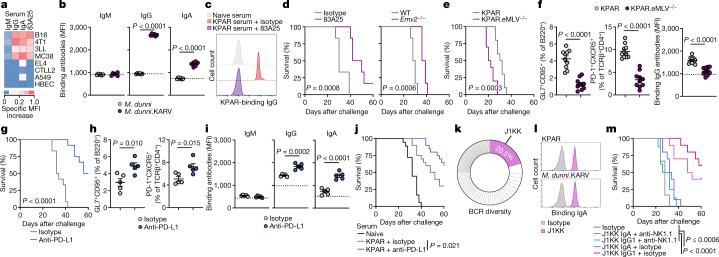
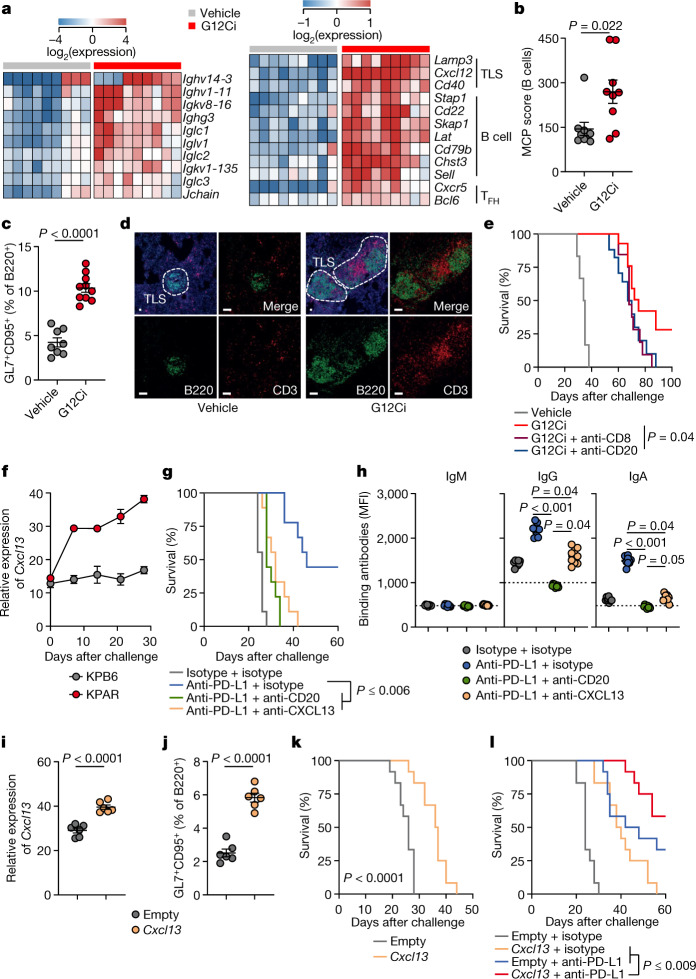
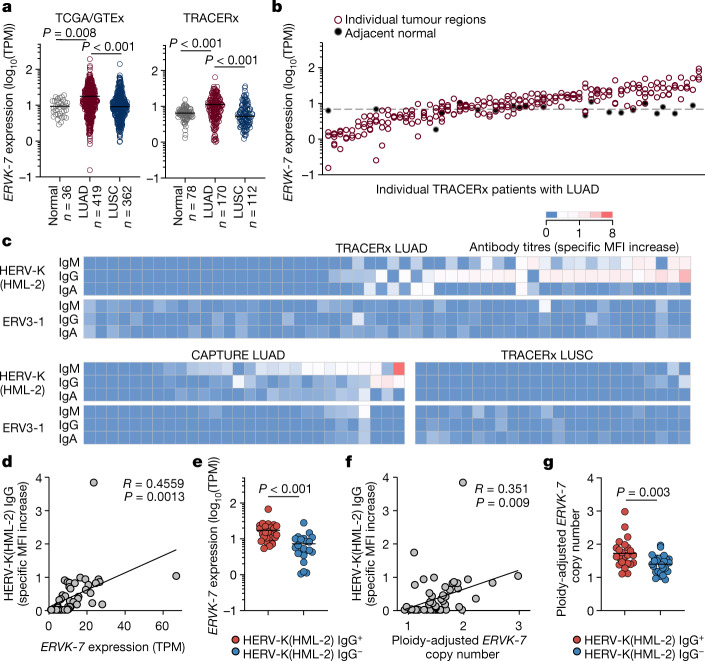
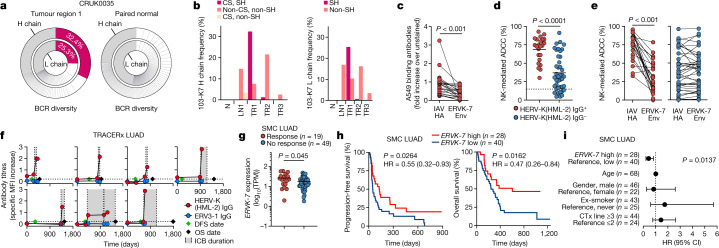
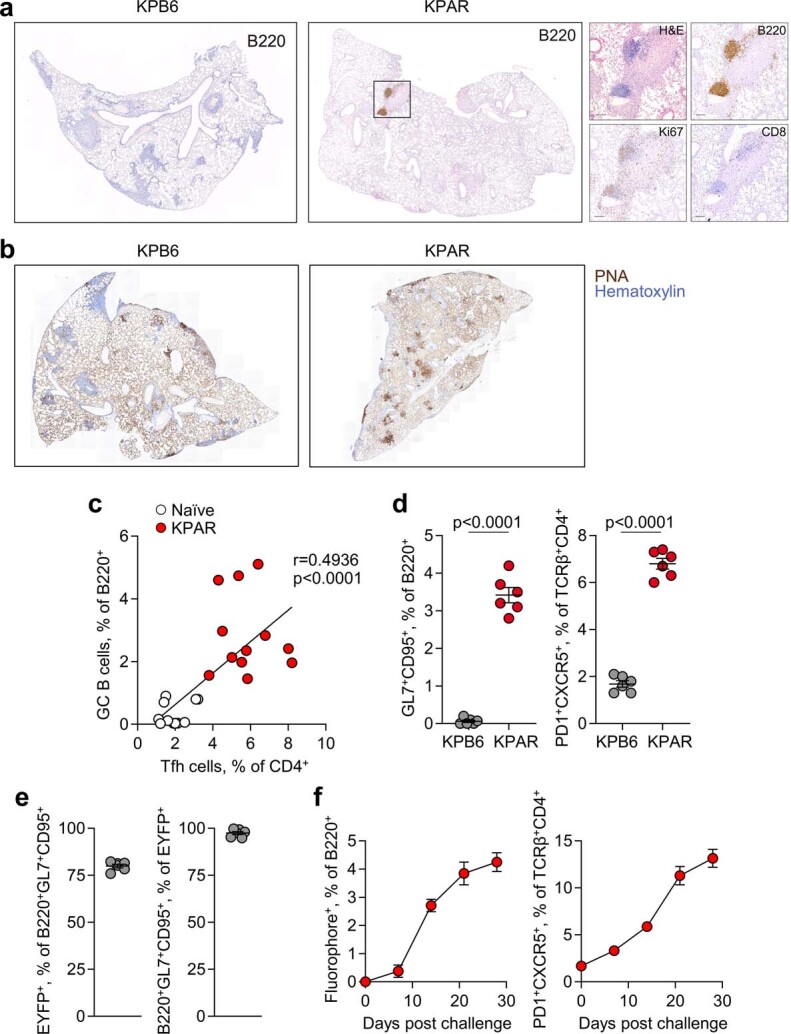
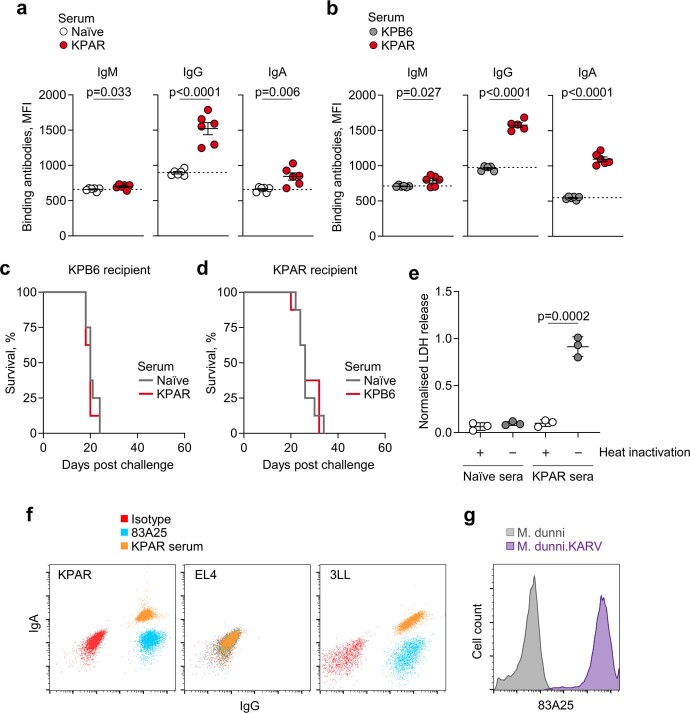
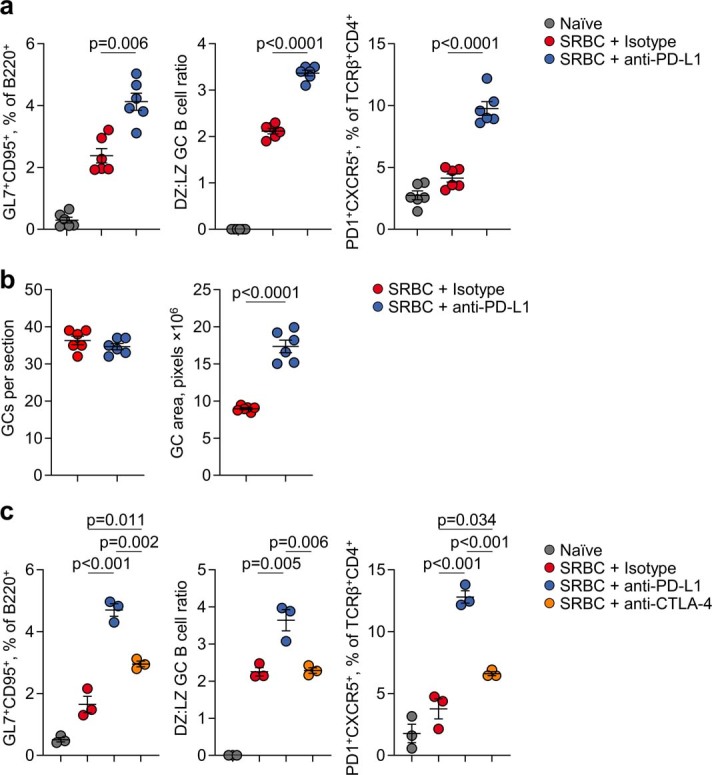
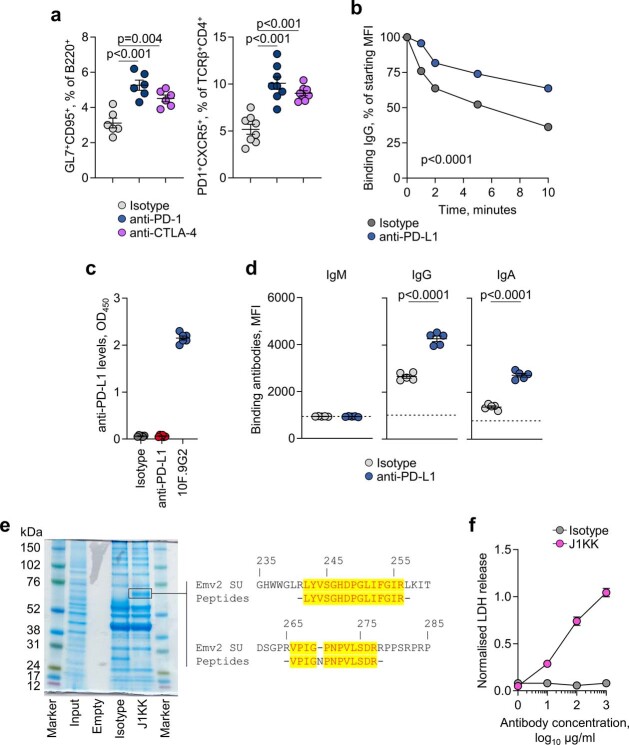
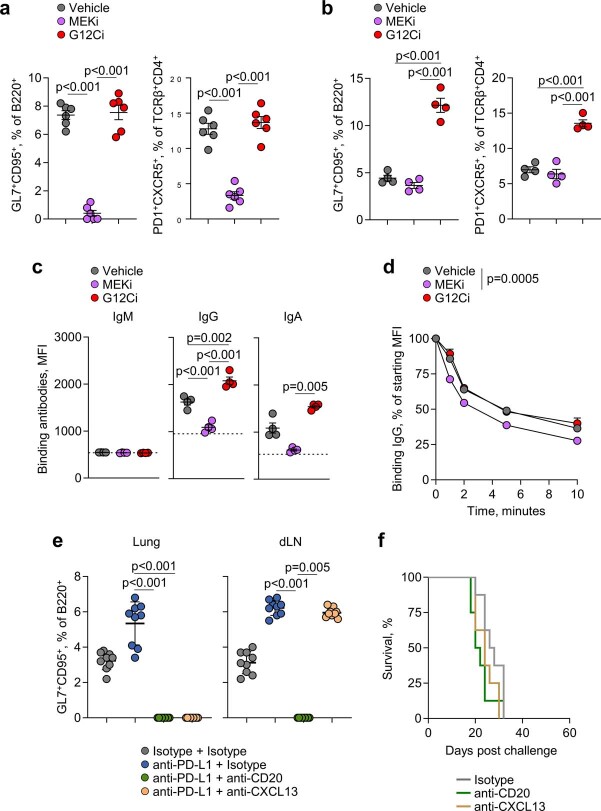
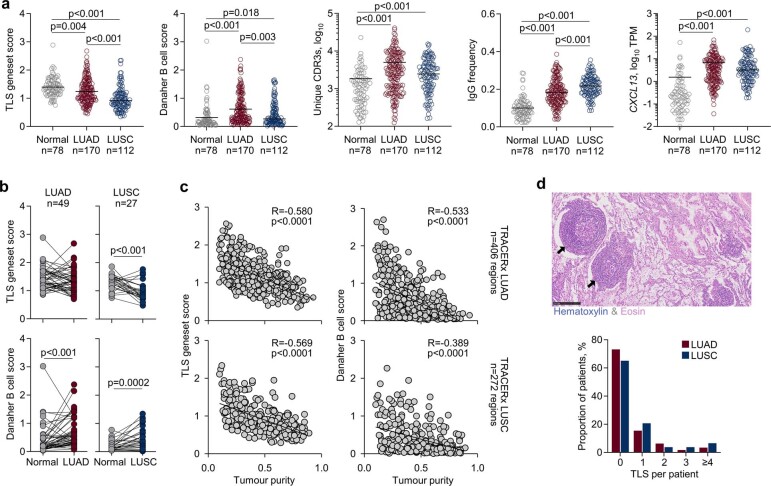
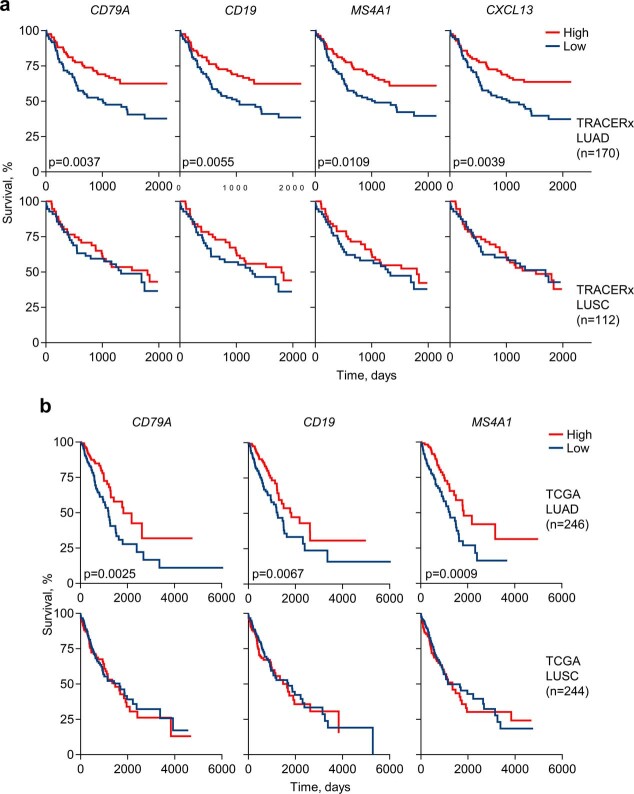
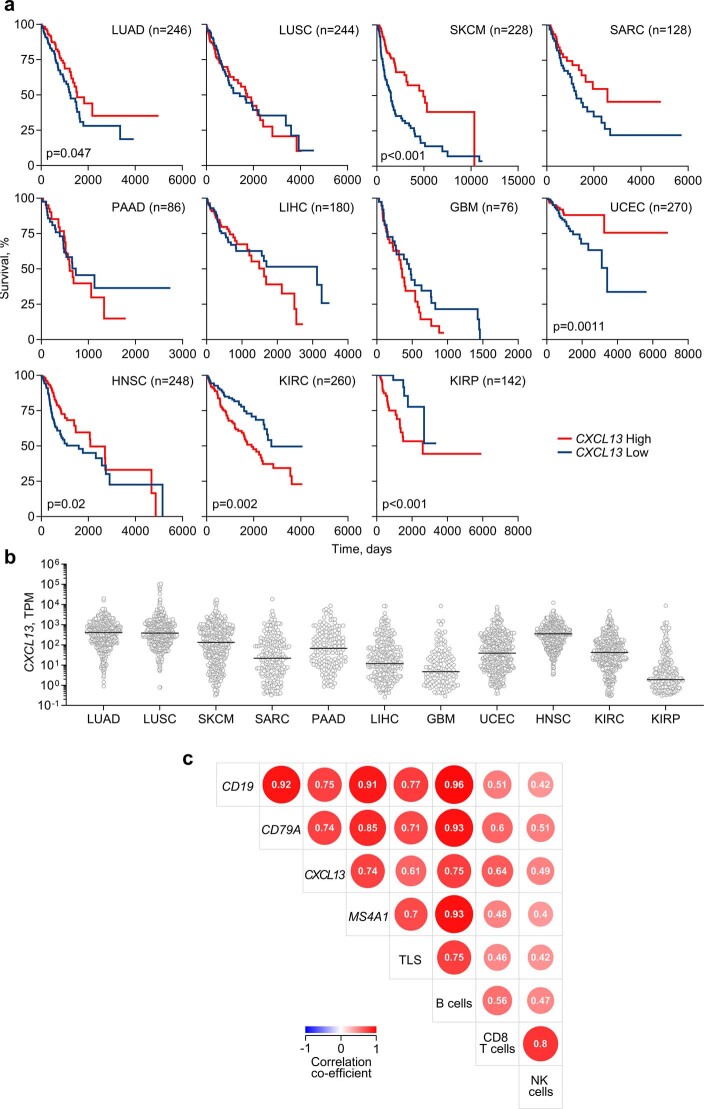
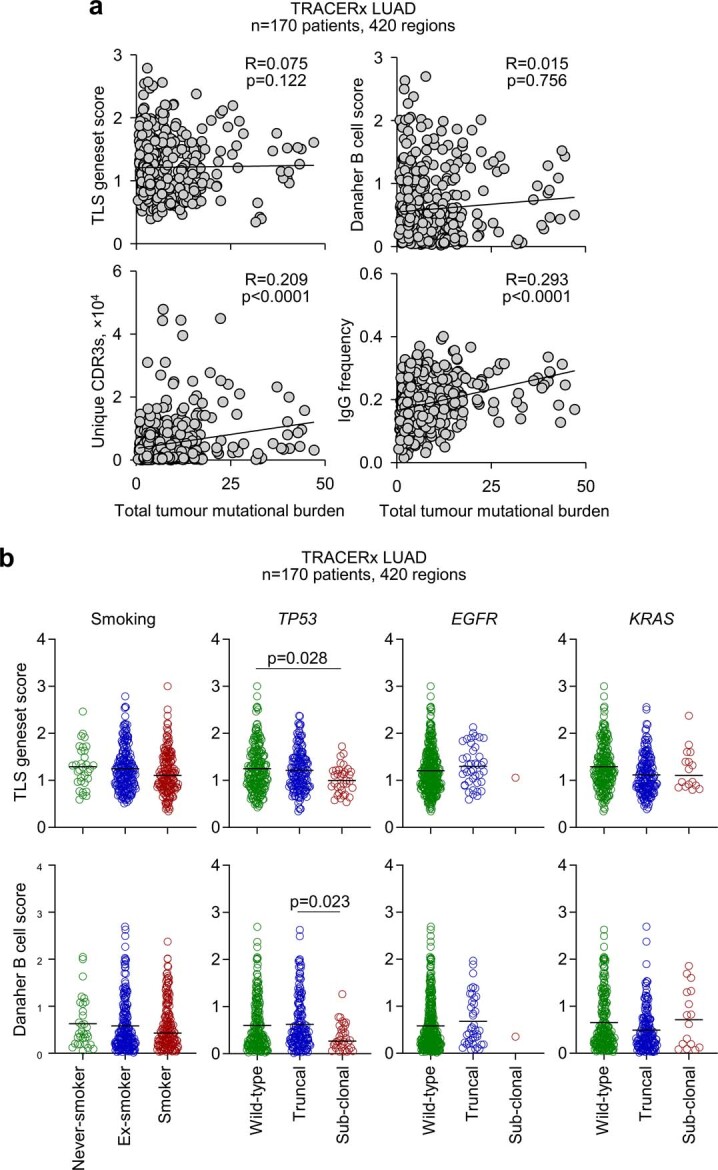
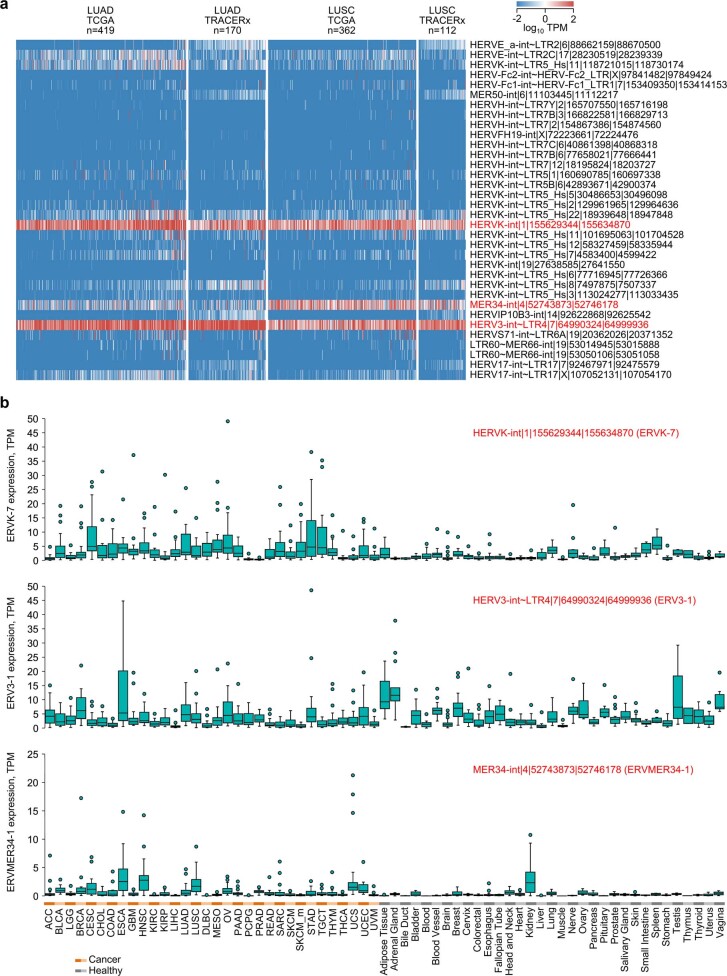
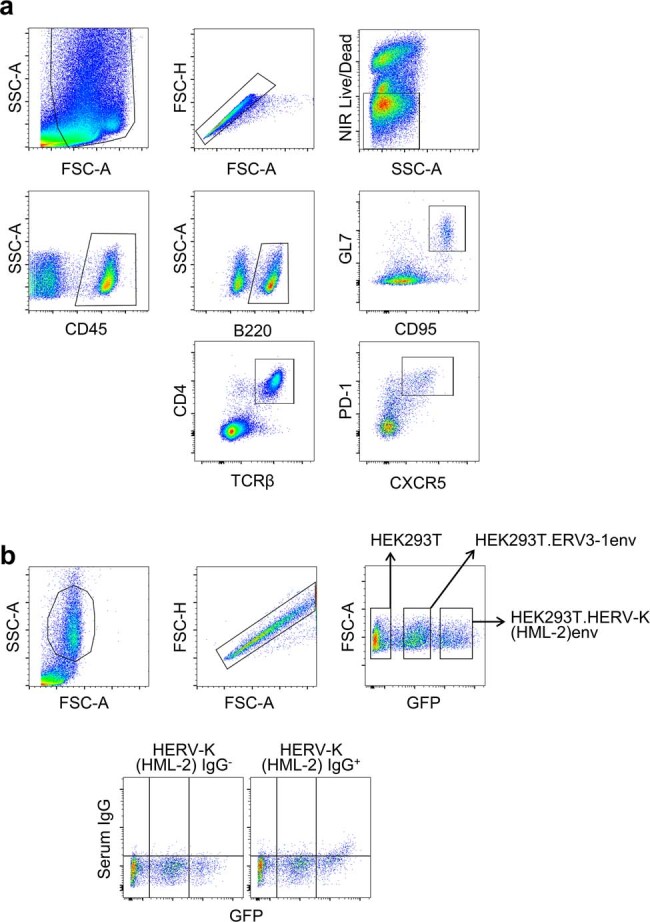
B cells are frequently found in the margins of solid tumours as organized follicles in ectopic lymphoid organs called tertiary lymphoid structures (TLS)1,2. Although TLS have been found to correlate with improved patient survival and response to immune checkpoint blockade (ICB), the underlying mechanisms of this association remain elusive1,2. Here we investigate lung-resident B cell responses in patients from the TRACERx 421 (Tracking Non-Small-Cell Lung Cancer Evolution Through Therapy) and other lung cancer cohorts, and in a recently established immunogenic mouse model for lung adenocarcinoma3. We find that both human and mouse lung adenocarcinomas elicit local germinal centre responses and tumour-binding antibodies, and further identify endogenous retrovirus (ERV) envelope glycoproteins as a dominant anti-tumour antibody target. ERV-targeting B cell responses are amplified by ICB in both humans and mice, and by targeted inhibition of KRAS(G12C) in the mouse model. ERV-reactive antibodies exert anti-tumour activity that extends survival in the mouse model, and ERV expression predicts the outcome of ICB in human lung adenocarcinoma. Finally, we find that effective immunotherapy in the mouse model requires CXCL13-dependent TLS formation. Conversely, therapeutic CXCL13 treatment potentiates anti-tumour immunity and synergizes with ICB. Our findings provide a possible mechanistic basis for the association of TLS with immunotherapy response.

Trial registration: ClinicalTrials.gov NCT01888601.


Conflict of interest statement

C.S. acknowledges grant support from AstraZeneca, Boehringer-Ingelheim, Bristol Myers Squibb, Pfizer, Roche-Ventana, Invitae (previously Archer Dx Inc - collaboration in minimal residual disease sequencing technologies), Ono Pharmaceutical, and Personalis. He is an AstraZeneca Advisory Board member and Chief Investigator for the AZ MeRmaiD 1 and 2 clinical trials and is also Co-Chief Investigator of the NHS Galleri trial funded by GRAIL and a paid member of GRAIL’s Scientific Advisory Board. He receives consultant fees from Achilles Therapeutics (also SAB member), Bicycle Therapeutics (also a SAB member), Genentech, Medicxi, China Innovation Centre of Roche (CICoR) formerly Roche Innovation Centre – Shanghai, Metabomed (until July 2022), and the Sarah Cannon Research Institute C.S has received honoraria from Amgen, AstraZeneca, Pfizer, Novartis, GlaxoSmithKline, MSD, Bristol Myers Squibb, Illumina, and Roche-Ventana. C.S. had stock options in Apogen Biotechnologies and GRAIL until June 2021, and currently has stock options in Epic Bioscience, Bicycle Therapeutics, and has stock options and is co-founder of Achilles Therapeutics. C.S. is an inventor on a European patent application relating to assay technology to detect tumour recurrence (PCT/GB2017/053289). The patents have been licensed to commercial entities, and under their terms of employment C.S. is due a revenue share of any revenue generated from such license(s). C.S. declares patent applications for targeting neoantigens (PCT/EP2016/059401), identifying patent response to ICB (PCT/EP2016/071471), determining HLA loss of heterozygosity (PCT/GB2018/052004), predicting survival rates of patients with cancer (PCT/GB2020/050221) and identifying patients who respond to cancer treatment (PCT/GB2018/051912); US patents relating to detecting tumour mutations (PCT/US2017/028013) and methods for lung cancer detection (US20190106751A1); and both a European and US patent related to identifying indel mutation targets (PCT/GB2018/051892) and is co-inventor on a patent application to determine methods and systems for tumour monitoring (PCT/EP2022/077987). G.K. is a scientific co-founder of EnaraBio and a member of its scientific advisory board. G.K. has consulted for EnaraBio and Repertoire Immune Medicines. J.D. has acted as a consultant for AstraZeneca, Bayer, Jubilant, Theras, BridgeBio, Vividion and Novartis and has funded research agreements with Bristol Myers Squibb, Revolution Medicines and AstraZeneca. K.S.S.E. acknowledges grant support from Bristol Myers Squibb. K.L. has a patent on indel burden and CPI response pending and has speaker fees from Roche tissue diagnostics, research funding from the CRUK TDL/Ono/LifeArc alliance and Genesis Therapeutics, and consulting roles with Monopteros Therapeutics and Kynos Therapeutics. J. Attig is currently an employee of and owns shares in Hoffmann-La Roche. S.V. is a co-inventor on a patent for detecting molecules in a sample (US patent 10578620). S.d.C.T. has acted as a consultant for Revolution Medicines. C.T.H. has received speaker fees from AstraZeneca. D.A.M. reports speaker fees from AstraZeneca, Eli Lilly and Takeda and consultancy fees from AstraZeneca, Thermo Fisher, Takeda, Amgen, Janssen, MIM Software, Bristol Myers Squibb and Eli Lilly and has received educational support from Takeda and Amgen. R.S. reports non-financial support from Merck and Bristol Myers Squibb, research support from Merck, Puma Biotechnology and Roche, and personal fees from Roche, Bristol Myers Squibb and Exact Sciences for advisory boards. A.M.F. is a co-inventor on a patent application to determine methods and systems for tumour monitoring (PCT/EP2022/077987). M.A.B. has consulted for Achilles Therapeutics. G.A.W. is employed by and has stock options in Achilles Therapeutics. N.J.B. is a co-inventor on a patent to identify responders to cancer treatment (PCT/GB2018/051912), has a patent application (PCT/GB2020/050221) on methods for cancer prognostication and is a co-inventor on a patent for methods for predicting anti-cancer response (US14/466,208). A.H. has received fees for being a member of the independent data monitoring committees for Roche-sponsored clinical trials and academic projects coordinated by Roche. N. McGranahan has received consultancy fees and has stock options in Achilles Therapeutics. N. McGranahan holds European patents relating to targeting neoantigens (PCT/EP2016/ 059401), identifying patient response to ICB (PCT/ EP2016/071471), determining HLA loss of heterozygosity (PCT/GB2018/052004) and predicting survival rates of patients with cancer (PCT/GB2020/050221). M.J.-H. has consulted for, and is a member of, the Achilles Therapeutics scientific advisory board and steering committee, has received speaker honoraria from Pfizer, Astex Pharmaceuticals and Oslo Cancer Cluster, and is a co-inventor on European patent application PCT/US2017/028013 relating to methods for lung cancer detection. This patent has been licensed to commercial entities, and under terms of employment M.J.-H. is due a share of any revenue generated from such license(s). The remaining authors declare no competing interests.

Figures

Fig. 1
Fig. 1. B cell responses in mouse LUAD.
a, Immunostaining of B220 (B cells), CD3 (T cells) and TTF1 (tumour cells) in lungs from mice bearing KPAR tumours (scale bars, 500 µm). Representative images of five mice. b, B220 and CD3 immunofluorescence and DAPI staining in KPAR tumour-bearing lungs (scale bars, 20 µm). Representative images of six mice. c, Quantification of PNA+ mature TLS and GCs by histochemistry in KPB6 (n = 10) and KPAR (n = 4) tumour-bearing lung lobes. d, Flow cytometry quantification of B220+GL7+CD95+ GC B cells and TCRβ+CD4+PD-1+CXCR5+ TFH cells in naive and KPAR tumour-bearing lungs (n = 12 mice per group from three experiments). e, Time-course quantification by flow cytometry of B220+EYFP+ and TFH cells in KPAR lungs and draining lymph nodes (dLNs) from AicdaCreERT2Rosa26LSL-EYFP mice (n = 6 mice per time point from one experiment). f, Time-course quantification of KPAR-binding IgM, IgG and IgA from KPAR serum (n = 6). Dashed lines denote the mean staining intensity of naive serum. MFI, mean fluorescence intensity. g, Survival of KPAR recipient mice treated with pooled serum from KPAR tumour-bearing or naive donor mice (n = 12 mice per group from two experiments). h, Representative images (scale bars, 50 µm) and quantification of intratumoural NCR1+ NK cells in KPAR recipients that were untreated or treated with naive or KPAR serum (n = 8 mice per group from two experiments). i, Flow cytometry quantification of NK1.1+CD16+ NK cells in lungs of KPAR recipients that were untreated or treated with naive or KPAR serum (n = 6 mice per group). j, Survival of KPAR recipient mice treated with naive serum (n = 14) or with KPAR serum and anti-NK1.1 (n = 6), anti-CD8 (n = 8) or isotype control (n = 14) (from two experiments). Data in cf,h,i are represented as mean ± s.e.m. P values were calculated by two-sided Mann–Whitney rank-sum test in c and d (left), two-sided Student’s t test in d (right), one-way ANOVA with Bonferroni correction for multiple comparisons in h,i and log-rank test in g,j. Source data
Fig. 2
Fig. 2. Anti-ERV antibodies in mouse LUAD.
a, KPAR serum and 83A25 antibody binding to mouse (B16, 4T1, 3LL, MC38, EL4, CTLL2) and human (A549, HBEC) cell lines. The scale denotes the specific MFI increase over naive sera or isotype controls. b, Quantification of M.dunni.KARV- and M.dunni-binding IgM, IgG and IgA from KPAR serum (n = 6 mice from two experiments). Dashed lines denote the MFI of naive sera. c, KPAR-binding IgG from naive or KPAR sera, blocked with 83A25 or isotype control antibodies. Representative histograms of five independent replicates. d, Survival of KPAR tumour-bearing mice treated with 83A25 or isotype control or untreated wild-type (WT) and Emv2−/− hosts (n = 6 mice per group from one experiment). e, Survival of KPAR and KPAR.eMLV−/− tumour-bearing mice (n = 10 mice per group from one experiment). f, Quantification of GC B cells, TFH cells and KPAR-binding IgG in KPAR and KPAR.eMLV−/− tumour-bearing mice (n = 10 mice per group). g, Survival of KPAR mice treated with anti-PD-L1 or isotype control (n = 12 mice per group from two experiments). h, Quantification of GC B cells and TFH cells in lungs from KPAR tumour-bearing mice treated with anti-PD-L1 or isotype control (n = 5 mice per group). i, KPAR-binding IgM, IgG and IgA from the sera of mice treated with anti-PD-L1 or isotype control (n = 5 mice per group). j, Survival of recipient KPAR-challenged mice treated with anti-PD-L1-treated KPAR serum (n = 20), isotype-treated KPAR serum (n = 20) or naive serum (n = 18) (from three experiments). k, Frequency of BCR CDR3 clonotypes in anti-PD-L1-treated KPAR lungs (n = 3, pooled). l, J1KK and IgA isotype binding to KPAR or M.dunni.KARV cells. m, Survival of KPAR tumour-bearing mice treated with J1KK IgA with (n = 10) or without (n = 10) anti-NK1.1, J1KK IgG1 with (n = 8) or without (n = 10) anti-NK1.1, or isotype control (n = 6) (from one experiment). Data in b,f,h,i are represented as mean ± s.e.m. P values were calculated by two-sided Student’s t test in b,f,h,i and log-rank test in d,e,g,j,m. Source data
Fig. 3
Fig. 3. B cell responses in LUAD therapies.
a,b, Immunoglobulin and TLS-related gene expression (a) and MCPCounter B cell scores (b) in MRTX-849 (G12Ci)- or vehicle control-treated KPAR tumours (n = 9 mice per group from one experiment). c, GC B cell quantification in G12Ci-treated (n = 10) or vehicle-treated (n = 8) lungs from KPAR-challenged mice (from one experiment). d, B220 (B cells) and CD3 (T cells) immunofluorescence and DAPI staining in G12Ci- and vehicle control-treated lungs from KPAR-challenged mice (scale bars, 20 µm). Representative images of four individual mice. e, Survival of vehicle control-treated (n = 6) or G12Ci-treated (n = 16) KPAR-challenged mice and those additionally treated with anti-CD20 (n = 17) or anti-CD8 (n = 16) before G12Ci treatment (from two experiments). f, Time-course quantification by quantitative PCR with reverse transcription (RT–qPCR) of Cxcl13 expression in KPAR or KPB6 lungs (n = 3 per time point per tumour type from one experiment). g,h, Survival (g) and KPAR-binding IgM, IgG and IgA levels in the serum (h) of KPAR-challenged mice treated with anti-PD-L1, anti-CD20 and anti-CXCL13 or isotype controls (n = 9 mice per group from one experiment). i, Quantification by RT–qPCR of Cxcl13 transcripts in the lungs of KPAR-challenged mice treated with intranasal plasmid encoding Cxcl13 or empty vector control (n = 6 mice per group from two experiments). j, GC B cell quantification in lungs from KPAR-challenged mice treated with intranasal plasmid encoding Cxcl13 or empty vector control (n = 6 mice per group from two experiments). k, Survival of KPAR-challenged mice treated with intranasal plasmid encoding Cxcl13 or empty vector control (n = 12 mice per group from two experiments). l, Survival of KPAR-challenged mice treated with anti-PD-L1 and Cxcl13 or isotype and empty vector controls (n = 12 mice per group from two experiments). Data in b,c,f,hj are represented as mean ± s.e.m. P values were calculated by two-sided Mann–Whitney rank-sum test in b, two-sided Student’s t test in c,i,j, one-way ANOVA on ranks with Tukey correction for multiple comparisons among the three treatment groups in h and log-rank test in e,g,k,l. Source data
Fig. 4
Fig. 4. Anti-HERV antibodies in patients with LUAD and LUSC.
a, Expression of ERVK-7 in transcripts per million (TPM) in TCGA LUAD (n = 419) and LUSC (n = 362) samples and GTEx healthy lung samples (n = 36) (left) and in TRACERx LUAD (n = 170), LUSC (n = 112) and adjacent normal tissue (n = 78) samples (right). For TRACERx patients, tumour values represent the average expression of all individual tumour regions. b, Expression of ERVK-7 in multiregion samples from TRACERx patients with LUAD (n = 63 patients with data available for at least three regions). Filled symbols and the dashed line represent individual paired normal lung tissue samples and average expression in all normal lung tissue samples, respectively. c, Quantification by flow cytometry of HERV-K(HML-2) and ERV3-1 envelope-binding antibodies in plasma or serum from TRACERx patients with LUAD (n = 52) and LUSC (n = 24) and in CAPTURE patients with LUAD (n = 28). Specific MFI increase values over control cells are denoted by the scale. d,e, Correlation of HERV-K(HML-2) envelope-reactive IgG titres and ERVK-7 mRNA expression (n = 47) (d) and ERVK-7 mRNA expression in TRACERx patients with LUAD with (HERV-K(HML-2) IgG+, n = 25) and without (HERV-K(HML-2) IgG, n = 22) HERV-K(HML-2) envelope-reactive antibodies (e). f,g, Correlation of HERV-K(HML-2) envelope-reactive IgG titres and ploidy-adjusted ERVK-7 copy number (n = 53) (f) and ploidy-adjusted ERVK-7 copy number in TRACERx patients with LUAD with (HERV-K(HML-2) IgG+, n = 23) and without (HERV-K(HML-2) IgG, n = 30) HERV-K(HML-2) envelope-reactive antibodies (g). The y axis represents the maximum copy number in individual tumour regions for each patient. Symbols in a and b represent individual patients and individual regions, respectively, and P values were calculated by one-way ANOVA on ranks with Dunn’s correction for multiple comparisons in a and two-sided Mann–Whitney rank-sum test in e,g; R and P values were calculated using linear regression in d,f. Source data
Fig. 5
Fig. 5. HERV-K(HML-2)-reactive antibodies in patients with LUAD.
a, Frequency of all heavy (H) and light (L) chain BCR CDR3 rearrangements in tumour region 1 and paired normal lung tissue from TRACERx patient CRUK0035 with LUAD. b, Heavy and light chain frequencies of the 103-K7 clonotype, a non-class-switched (non-CS) and non-somatically hypermutated (non-SH) precursor, and a class-switched and non-somatically hypermutated precursor, in three separate tumour regions (TR1–TR3), a lymph node metastasis (LN1) and paired normal lung tissue (N) from patient CRUK0035. ce, A549 binding (c) and A549 ADCC (d,e) of plasma from TRACERx patients with LUAD with (IgG+, n = 23) or without (IgG, n = 41) HERV-K(HML-2) envelope-reactive antibodies without (d) or with (c,e) addition of recombinant ERVK-7 envelope protein or IAV hemagglutinin (IAV HA). f, HERV-K(HML-2) and ERV3-1 envelope-reactive IgG titres in individual patients with LUAD before and during ICB (grey), according to time after surgery (day 0) (dashed horizontal lines, detection limit; DFS, disease-free survival; OS, overall survival). g, ERVK-7 mRNA levels in SMC patients with LUAD according to ICB therapy response. h, Progression-free and overall survival of SMC patients with LUAD following ICB, according to pre-treatment ERVK-7 expression levels. i, Overall survival hazard ratios (HRs) for the indicated variables in SMC patients with LUAD following ICB therapy (CTx, chemotherapy). Error bars in i represent 95% confidence intervals (CIs). Symbols in cg represent individual patients, and lines in c and e connect values from the same patient. P values were calculated by Wilcoxon signed-rank test in c, two-sided Student’s t test in d, two-sided paired Student’s t test in e, two-sided Mann–Whitney rank-sum test in g, log-rank test in h and Cox proportional hazards regression in i. Source data
Extended Data Fig. 1
Extended Data Fig. 1. TLS formation in murine LUAD models.
a, Immunohistochemistry for B220, Ki67, and CD8 in KPB6 and KPAR lungs, with inset KPAR TLS shown at higher magnification. Representative images of 10 individual mice from the same experiment. b, Staining with peanut agglutinin (PNA) in KPB6 and KPAR lungs. Representative images of 10 and 4 individual mice from the same experiment for KPB6 and KPAR tumours, respectively. c, Correlation between GC B and TFH cells in naïve and KPAR lungs, from Fig. 1d (n = 12 per group from 3 experiments). R and p values were calculated using linear regression. d, Quantification by flow cytometry of B220+GL7+CD95+ GC B cells and TCRβ+CD4+PD1+CXCR5+ TFH cells in KPB6 and KPAR lungs (n = 6 per group from 2 experiments). Data are represented as mean ± s.e.m. and p values were calculated using two-sided Student’s t-tests. e, Labelling efficiency of GC B cells in AicdaCreERT2;Rosa26LSL-EYFP mice (n = 6). Tamoxifen was administered 1 and 3 days prior to analysis. f, Time course quantification by flow cytometry of B220+fluorophore+ (IghgCre fate-mapped) or TCRβ+CD4+PD1+CXCR5+ TFH cells in KPAR lungs in IghgCre;Rosa26LSL-Confetti mice (n = 4 per time point). Source data
Extended Data Fig. 2
Extended Data Fig. 2. Antibody responses in murine LUAD models.
a, Quantification by flow cytometry of KPAR-binding IgM, IgG, and IgA from naïve (n = 6) or KPAR (n = 6) serum. The dotted line denotes the mean staining intensity of naïve sera per antibody isotype. Data are represented as mean ± s.e.m. of individual mice from the same experiment (symbols) and p values were calculated using two-sided Student’s t-tests. b, Quantification of KPAR-binding IgM, IgG, and IgA from KPB6 (n = 6) or KPAR (n = 6) serum. The dotted line denotes the mean staining intensity of naïve sera per antibody isotype. Data are represented as mean ± s.e.m. of individual mice from the same experiment (symbols) and p values were calculated using two-sided Student’s t-tests. c, Survival of KPB6 recipient mice treated with pooled serum from KPAR (n = 8) or PBS mock-injected naïve (n = 8) donor mice. d, Survival of KPAR recipient mice treated with pooled serum from KPB6 (n = 8) or PBS mock-injected naïve (n = 8) donor mice. e, Quantification of KPAR cell death following treatment with naïve or KPAR sera with or without heat inactivation (n = 3 per group from 1 experiment). Data are represented as mean ± s.e.m. and p values were calculated using two-sided Student’s t-tests. f, Representative scatter plots of KPAR, EL4, and 3LL cells stained with isotype (red), 83A25 (blue), or KPAR sera (orange). g, Detection by flow cytometry of ERV envelope glycoprotein on M. dunni and M. dunni.KARV cell lines using the 83A25 antibody. Source data
Extended Data Fig. 3
Extended Data Fig. 3. Effect of ICB on T cell-dependent B cell responses.
a, Quantification by flow cytometry of B220+GL7+CD95+ GC B cells or TCRβ+CD4+PD1+CXCR5+ TFH cells in the spleens of anti-PD-L1 (n = 6) and isotype (n = 6) treated SRBC-immunised mice. Data are represented as mean ± s.e.m. and p values were calculated using two-sided Student’s t-tests between isotype and anti-PD-L1 treatments. b, Quantification of germinal centre number and size by PNA immunohistochemistry in anti-PD-L1 and isotype SRBC spleens (n = 6 per group from 1 experiment). Data are represented as mean ± s.e.m. and p values were calculated using two-sided Student’s t-tests. c, Quantification by flow cytometry of B220+GL7+CD95+ GC B cells or TCRβ+CD4+PD1+CXCR5+ TFH cells in the spleens of anti-PD-L1 (n = 3), anti CTLA-4 (n = 3) and isotype (n = 3) treated SRBC-immunised mice. Data are represented as mean ± s.e.m. and p values were calculated using one-way ANOVA with Bonferroni correction for multiple comparisons. Source data
Extended Data Fig. 4
Extended Data Fig. 4. Effect of ICB on KPAR antibody responses.
a, Quantification by flow cytometry of B220+GL7+CD95+ GC B cells or TCRβ+CD4+PD1+CXCR5+ TFH cells in KPAR lungs treated with anti-PD-1 (n = 6), anti-CTLA-4 (n = 6), or isotype control (n = 6). Data are represented as mean ± s.e.m. and p values were calculated using one-way ANOVA with Bonferroni correction for multiple comparisons. b, Serum antibody off-rate of anti-PD-L1 and isotype KPAR sera (n = 5 mice per group from 1 experiment) incubated at 37 °C with KPAR cells for the denoted time. Data are represented as mean ± s.e.m. and p values were calculated using two-way ANOVA. c, Quantification of PD-L1-binding antibodies in anti-PD-L1 and isotype sera (n = 6 mice per group from 1 experiment) prior to serum transfer. Purified 10F.9G2 anti-PD-L1 monoclonal antibody is used as a positive control. d, Quantification by flow cytometry of M. dunni.KARV-binding IgM, IgG, and IgA from anti-PD-L1 (n = 6) and isotype control (n = 6) sera. The dotted line denotes the mean staining intensity of naïve sera per antibody isotype. Data are represented as mean ± s.e.m. and p values were calculated using two-sided Student’s t-tests. e, Coomassie stain of KPAR lysate immunoprecipitated with J1KK monoclonal or IgA isotype control. Peptides mapping to MLV envelope surface unit (SU) are denoted in alignment with the SU of the Emv2 envelope glycoprotein. f, Quantification of KPAR cell death following treatment with J1KK monoclonal or IgA isotype control and naïve sera. Data are represented as mean ± s.e.m. of technical triplicate measurements in a single experiment. Source data
Extended Data Fig. 5
Extended Data Fig. 5. Effect of MEK or CXCL13 inhibition on B cell responses.
a, Quantification by flow cytometry of B220+GL7+CD95+ GC B cells or TCRβ+CD4+PD1+CXCR5+ TFH cells in the spleens of SRBC-immunised mice treated with MEKi (n = 6), G12Ci (n = 6), or vehicle (n = 6) daily starting 4 days post SRBC immunisation for an additional 4 days. Data are represented as mean ± s.e.m. and p values were calculated using one-way ANOVA with Bonferroni correction for multiple comparisons. b, Quantification of GC B cells or TFH cells in MEKi (n = 4), G12Ci (n = 4), and vehicle (n = 4)-treated KPAR lungs. Data are represented as mean ± s.e.m. and p values were calculated using one-way ANOVA with Bonferroni correction for multiple comparisons. c, Quantification by flow cytometry of KPAR-binding IgM, IgG, and IgA from MEKi (n = 4), G12Ci (n = 4), and vehicle (n = 4)-treated KPAR serum. The dotted line denotes the mean staining intensity of naïve sera per antibody isotype. Data are represented as mean ± s.e.m. and p values were calculated using one-way ANOVA with Bonferroni correction for multiple comparisons for IgG and one-way ANOVA on Ranks with Tukey correction for multiple comparisons for IgA. d, Serum antibody off-rate of MEKi (n = 6), G12Ci (n = 6), and vehicle (n = 5) KPAR serum incubated at 37 °C with KPAR cells for the denoted time. Mice in bd were treated with inhibitors or vehicle control daily for 5 days following detection of tumours. Data are represented as mean ± s.e.m. e, Quantification by flow cytometry of B220+GL7+CD95+ GC B cells in KPAR lungs and draining lymph nodes (dLN) following treatment with anti-PD-L1, anti-CD20, anti-CXCL13, or isotype controls (n = 9 per group from 2 experiments). Data are represented as mean ± s.e.m. and p values were calculated using one-way ANOVA on Ranks with Tukey correction for multiple comparisons. f, Survival of KPAR mice treated with anti-CD20, anti-CXCL13, or isotype control as monotherapy (n = 8 per group from 2 experiments). Source data
Extended Data Fig. 6
Extended Data Fig. 6. B cell and TLS signatures, and TLS histology in patients with LUAD.
a, Quantification of TLS and Danaher B cell geneset scores, unique productive BCR CDR3 amino acid sequences, frequency of IgG class-switched BCR sequences, and CXCL13 expression in transcripts per million (TPM) in TRACERx LUAD and LUSC patients. Symbols represent the average value of individual tumour regions or of adjacent normal lung tissue, and numbers below the plots indicate the number of patients. P values were calculated using one-way ANOVA on Ranks with Dunn’s correction for multiple comparisons. b, Comparison of TLS geneset and Danaher B cell scores in paired TRACERx LUAD (n = 49 pairs) and LUSC (n = 27 pairs) samples and adjacent normal tissue samples. Symbols represent individual patients and p values were calculated using two-sided paired Student’s t-tests, except for Danaher B cell score in LUAD for which a Wilcoxon Signed Rank test was used. c, Correlation of TLS geneset and Danaher B cell scores with tumour purity in tumour regions from TRACERx LUAD (n = 166 patients, 406 regions) and LUSC patients (n = 111 patients, 272 regions). Symbols represent individual regions and R and p values were calculated using linear regression. d, Representative image (top) of TLS (arrows, scale bar 250 µm) and quantification of TLS in TRACERx LUAD (n = 165) and LUSC (n = 108) patients (bottom). Source data
Extended Data Fig. 7
Extended Data Fig. 7. B cell signatures in LUAD patients.
a, Kaplan-Meier plots depicting disease-free survival of TRACERx LUAD and LUSC patients stratified by median expression of CD79A, CD19, MS4A1 or CXCL13 (n = 85 vs 85 for LUAD; n = 56 vs 56 for LUSC). P values were calculated using Log-rank tests. b, Overall survival of TCGA LUAD and LUSC patients stratified by median expression of CD79A, CD19, or MS4A1 (n = 123 vs 123 for LUAD; n = 122 vs 122 for LUSC). P values were calculated using Log-rank tests. Source data
Extended Data Fig. 8
Extended Data Fig. 8. Association of CXCL13 with survival in human cancer.
a, Overall survival of TCGA patients stratified by expression of CXCL13 by median (n = 123 vs 123 for LUAD, 122 vs 122 for LUSC, 114 vs 114 for SKCM, 64 vs 64 for SARC, 43 vs 43 for PAAD, 90 vs 90 for LIHC, 38 vs 38 for GBM, 135 vs 135 for UCEC, 124 vs 124 for HNSC, 130 vs 130 for KIRC, 71 vs 71 for KIRP). P values were calculated using Log-rank tests. b, CXCL13 mRNA expression in transcripts per million (TPM) in TCGA samples (n = 492 for LUAD, 488 for LUSC, 458 for SKCM, 258 for SARC, 174 for PAAD, 360 for LIHC, 152 for GBM, 540 for UCEC, 496 for HNSC, 522 for KIRC, 284 for KIRP). Black lines denote mean expression. c, Spearman’s correlation matrix of the indicated B cell-specific genes, CXCL13 and TLS geneset scores and Danaher scores for B cells, CD8+ T cells and NK cells in TRACERx LUAD (n = 170). All correlations were significant (p < 0.05). Source data
Extended Data Fig. 9
Extended Data Fig. 9. Association of B cell signatures with mutation status in TRACERx.
a, Correlation of TLS geneset and Danaher B cell scores, unique productive BCR CDR3 amino acid sequences, and frequency of IgG class-switched BCR sequences with total tumour mutational burden (mutations per megabase) in tumour regions (n = 170 patients, 420 regions) from TRACERx LUAD patients. Symbols represent individual regions and R and p values were calculated using linear regression. Calculated p values for unique CDR3s and IgG frequency correlations with total tumour mutational burden were 0.0188 and 0.000887, respectively, using a linear mixed effects (LME) model that corrected for smoking status and patient random effects. b, TLS geneset and Danaher B cell scores in tumour regions (n = 170 patients, 420 regions) from TRACERx LUAD patients according to patient smoking status (never-smoked, n = 32 regions; ex-smoker, n = 215 regions; smoker, n = 173 regions), TP53 mutation status (wild-type, n = 217 regions; truncal, n = 168 regions; subclonal, n = 35 regions), EGFR mutation status (wild-type, n = 378 regions; truncal, n = 41 regions; subclonal, n = 1 region), or KRAS mutation status (wild-type, n = 227 regions; truncal, n = 177 regions; subclonal, n = 16 regions). Symbols represent individual regions and p values were calculated using one-way ANOVA on Ranks with Tukey correction for multiple comparisons. Source data
Extended Data Fig. 10
Extended Data Fig. 10. Envelope codogenic HERV expression in healthy and malignant tissues.
a, Heatmap of expression of envelope codogenic HERVs in TCGA and TRACERx LUAD and LUSC samples. For TRACERx patients, columns represent average expression of all individual tumour regions. b, Expression in TPM of ERVK-7, ERV3-1, and ERVMER34-1 in TCGA (n = 24 per cancer type) and GTEx (n = 2–156 per tissue type). Box plots denote median value and quartiles, whiskers denote 1.5x the interquartile range, and individual points denote outliers.
Extended Data Fig. 11
Extended Data Fig. 11. Correlates of ERVK-7 expression and HERV-K(HML-2) envelope glycoprotein expression in LUAD.
a, Correlation of ERVK-7 expression with Danaher geneset scores for immune cells denoted in TRACERx LUAD patients (n = 167). Correlation co-efficient and p values were calculated using linear regression. b, Representative staining intensities for HERV-K(HML-2) envelope glycoprotein in TRACERx LUAD tumour microarray sections (scale bars 500µm; inset scale bars 50 µm). c, Correlation of ERVK-7 expression with global methylation (n = 311 patients) or SOX2 expression in FPKM-UQ (Fragments Per Kilobase of transcript per Million mapped reads upper quartile) (n = 407 patients) in TCGA LUAD samples. Symbols represent individual patients and R and p values were calculated using linear regression. d, Correlation of ERVK-7 expression with ploidy-adjusted ERVK-7 proviral copy numbers in tumour regions (n = 158 patients, 393 regions) from TRACERx LUAD patients (left) or with the average copy number of the ERVK-7 genomic location in TCGA LUAD patients (n = 407 patients) (right). Symbols represent individual regions for TRACERx LUAD and individual patients for TCGA LUAD samples, and R and p values were calculated using linear regression. e, Heatmap of expression of envelope codogenic HERVs in SMC LUAD samples. f, Correlation of ERVK-7 expression with CD8+ T cell scores in SMC LUAD samples. Symbols represent individual patients and R and p values were calculated using linear regression. Source data
Extended Data Fig. 12
Extended Data Fig. 12. Flow cytometry gating strategies.
a, Example of gating for the identification of mouse GC B cells (B220+GL7+CD95+) and TFH cells (CD4+TCRβ+PD-1+CXCR5+) in the immune cell (CD45+) fraction. This gating strategy was used for the enumeration of GC B cells and TFH cells in Fig. 1d,e, Fig. 2f,h, Fig. 3c,j, and Extended Data Figs. 1d, e, 3a,c, 4a, and 5a,b,e. b, Example of gating for the identification of HEK293T (GFP-negative), HEK293T.ERV3-1env (GFP-low) and HEK293T.HERV-K(HML-2)env cells (GFP-high), mixed in equal ratios for the antibody binding assay. The bottom panel depicts examples of HERV-K(HML-2) envelope-reactive antibody negative (HERV-K(HML-2) IgG) and positive (HERV-K(HML-2) IgG+) samples. This gating strategy was used for the quantitation of ERV3-1 and HERV-K(HML-2) reactive antibodies in Fig. 4c–g and Fig. 5f.

Comment in

References

    1. Schumacher TN, Thommen DS. Tertiary lymphoid structures in cancer. Science. 2022;375:eabf9419. doi: 10.1126/science.abf9419. - DOI - PubMed
    1. Laumont CM, Banville AC, Gilardi M, Hollern DP, Nelson BH. Tumour-infiltrating B cells: immunological mechanisms, clinical impact and therapeutic opportunities. Nat. Rev. Cancer. 2022;22:414–430. doi: 10.1038/s41568-022-00466-1. - DOI - PMC - PubMed
    1. Boumelha J, et al. An immunogenic model of KRAS-mutant lung cancer enables evaluation of targeted therapy and immunotherapy combinations. Cancer Res. 2022;82:3435–3448. doi: 10.1158/0008-5472.CAN-22-0325. - DOI - PMC - PubMed
    1. Hellmann MD, et al. Nivolumab plus ipilimumab in advanced non-small-cell lung cancer. N. Engl. J. Med. 2019;381:2020–2031. doi: 10.1056/NEJMoa1910231. - DOI - PubMed
    1. Patil NS, et al. Intratumoral plasma cells predict outcomes to PD-L1 blockade in non-small cell lung cancer. Cancer Cell. 2022;40:289–300. doi: 10.1016/j.ccell.2022.02.002. - DOI - PubMed

Publication types

MeSH terms

Associated data