. 2023 Apr;616(7957):525-533.
doi: 10.1038/s41586-023-05783-5. Epub 2023 Apr 12.

The evolution of lung cancer and impact of subclonal selection in TRACERx

Alexander M Frankell #  1   2 Michelle Dietzen #  1   2   3 Maise Al Bakir #  1   2 Emilia L Lim #  1   2 Takahiro Karasaki #  1   2   4 Sophia Ward #  1   2   5 Selvaraju Veeriah #  2 Emma Colliver #  1 Ariana Huebner #  1   2   3 Abigail Bunkum #  2   4   6 Mark S Hill  1 Kristiana Grigoriadis  1   2   3 David A Moore  1   2   7 James R M Black  2   3 Wing Kin Liu  2   4 Kerstin Thol  2   3 Oriol Pich  1 Thomas B K Watkins  1 Cristina Naceur-Lombardelli  2 Daniel E Cook  1 Roberto Salgado  8   9 Gareth A Wilson  1 Chris Bailey  1 Mihaela Angelova  1 Robert Bentham  2   3 Carlos Martínez-Ruiz  2   3 Christopher Abbosh  2 Andrew G Nicholson  10   11 John Le Quesne  12   13   14 Dhruva Biswas  1   2   15 Rachel Rosenthal  1 Clare Puttick  1   2   3 Sonya Hessey  2   4   6 Claudia Lee  1   2   16 Paulina Prymas  2 Antonia Toncheva  2 Jon Smith  17 Wei Xing  17 Jerome Nicod  5 Gillian Price  18   19 Keith M Kerr  19   20 Babu Naidu  21   22 Gary Middleton  22   23 Kevin G Blyth  12   13   24 Dean A Fennell  25   26 Martin D Forster  2   27 Siow Ming Lee  2   27 Mary Falzon  7 Madeleine Hewish  28   29 Michael J Shackcloth  30 Eric Lim  31   32 Sarah Benafif  27 Peter Russell  33 Ekaterini Boleti  34 Matthew G Krebs  35 Jason F Lester  36 Dionysis Papadatos-Pastos  27 Tanya Ahmad  27 Ricky M Thakrar  37   38 David Lawrence  39 Neal Navani  37   38 Sam M Janes  38 Caroline Dive  40   41 Fiona H Blackhall  35 Yvonne Summers  35 Judith Cave  42 Teresa Marafioti  7 Javier Herrero  15 Sergio A Quezada  2   43 Karl S Peggs  44   45 Roland F Schwarz  46   47 Peter Van Loo  48   49   50 Daniël M Miedema  51   52 Nicolai J Birkbak  1   2   53   54   55 Crispin T Hiley  1   2 Allan Hackshaw  56 Simone Zaccaria  2   6 TRACERx ConsortiumMariam Jamal-Hanjani  57   58   59 Nicholas McGranahan  60   61 Charles Swanton  62   63   64
Collaborators, Affiliations

The evolution of lung cancer and impact of subclonal selection in TRACERx

Alexander M Frankell et al. Nature. 2023 Apr.

Erratum in

  • Author Correction: The evolution of lung cancer and impact of subclonal selection in TRACERx.
    Frankell AM, Dietzen M, Al Bakir M, Lim EL, Karasaki T, Ward S, Veeriah S, Colliver E, Huebner A, Bunkum A, Hill MS, Grigoriadis K, Moore DA, Black JRM, Liu WK, Thol K, Pich O, Watkins TBK, Naceur-Lombardelli C, Cook DE, Salgado R, Wilson GA, Bailey C, Angelova M, Bentham R, Martínez-Ruiz C, Abbosh C, Nicholson AG, Le Quesne J, Biswas D, Rosenthal R, Puttick C, Hessey S, Lee C, Prymas P, Toncheva A, Smith J, Xing W, Nicod J, Price G, Kerr KM, Naidu B, Middleton G, Blyth KG, Fennell DA, Forster MD, Lee SM, Falzon M, Hewish M, Shackcloth MJ, Lim E, Benafif S, Russell P, Boleti E, Krebs MG, Lester JF, Papadatos-Pastos D, Ahmad T, Thakrar RM, Lawrence D, Navani N, Janes SM, Dive C, Blackhall FH, Summers Y, Cave J, Marafioti T, Herrero J, Quezada SA, Peggs KS, Schwarz RF, Van Loo P, Miedema DM, Birkbak NJ, Hiley CT, Hackshaw A, Zaccaria S; TRACERx Consortium; Jamal-Hanjani M, McGranahan N, Swanton C. Frankell AM, et al. Nature. 2024 Jul;631(8022):E15. doi: 10.1038/s41586-024-07738-w. Nature. 2024. PMID: 38965439 Free PMC article. No abstract available.

Abstract

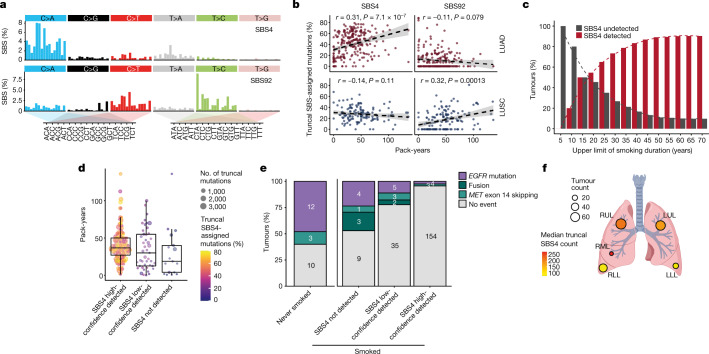
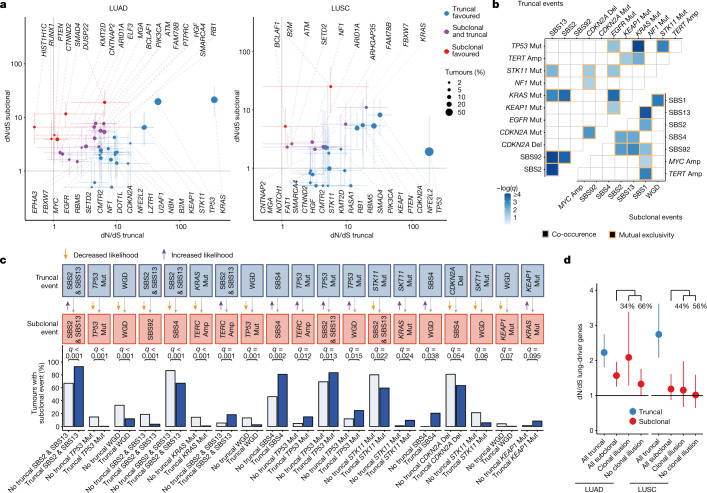
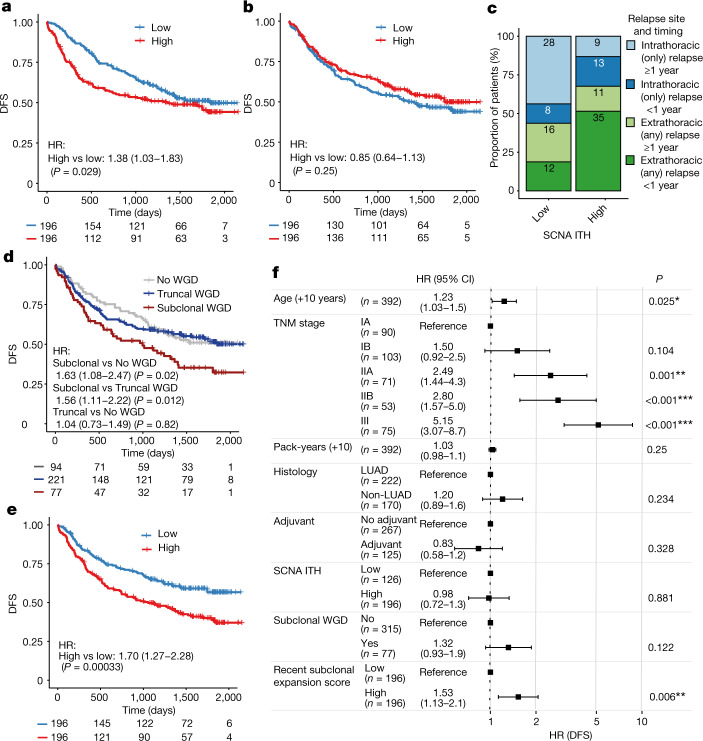
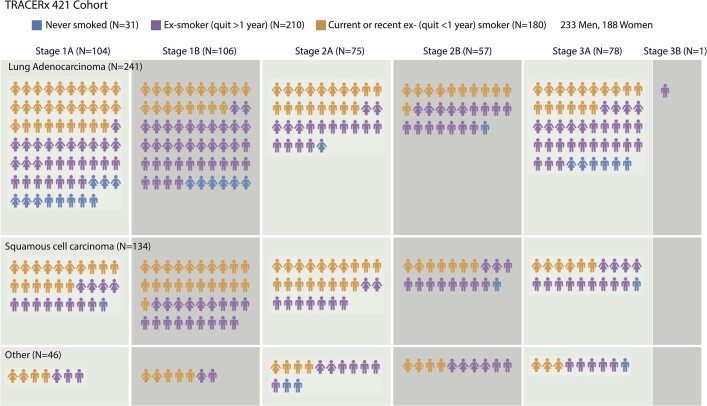
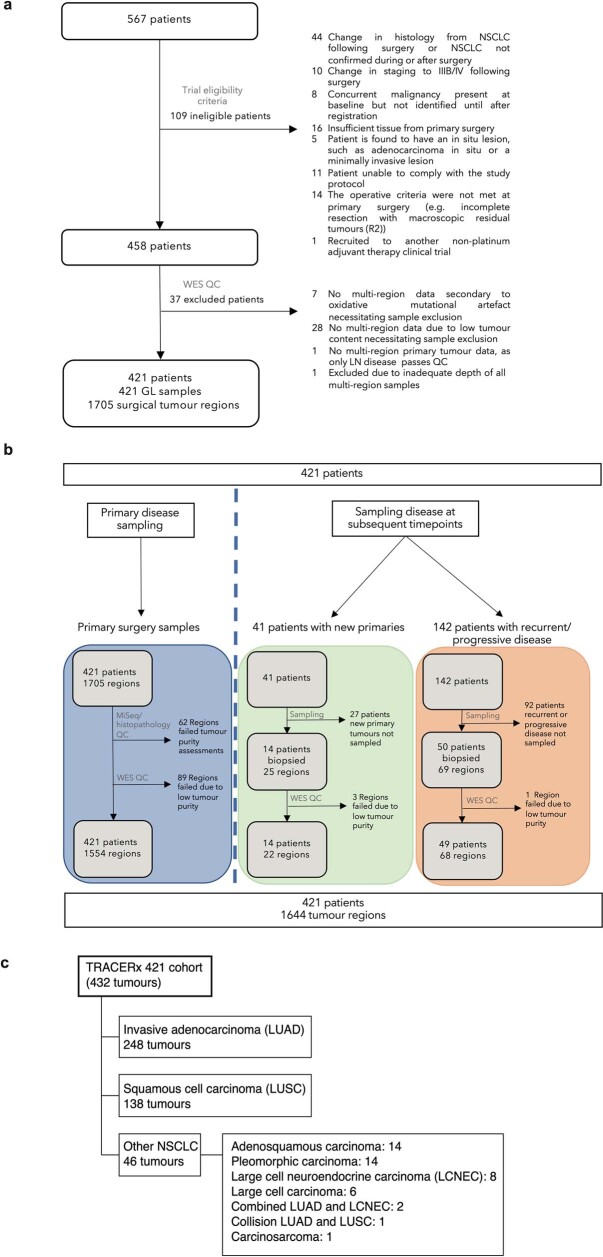
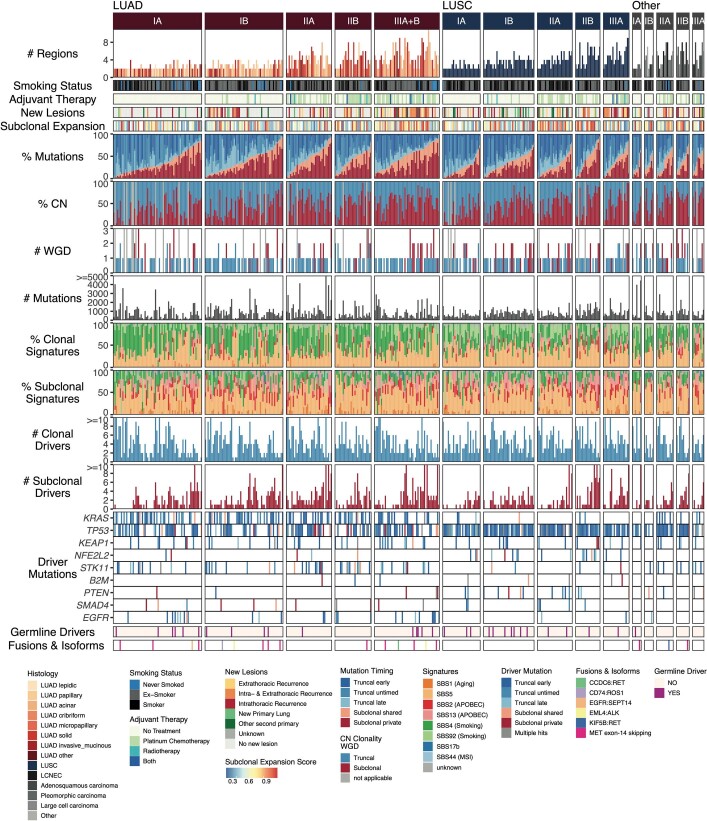
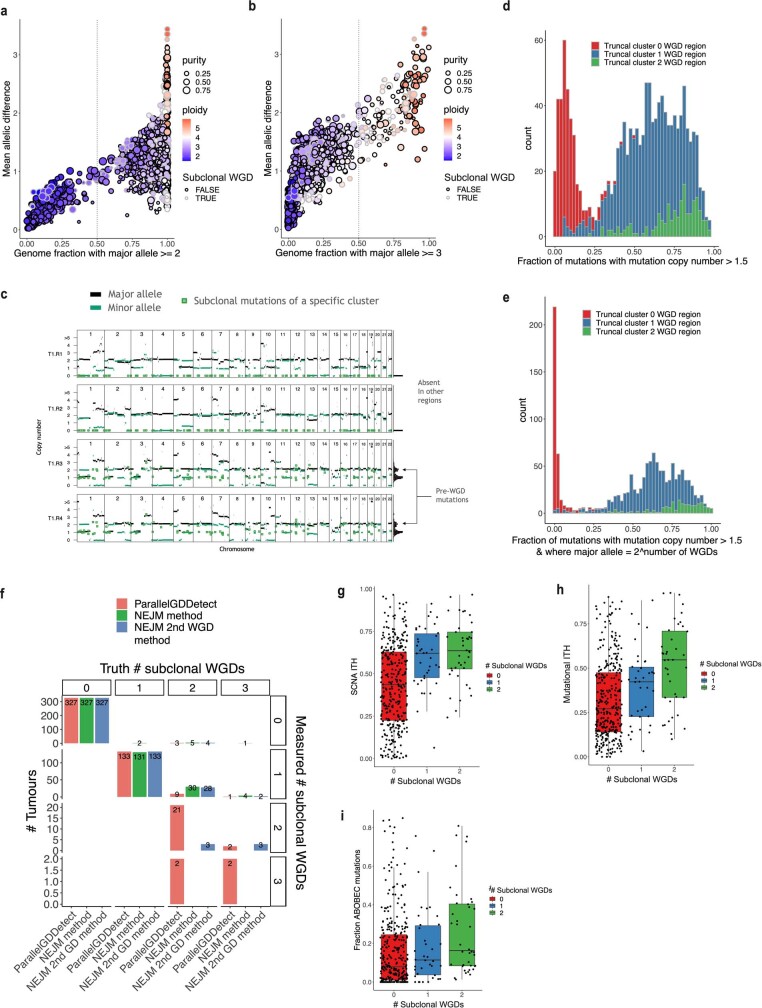
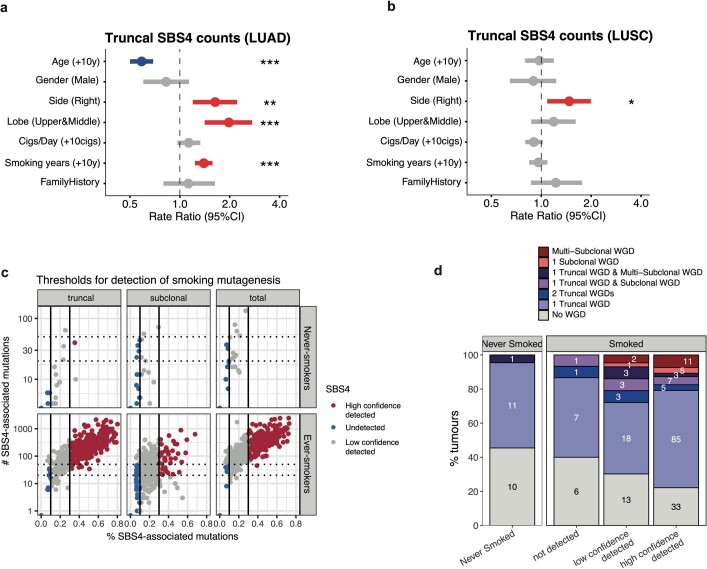
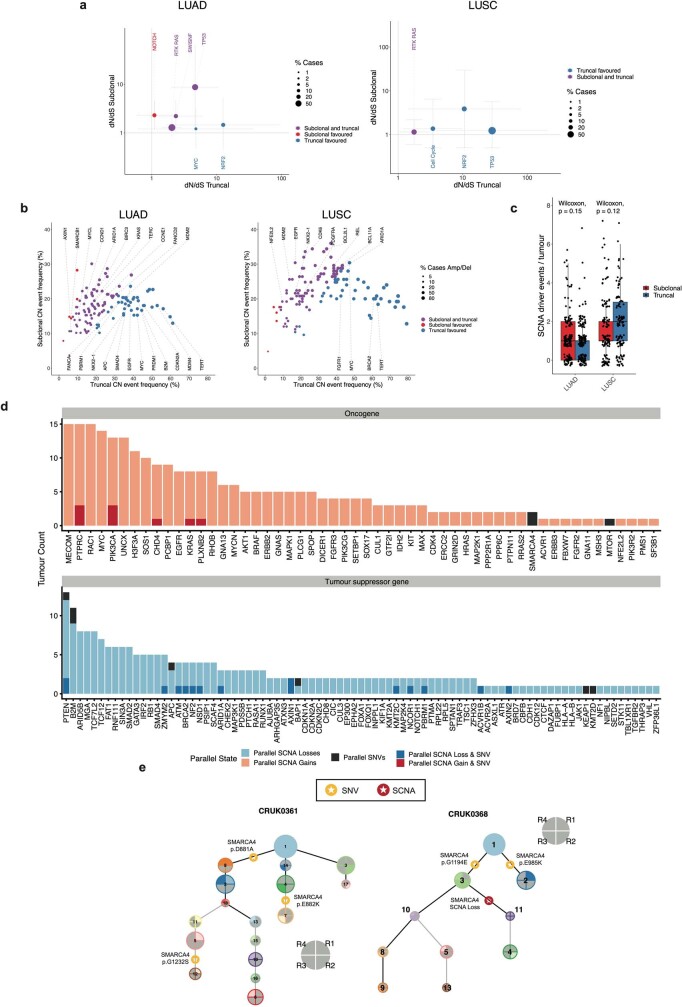
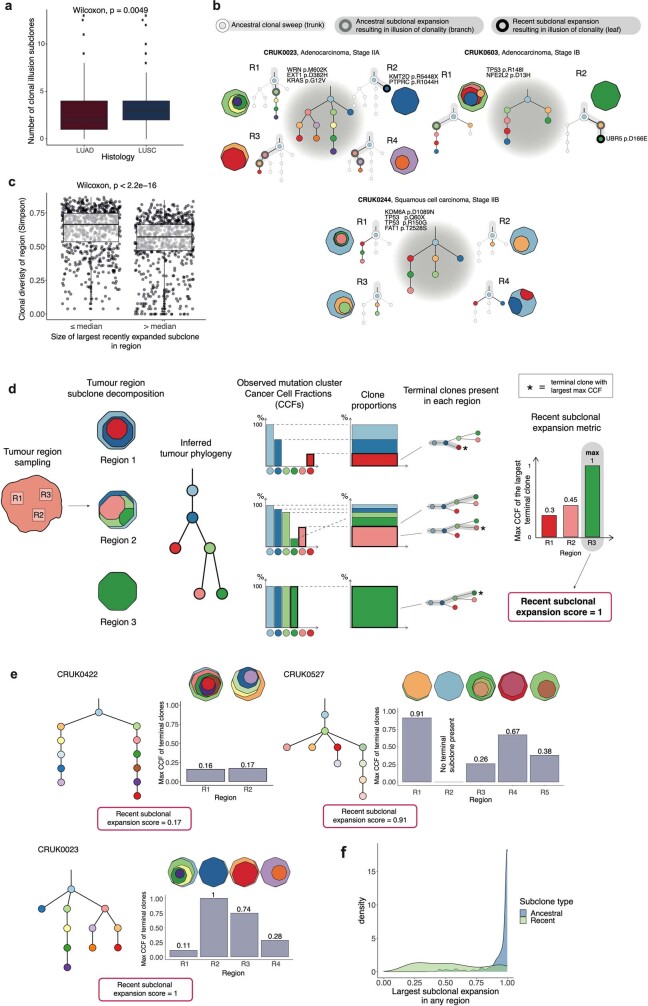
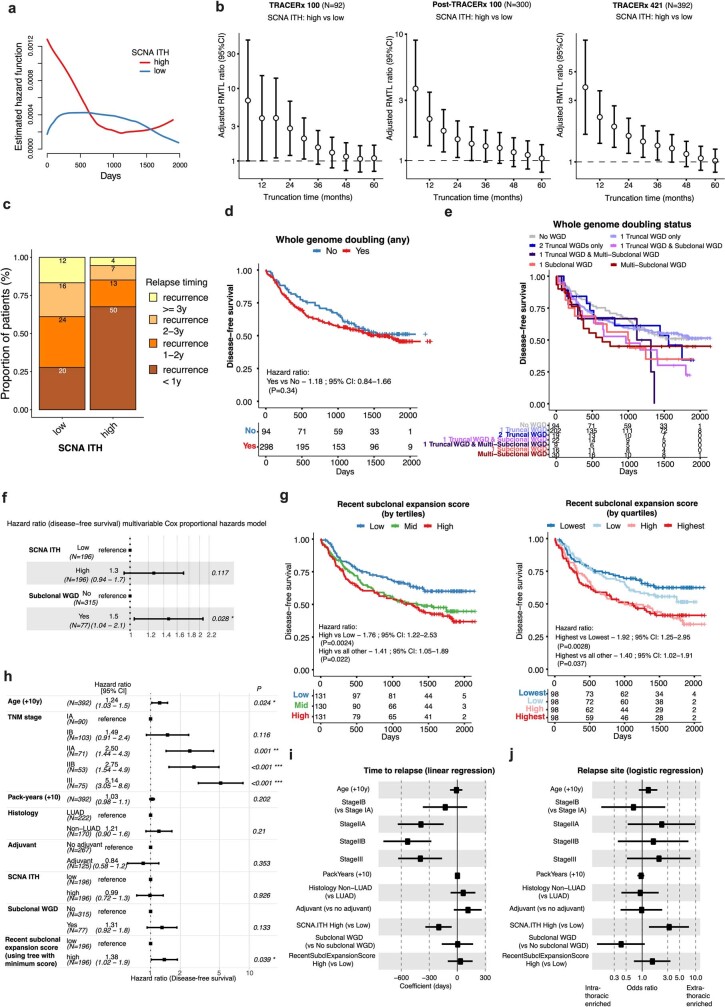
Lung cancer is the leading cause of cancer-associated mortality worldwide1. Here we analysed 1,644 tumour regions sampled at surgery or during follow-up from the first 421 patients with non-small cell lung cancer prospectively enrolled into the TRACERx study. This project aims to decipher lung cancer evolution and address the primary study endpoint: determining the relationship between intratumour heterogeneity and clinical outcome. In lung adenocarcinoma, mutations in 22 out of 40 common cancer genes were under significant subclonal selection, including classical tumour initiators such as TP53 and KRAS. We defined evolutionary dependencies between drivers, mutational processes and whole genome doubling (WGD) events. Despite patients having a history of smoking, 8% of lung adenocarcinomas lacked evidence of tobacco-induced mutagenesis. These tumours also had similar detection rates for EGFR mutations and for RET, ROS1, ALK and MET oncogenic isoforms compared with tumours in never-smokers, which suggests that they have a similar aetiology and pathogenesis. Large subclonal expansions were associated with positive subclonal selection. Patients with tumours harbouring recent subclonal expansions, on the terminus of a phylogenetic branch, had significantly shorter disease-free survival. Subclonal WGD was detected in 19% of tumours, and 10% of tumours harboured multiple subclonal WGDs in parallel. Subclonal, but not truncal, WGD was associated with shorter disease-free survival. Copy number heterogeneity was associated with extrathoracic relapse within 1 year after surgery. These data demonstrate the importance of clonal expansion, WGD and copy number instability in determining the timing and patterns of relapse in non-small cell lung cancer and provide a comprehensive clinical cancer evolutionary data resource.

Trial registration: ClinicalTrials.gov NCT01888601.


Conflict of interest statement

A.M.F. is a co-inventor on a patent application to determine methods and systems for tumour monitoring (PCT/EP2022/077987). M.A.B. has consulted for Achilles Therapeutics. D.A.M. reports speaker fees from AstraZeneca, Eli Lilly and Takeda, consultancy fees from AstraZeneca, Thermo Fisher, Takeda, Amgen, Janssen, MIM Software, Bristol-Myers Squibb (BMS) and Eli Lilly and has received educational support from Takeda and Amgen. S.V. is a co-inventor on a patent to detect molecules in a sample (US patent 10578620). G.A.W. is employed by and has stock options in Achilles Therapeutics. R.S. reports non-financial support from Merck and BMS, research support from Merck, Puma Biotechnology and Roche, and personal fees from Roche, BMS and Exact Sciences for advisory boards. C.A. has received speaking honoraria or expenses from Novartis, Roche, AstraZeneca and BMS and reports employment at AstraZeneca. C.A. is an inventor on a European patent application relating to assay technology to detect tumour recurrence (PCT/GB2017/053289); the patent has been licensed to commercial entities and under their terms of employment, C.A. is due a revenue share of any revenue generated from such licence(s). C.A. declares a patent application (PCT/US2017/028013) for methods to detect lung cancer. C.A. is a named inventor on a patent application to determine methods and systems for tumour monitoring (PCT/EP2022/077987). C.A. is a named inventor on a provisional patent protection related to a ctDNA detection algorithm. D.B. reports personal fees from NanoString and AstraZeneca. He has a patent (PCT/GB2020/050221) issued on methods for cancer prognostication. R.R. is an employee of and has stock options in Achilles Therapeutics and holds a European patent on targeting neoantigens (PCT/EP2016/059401) and in determining HLA LOH (PCT/GB2018/052004). D.A.F. reports grants from Aldeyra, Boehringer Ingelheim, Astex Therapeutics, Bayer, BMS, GSK, RS Oncology, Clovis, Eli Lilly, MSD, GSK, personal fees from Atara, BMS, Boehringer Ingelheim, Cambridge Clinical Laboratories, Targovax, Roche and RS Oncology. M.D.F. acknowledges grant support from CRUK, AstraZeneca, Boehringer Ingelheim, MSD and Merck; is an advisory board member for Transgene; and has consulted for Achilles, Amgen, AstraZeneca, Bayer, Boxer, BMS, Celgene, EQRx, Guardant Health, Immutep, Ixogen, Janssen, Merck, MSD, Nanobiotix, Novartis, Oxford VacMedix, Pharmamar, Pfizer, Roche, Takeda and UltraHuman. K.S.P. is a co-founder of Achilles Therapeutics. S.A.Q. is a co-founder, stockholder and Chief Scientific Officer of Achilles Therapeutics. E.L. has received funding from AstraZeneca, Boehringer Ingelheim, Medela, Johnson & Johnson/Ethicon, Covidien/Medtronic, Guardant Health, Takeda, Lilly Oncology, Boehringer Ingelheim and Bayer. E.L. has received consulting fees from Beigene, Roche and BMS, honoraria from Medela and is a founder My Cancer Companion, Healthcare Companion Ltd. N.N. reports honoraria for non-promotional educational talks, advisory boards or conference attendance from Amgen, AstraZeneca, Boehringer Ingelheim, BMS, Fujifilm, Guardant Health, Intuitive, Janssen, Lilly, Merck Sharp & Dohme, Olympus, OncLive, PeerVoice, Pfizer and Takeda. S.M.J. has received fees for advisory board membership in the past 3 years from AstraZeneca, Bard1 Lifescience and Johnson & Johnson. He has received a grant income from Owlstone and GRAIL Inc. He has received assistance with travel to an academic meeting from Cheisi. C.D. has received research funding and educational research grants from AstraZeneca, Astex Pharmaceuticals, Bioven, Amgen, Carrick Therapeutics, Merck, Taiho Oncology, GSK, Bayer, Boehringer Ingelheim, Roche, BMS, Novartis, Celgene, Epigene Therapeutics, Angle PLC, Menarini, Clearbridge Biomedics, Thermo Fisher Scientific and Neomed Therapeutics. C.D. has also received honoraria for consultancy and/or advisory boards from Biocartis, Merck, AstraZeneca, GRAIL and Boehringer Ingelheim. J.C. reports funding from Amgen to attend a conference. A. Hackshaw has received fees for being a member of Independent Data Monitoring Committees for Roche-sponsored clinical trials, and academic projects co-ordinated by Roche. N.J.B. is a co-inventor on a patent to identify responders to cancer treatment (PCT/GB2018/051912), has a patent application (PCT/GB2020/050221) on methods for cancer prognostication and is a co-inventor on a patent for methods for predicting anticancer responses (US14/466,208). C.T.H. has received speaker fees from AstraZeneca. M.J.-H. has consulted for and is a member of the Achilles Therapeutics Scientific Advisory Board (SAB) and Steering Committee, has received speaker honoraria from Pfizer, Astex Pharmaceuticals, Oslo Cancer Cluster, and holds a patent (PCT/US2017/028013) relating to methods for lung cancer detection. This patent has been licensed to commercial entities and under terms of employment, M.J.-H. is due a share of any revenue generated from such licence(s). N.M. has received consultancy fees and has stock options in Achilles Therapeutics. N.M. holds European patents relating to targeting neoantigens (PCT/EP2016/059401), identifying patient response to immune checkpoint blockade (PCT/EP2016/071471), determining HLA LOH (PCT/GB2018/052004) and predicting survival rates of patients with cancer (PCT/GB2020/050221). C.S. acknowledges grant support from AstraZeneca, Boehringer-Ingelheim, BMS, Pfizer, Roche-Ventana, Invitae (previously Archer Dx (collaboration in minimal residual disease sequencing technologies)) and Ono Pharmaceutical. C.S. is an AstraZeneca Advisory Board member and Chief Investigator for the AZ MeRmaiD 1 and 2 clinical trials and is also Co-Chief Investigator of the NHS Galleri trial funded by GRAIL and a paid member of GRAIL’s SAB. He receives consultant fees from Achilles Therapeutics (also a SAB member), Bicycle Therapeutics (also a SAB member), Genentech, Medicxi, Roche Innovation Centre–Shanghai, Metabomed (until July 2022), and the Sarah Cannon Research Institute. C.S. had stock options in Apogen Biotechnologies and GRAIL until June 2021, and currently has stock options in Epic Bioscience, Bicycle Therapeutics, and has stock options and is co-founder of Achilles Therapeutics. C.S. is an inventor on a European patent application relating to an assay technology to detect tumour recurrence (PCT/GB2017/053289), the patent has been licensed to commercial entities and under his terms of employment, C.S. is due a revenue share of any revenue generated from such licence(s). C.S. holds patents relating to targeting neoantigens (PCT/EP2016/059401), identifying patient responses to immune checkpoint blockade (PCT/EP2016/071471), determining HLA LOH (PCT/GB2018/052004), predicting survival rates of patients with cancer (PCT/GB2020/050221), identifying patients who respond to cancer treatment (PCT/GB2018/051912), a US patent relating to detecting tumour mutations (PCT/US2017/28013), methods for lung cancer detection (US20190106751A1) and both a European and US patent related to identifying indel mutation targets (PCT/GB2018/051892) and is a co-inventor on a patent application to determine methods and systems for tumour monitoring (PCT/EP2022/077987). C.S. is a named inventor on a provisional patent related to a ctDNA detection algorithm.

Figures

Fig. 1
Fig. 1. Longitudinal patient timelines for the TRACERx 421 cohort.
The timing of clinical events including treatment, relapse or detection of a new primary and either time of death or latest follow-up is depicted for the 421 patients enrolled into the TRACERx study. Patients are arranged by histology and the presence or absence of a new lesion detected during follow-up. CRUK identifiers are coloured on the basis of whether the patient did not develop a new lesion after surgery (black) or if the first event after surgery was classified as recurrence (dark grey) or a new primary tumour (light grey). The overall patient stage at surgery and smoking status is depicted alongside metrics of ITH measured using multiregion WES of surgically excised samples including mutational ITH (the fraction of subclonal mutations), SCNA ITH (the fraction of the aberrant genome with subclonal SCNAs) and the estimated number of truncal and subclonal WGDs using our method ParallelGDDetect.
Fig. 2
Fig. 2. Clinical and physiological determinants of SBS4-associated mutagenesis in NSCLC.
a, Signature profiles of SBS4 and SBS92 as reported using COSMIC (v.3.2). b, The correlation between smoking-mediated mutations (SBS4 and SBS92) and pack-years in 386 LUAD and LUSC tumours from patients with a smoking history. Pearson’s correlation tests were used. c, Cumulative percentage of all LUAD tumours with SBS4 detection or lack of SBS4 detection with increasing maximum years smoked. A total of 223 tumours were analysed. d, Comparison of pack-years between patients with LUAD with different SBS4 detection statuses in their tumour. A total of 215 patients were included. Each data point represents a patient with LUAD and an ever-smoker. e, The percentage of LUAD tumours harbouring EGFR mutations, RET–ROS1ALK oncogenic fusions and MET exon-skipping events in patients who never smoked and in patients who have smoked split by SBS4 detection status. A total of 248 tumours were included. f, Frequency of tumours in the TRACERx 421 cohort located in each lung lobe and the median number of truncal SBS4-associated mutations for tumours located in each lung lobe. A total of 358 LUAD and LUSC tumours from ever-smokers were included. LLL, left lower lobe; LUL, left upper lobe; RML, right middle lobe; RLL, right lower lobe; RUL, right upper lobe. The schematic in f was created using BioRender (https://biorender.com).
Fig. 3
Fig. 3. Timing of selection and evolutionary dependencies.
a, Gene-level selection in point mutations measured using dN/dS ratios comparing truncal and subclonal mutations in LUAD and LUSC with 95% CIs for dN/dS ratios for 358 tumours. Error bars indicate 95% CIs. dN/dS values below 0.5 and associated with 95% CIs overlapping 1 are limited to 0.5. b, Mutual exclusivity and co-occurrence relationships among driver gene mutations, SCNAs and signatures between 401 tumours in the TRACERx cohort of 421 patients for both truncal and subclonal contexts using DISCOVER. c, Ordering interactions found in the TRACERx 421 cohort in which the presence of a truncal event modifies the probability of a given subclonal event downstream using 401 tumours. d, Comparisons of the overall amount of selection in point mutations of lung-cancer-driver genes in LUAD and LUSC using dN/dS, considering all truncal mutations, all subclonal mutations and subsets of subclonal mutations with and without an illusion of clonality using 358 tumours. The percentage of subclonal mutations with and without clonal illusion in LUAD and LUSC is displayed. Amp, amplification; Del, deletion; Mut, mutation.
Fig. 4
Fig. 4. Associations between ITH and prognosis in the TRACERx 421 cohort.
a, The difference in DFS between 392 patients harbouring tumours with greater or less than the median value of SCNA ITH; that is, the fraction of the aberrant genome with subclonal SCNAs (Methods). The number of patients at risk in each group is indicated below each timepoint. b, The difference in DFS between 392 patients harbouring tumours with greater or less than the median value of mutational ITH; that is, the percentage of mutations which are subclonal (Methods). c, Proportions of intrathoracic only versus extrathoracic metastatic sites in 132 patients that relapsed either <1 year or ≥1 year after diagnosis split by SCNA ITH status. d, The difference in DFS in 392 patients harbouring tumours with different WGD statuses. e, The difference in DFS between 392 patients harbouring tumours with greater or less than the median value of the recent subclonal expansion score (Methods). f, A multivariable Cox proportional hazards model including subclonal WGD, SCNA ITH, recent subclonal expansion score and other clinical variables that are known to have an impact on outcome for 392 patients (Methods). HR 95% CIs are indicated in parentheses. Asterisks indicate P value ranges: *P < 0.05, **P < 0.01, ***P < 0.001. Error bars indicate 95% CIs.
Extended Data Fig. 1
Extended Data Fig. 1. A demographic and clinical overview of the TRACERx 421 cohort.
The sex, histology, stage and smoking status are depicted for 421 patients from the TRACERx cohort. For lung cancer cases with multiple primary tumours, the most advanced tumour and its stage are indicated. In cases where synchronous primary lung tumours were identified in a patient, the tumour with the most advanced stage is represented.
Extended Data Fig. 2
Extended Data Fig. 2. CONSORT diagram and histology of the TRACERx 421 cohort.
a. CONSORT diagram for the assembly of the TRACERx 421 cohort. 567 patients were recruited to the TRACERx study, 109 of whom were excluded due to subsequent changes to their clinical status, most commonly due to reclassification of histology at surgery. A further 37 patients were excluded due to sample quality control after whole exome sequencing, either due to sample purity or artefact signature contamination. b. A summary of samples removed during quality control. c. Summary of major histologies across 432 genomically analysed tumours.
Extended Data Fig. 3
Extended Data Fig. 3. Reclassification of shared origins using genomics to inform clinical decision making.
a. A flow diagram indicating histological and genomic classifications of shared ancestry of multiple lesions sampled at surgery. Grey boxes indicate genomically confirmed synchronous multiple primary lung cancers. Blue boxes indicates clinically histologically diagnosed synchronous multiple primary lung cancers for which fresh tumour sampling of one of the tumours was undertaken. Orange boxes indicate genomically identified collision tumours that were diagnosed as single tumours histologically. b. A flow diagram indicating histological and genomic classifications of shared ancestry between tumours sampled at surgery and during follow-up. Pink boxes indicate recurrence of the primary tumour. Green boxes indicate a second primary lung cancer. Yellow boxes indicate a second primary cancer of non-lung origin. Origins of 183 tumours identified during follow up are described.
Extended Data Fig. 4
Extended Data Fig. 4. Benchmarking the new phylogenetic reconstruction method and comparison with existing approaches.
a. Simulation of tree topology. b. Simulation of genetic events occurring on each edge of the phylogenetic tree. c. Simulating multiple heterogeneous tumour samples from the genetic events in the tree phylogeny. d. Simulating the resulting DNA sequencing data from the heterogeneous tumour samples. e. Every row represents a different evaluation metric measuring the performance of the new computational method for tumour phylogenetic reconstruction (blue) and four existing approaches (Pyclone in orange, LICHeE in green, CITUP in red, and PhyloWGS in purple) when applied to 150 simulated datasets separated into three groups according to the number of tumour samples: 2-3 samples in the low category (left), 4-7 samples in the medium category (middle), and >7 samples in the high category (right). The first row demonstrates the number of datasets for which each method was able to successfully reconstruct a tumour phylogenetic tree (solid colour indicates successful completion, hatched colour indicates that a method was unable to reconstruct a phylogenetic tree and striped colour represents that the method failed to complete within a time limit of 8 h). The second row represents the Adjusted Rand index (ARI) of mutation clustering which measures the identification of mutations belonging to the same tumour clone. The third row represents the mutation presence precision which evaluates the proportion of mutations identified as present in a sample that are truly present. The last row represents the ancestral relationship accuracy which measures the proportion of mutation pairs for which the correct phylogenetic relationship has been retrieved. Every dot refers to a different simulated dataset. Box plots show the median and the interquartile range (IQR), and the whiskers denote the lowest and highest values within 1.5 times the IQR from the first and third quartiles, respectively.
Extended Data Fig. 5
Extended Data Fig. 5. Overview of number of regions sampled, stage, treatment and ITH metrics including mutational ITH, SCNA ITH and whole genome doubling status for 432 tumours from 421 patients in TRACERx.
Each tumour is arranged vertically ordered first by pathological stage then by fraction of subclonal subclonal mutations. LCNEC = Large cell neuroendocrine carcinoma, CN = copy number.
Extended Data Fig. 6
Extended Data Fig. 6. Benchmarking of ParallelGDDetect for detection of parallel subclonal whole genome doubling (WGD).
a. A scatter diagram displaying for each tumour region between the fraction of the genome with major copy number of at least 2; the mean allelic difference; the ploidy; purity; and subclonal WGD status (determined using heterogeneity of ploidies). b. An identical scatter diagram depicting the fraction of the genome with at least a major copy number of 3. c. An example of a subclonal mutation cluster present in two whole genome doubled regions which contains mutations at copy number ~2 in areas of the genome without gains, indicating that these mutations occurred before the whole genome doubling event (pre-WGD) in these regions, but is absent in other whole genome doubled regions. d. A stacked histogram indicating the number of regions with truncal clusters harbouring different fractions of mutations with estimated mutation copy number >1.5, split by regions estimated to harbour 0, 1 or 2 WGD events. e. A stacked histogram indicating the number of regions with truncal clusters harbouring different fractions of mutations with estimated mutation copy number >1.5, restricting to genomic regions where the major copy number was equal to 2^(number of WGD events in that region), split by regions estimated to harbour 0, 1 or 2 WGD events. f. Benchmarking of ParallelGDDetect in 500 simulated tumours where 460/460 tumours lacking multiple subclonal WGDs were correctly classified (100% specificity & sensitivity) and 27/40 tumours which harboured multiple subclonal WGDs were correctly classified (68% specificity). g. An association between SCNA ITH and the number of subclonal WGD events. h. An association between mutational ITH and the number of subclonal WGD events. i. An association between the fraction of subclonal mutations attributable to APOBEC mutagenesis (SBS2/SBS13) and the number of subclonal WGD events.
Extended Data Fig. 7
Extended Data Fig. 7. Smoking mutagenesis in LUAD and LUSC.
The association between clinical features and truncal SBS4 counts for 233 LUADs in 217 ever-smoker patients (a) and 135 LUSCs in 135 ever-smoker patients (b). These are the results of two generalised linear models with negative binomial error structure using the truncal SBS4 count as the response variable and a set of clinical features as explanatory variables. Rate ratios are presented with 95% confidence intervals on a logarithmic scale. Red bars indicate the positive association with truncal SBS4 mutations and blue bars indicate the negative association. Asterisks indicate P value ranges * P < 0.05, ** P < 0.01, *** P < 0.001. c. Scatter plot of SBS4 weights versus counts for 432 tumours split by those in either ever-smokers or never-smokers highlighting the thresholds used to identify tumours with no significant smoking mutagenesis detected. Tumours with a truncal estimated SBS4 weight less than 0.1 and fewer than 50 truncal SBS4-assigned mutations were defined as SBS4 undetected, whereas tumours with an estimated truncal SBS4 weight greater than 0.3 and more than 20 truncal SBS4-assigned mutations were considered as having a high confidence SBS4 detection. Tumours that didn’t meet either of these criteria were considered to have low confidence SBS4 detection. d. The fraction of LUAD tumours harbouring different whole genome doubling statuses as determined by ParallelGDDetect in patients who never smoked, and in patients who have smoked split by SBS4 detection status. Data from 229 LUADs where WGD statuses could be resolved are shown.
Extended Data Fig. 8
Extended Data Fig. 8. Extended analysis of selection, parallel subclonal events within tumour phylogenies and frequency of SCNA drivers.
a. Pathway level dN/dS analysis in LUAD and lung LUSC from 358 tumours (Methods). b. Frequency of amplification and deletion events in significantly amplified or deleted loci identified by GISTIC2.0 in 358 tumours (Methods). c. Overall frequency of amplifications and deletions in significantly amplified or deleted loci identified by GISTIC2.0 and containing known drivers in LUAD and LUSC per tumour across 358 tumours shown using box and whisker plots (Methods). Wilcoxon-test P values are shown. d. Barplots indicate for each oncogene (top) and tumour suppressor gene (bottom) the number of tumours where a parallel evolution event was observed. Pale red and blue bars indicate where a somatic copy number alteration (SCNA) (gain or loss) was observed multiple times in the same gene and in parallel in the same tumour. Dark red and blue bars indicate where an SCNA (gain/loss) was observed in parallel with a single nucleotide variant (SNV) in the same gene and in the same tumour. Black bars indicate where SNVs in the same gene were observed multiple times in the same tumour and in parallel. e. Examples of parallel events in SMARCA4. In CRUK0361 and CRUK0368 we noted multiple independent mutations in SMARCA4. These are indicated with yellow stars. In each case, the mutations can be mapped to branches of the tumour’s phylogenetic tree that do not overlap, indicating that these mutations had arisen in parallel. In the case of CRUK0368, a copy number loss was also observed. This is indicated by a red star. A more complete description of tree schematics is available in the Methods section. R = Region; CN = Copy number.
Extended Data Fig. 9
Extended Data Fig. 9. A summary of regional diversity and the recent subclonal expansion score.
a. The variation in regional diversity across all tumour regions in the TRACERx 421 cohort in lung adenocarcinoma (LUAD) compared to lung squamous cell carcinoma (LUSC). b. Examples of subclonal expansions with illusion of clonality which contain subclonal driver mutations in three tumours. c. Differences in clonal diversity between regions which have large (> median) or small (<= median) recently expanded subclones (subclones on a terminal node of the phylogenetic tree). d. An infographic describing how the recent subclonal expansion score is calculated. For each tumour region, the maximum terminal node phylogenetic cancer cell fraction (PhyloCCF, Methods) is computed. The tumour recent subclonal expansion score is subsequently taken as the maximum regional subclonal expansion score. e. Examples of recent subclonal expansion score in three tumours: CRUK0422, CRUK0527 and CRUK0023. f. Density plot of the PhyloCCF of the largest subclonal expansion in any region of a tumour, for ancestral subclones and recent (terminal) subclones.
Extended Data Fig. 10
Extended Data Fig. 10. Additional analyses of ITH and the relapse risk.
a. Hazard function plot against time for SCNA ITH. Cross-over of hazard function is observed between 1 to 2 years during follow-up. b. A restricted mean survival time-lost (RMTL) analysis of disease-free survival (DFS) to estimate the impact of SCNA ITH on DFS over different time periods in the TRACERx 100 cohort (left, 92 patients included), post-TRACERx 100 cohort (middle, 300 patients included), and the whole TRACERx 421 cohort (right, 392 patients included). RMTL ratios are adjusted for age, pack-years, stage, histology, and adjuvant treatment status. c. Proportions of the timing of relapse (<1 year, 1-2 years, 2-3 years, ≥3years) in patients who developed recurrence during the follow-up for 146 relapse patients. d. The difference in DFS between tumours with any whole genome doubling (WGD) (truncal and/or subclonal WGD) versus no WGD for 392 patients. e. The difference in DFS among tumours with different WGD statuses stratified by the number of truncal and subclonal WGDs for 392 patients. f. A multivariable Cox proportional hazards model to predict disease free survival (DFS) including subclonal WGD and SCNA ITH for 392 patients. g. The difference in DFS among tumours stratified by the recent subclonal expansion score using tertiles (left) and quartiles (right) for 392 patients. h. A multivariable Cox proportional hazards model including subclonal WGD, SCNA ITH, minimum recent clonal expansion score of all possible reconstructed phylogenetic trees, and other clinical variables which are known to impact on patient outcome for 392 patients. i. A multivariable linear regression model including subclonal WGD, SCNA ITH, recent clonal expansion score and other clinical variables to predict the time to relapse within patients who relapsed for 133 patients. j. A multivariable logistic regression model including subclonal WGD, SCNA ITH, recent clonal expansion score and other clinical variables to predict the relapse site (extra-thoracic vs only intra-thoracic) for patients with known relapse sites for 132 patients.

Comment in

References

    1. Sung H, et al. Global Cancer Statistics 2020: GLOBOCAN estimates of incidence and mortality worldwide for 36 cancers in 185 countries. CA Cancer J. Clin. 2021;71:209–249. doi: 10.3322/caac.21660. - DOI - PubMed
    1. Gerlinger M, et al. Intratumor heterogeneity and branched evolution revealed by multiregion sequencing. N. Engl. J. Med. 2012;366:883–892. doi: 10.1056/NEJMoa1113205. - DOI - PMC - PubMed
    1. Jamal-Hanjani M, et al. Tracking the evolution of non–small-cell lung cancer. N. Engl. J. Med. 2017;376:2109–2121. doi: 10.1056/NEJMoa1616288. - DOI - PubMed
    1. Turajlic S, et al. Deterministic evolutionary trajectories influence primary tumor growth: TRACERx Renal. Cell. 2018;173:595–610.e11. doi: 10.1016/j.cell.2018.03.043. - DOI - PMC - PubMed
    1. Ciriello G, et al. Emerging landscape of oncogenic signatures across human cancers. Nat. Genet. 2013;45:1127–1133. doi: 10.1038/ng.2762. - DOI - PMC - PubMed

Publication types

Associated data