

Splicing complexity as a pivotal feature of alternative exons in mammalian species
- PMID: 37046221
- PMCID: PMC10099729
- DOI: 10.1186/s12864-023-09247-y
Splicing complexity as a pivotal feature of alternative exons in mammalian species
Abstract
Background: As a significant process of post-transcriptional gene expression regulation in eukaryotic cells, alternative splicing (AS) of exons greatly contributes to the complexity of the transcriptome and indirectly enriches the protein repertoires. A large number of studies have focused on the splicing inclusion of alternative exons and have revealed the roles of AS in organ development and maturation. Notably, AS takes place through a change in the relative abundance of the transcript isoforms produced by a single gene, meaning that exons can have complex splicing patterns. However, the commonly used percent spliced-in (Ψ) values only define the usage rate of exons, but lose information about the complexity of exons' linkage pattern. To date, the extent and functional consequence of splicing complexity of alternative exons in development and evolution is poorly understood.
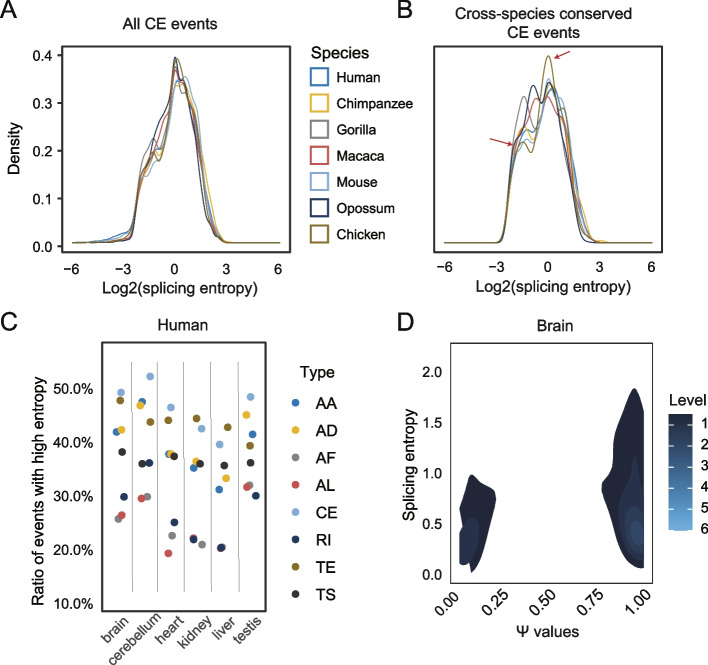
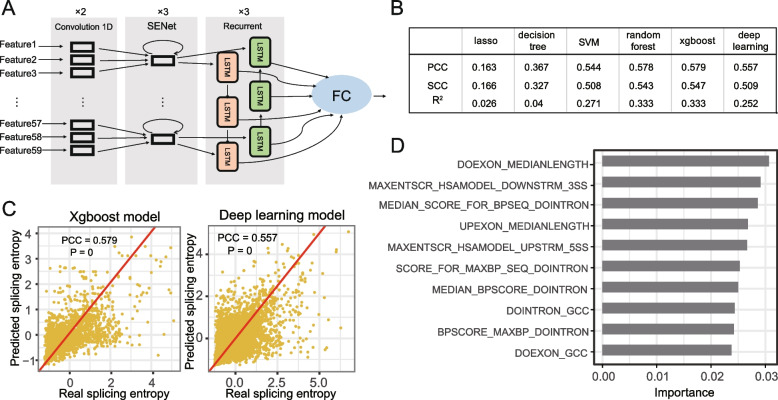
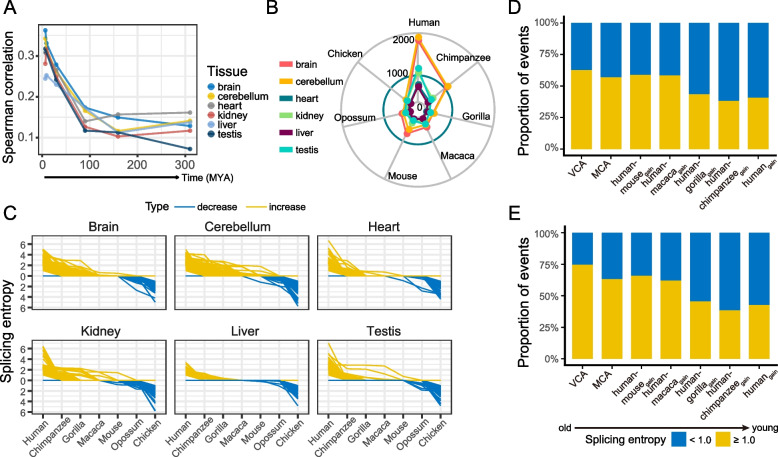
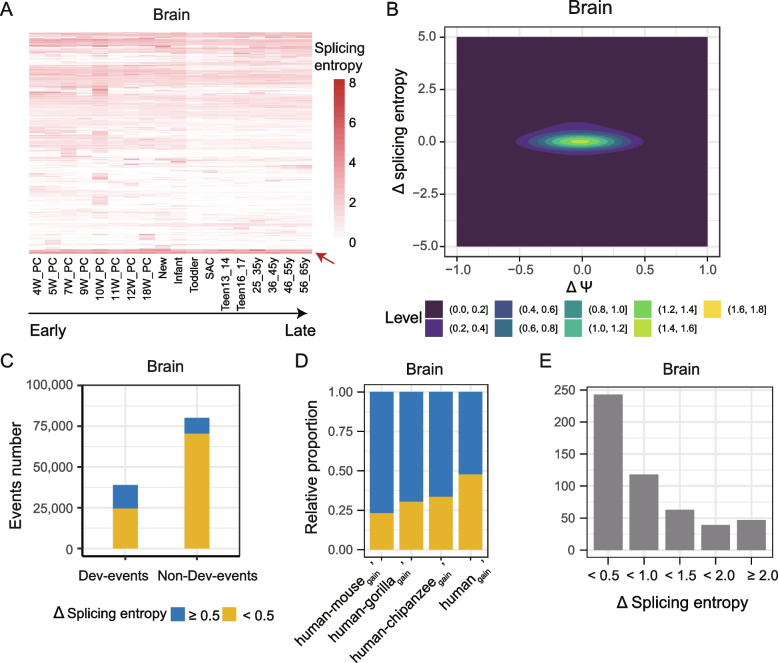
Results: By comparing splicing complexity of exons in six tissues (brain, cerebellum, heart, liver, kidney, and testis) from six mammalian species (human, chimpanzee, gorilla, macaque, mouse, opossum) and an outgroup species (chicken), we revealed that exons with high splicing complexity are prevalent in mammals and are closely related to features of genes. Using traditional machine learning and deep learning methods, we found that the splicing complexity of exons can be moderately predicted with features derived from exons, among which length of flanking exons and splicing strength of downstream/upstream splice sites are top predictors. Comparative analysis among human, chimpanzee, gorilla, macaque, and mouse revealed that, alternative exons tend to evolve to an increased level of splicing complexity and higher tissue specificity in splicing complexity. During organ development, not only developmentally regulated exons, but also 10-15% of non-developmentally regulated exons show dynamic splicing complexity.
Conclusions: Our analysis revealed that splicing complexity is an important metric to characterize the splicing dynamics of alternative exons during the development and evolution of mammals.
Keywords: Alternative splicing; Development and evolution; Machine learning; Splicing complexity.
© 2023. The Author(s).
Conflict of interest statement
The authors declare no competing interests.
Figures


Similar articles
-
Comprehensive splicing graph analysis of alternative splicing patterns in chicken, compared to human and mouse.BMC Genomics. 2009 Jul 7;10 Suppl 1(Suppl 1):S5. doi: 10.1186/1471-2164-10-S1-S5. BMC Genomics. 2009. PMID: 19594882 Free PMC article.
-
Tau gene (MAPT) sequence variation among primates.Gene. 2004 Oct 27;341:313-22. doi: 10.1016/j.gene.2004.07.013. Gene. 2004. PMID: 15474313
-
Unusual intron conservation near tissue-regulated exons found by splicing microarrays.PLoS Comput Biol. 2006 Jan;2(1):e4. doi: 10.1371/journal.pcbi.0020004. Epub 2006 Jan 20. PLoS Comput Biol. 2006. PMID: 16424921 Free PMC article.
-
Alternative Splicing May Not Be the Key to Proteome Complexity.Trends Biochem Sci. 2017 Feb;42(2):98-110. doi: 10.1016/j.tibs.2016.08.008. Epub 2016 Oct 3. Trends Biochem Sci. 2017. PMID: 27712956 Free PMC article. Review.
-
Global impact of RNA splicing on transcriptome remodeling in the heart.J Zhejiang Univ Sci B. 2012 Aug;13(8):603-8. doi: 10.1631/jzus.B1201006. J Zhejiang Univ Sci B. 2012. PMID: 22843179 Free PMC article. Review.
Cited by
-
Interplays between cis- and trans-Acting Factors for Alternative Splicing in Response to Environmental Changes during Biological Invasions of Ascidians.Int J Mol Sci. 2023 Oct 5;24(19):14921. doi: 10.3390/ijms241914921. Int J Mol Sci. 2023. PMID: 37834365 Free PMC article.
-
Deciphering the Gene Expression and Alternative Splicing Basis of Muscle Development Through Interpretable Machine Learning Models.Biology (Basel). 2025 Aug 15;14(8):1059. doi: 10.3390/biology14081059. Biology (Basel). 2025. PMID: 40906371 Free PMC article.
-
Unraveling the Intricacies of Powdery Mildew: Insights into Colonization, Plant Defense Mechanisms, and Future Strategies.Int J Mol Sci. 2025 Apr 9;26(8):3513. doi: 10.3390/ijms26083513. Int J Mol Sci. 2025. PMID: 40331988 Free PMC article. Review.
-
Exon Nomenclature And Classification of Transcripts (ENACT) provides a systematic framework to annotate exon attributes.Genome Res. 2025 Jun 2;35(6):1440-1455. doi: 10.1101/gr.279878.124. Genome Res. 2025. PMID: 40335152
-
Roles of human SPATA3 in cell proliferation and expression pattern of Spata3 in mouse testis.Mol Med Rep. 2025 Sep;32(3):255. doi: 10.3892/mmr.2025.13620. Epub 2025 Jul 11. Mol Med Rep. 2025. PMID: 40641118 Free PMC article.
References
-
- Beqqali A, Bollen IA, Rasmussen TB, van den Hoogenhof MM, van Deutekom HW, Schafer S, Haas J, Meder B, Sorensen KE, van Oort RJ, et al. A mutation in the glutamate-rich region of RNA-binding motif protein 20 causes dilated cardiomyopathy through missplicing of titin and impaired Frank-Starling mechanism. Cardiovasc Res. 2016;112:452–463. doi: 10.1093/cvr/cvw192. - DOI - PubMed
MeSH terms
Substances
LinkOut - more resources
Full Text Sources
Research Materials
