. 2023 Apr 12;18(1):80.
doi: 10.1186/s13023-023-02687-5.

Alpha-lipoic acid supplementation corrects pathological alterations in cellular models of pantothenate kinase-associated neurodegeneration with residual PANK2 expression levels

Affiliations

Alpha-lipoic acid supplementation corrects pathological alterations in cellular models of pantothenate kinase-associated neurodegeneration with residual PANK2 expression levels

Marta Talaverón-Rey et al. Orphanet J Rare Dis. .

Abstract

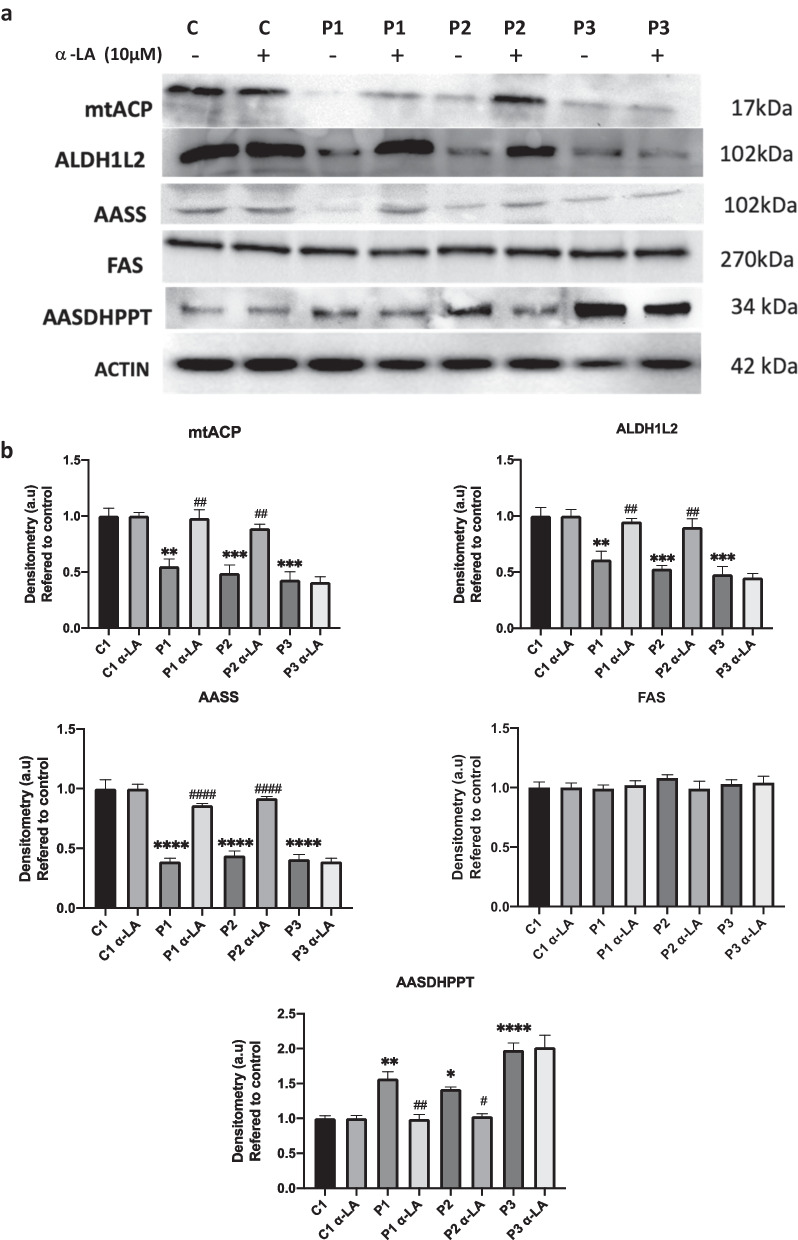
Background: Neurodegeneration with brain iron accumulation (NBIA) disorders are a group of neurodegenerative diseases that have in common the accumulation of iron in the basal nuclei of the brain which are essential components of the extrapyramidal system. Frequent symptoms are progressive spasticity, dystonia, muscle rigidity, neuropsychiatric symptoms, and retinal degeneration or optic nerve atrophy. One of the most prevalent subtypes of NBIA is Pantothenate kinase-associated neurodegeneration (PKAN). It is caused by pathogenic variants in the gene of pantothenate kinase 2 (PANK2) which encodes the enzyme responsible for the first reaction on the coenzyme A (CoA) biosynthesis pathway. Thus, deficient PANK2 activity induces CoA deficiency as well as low expression levels of 4'-phosphopantetheinyl proteins which are essential for mitochondrial metabolism.

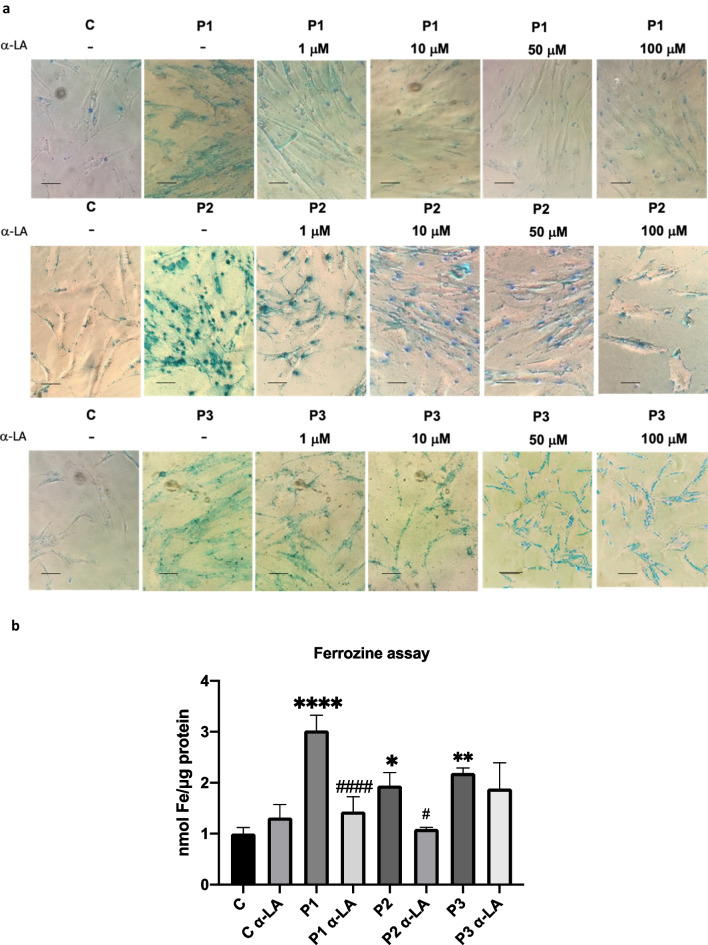
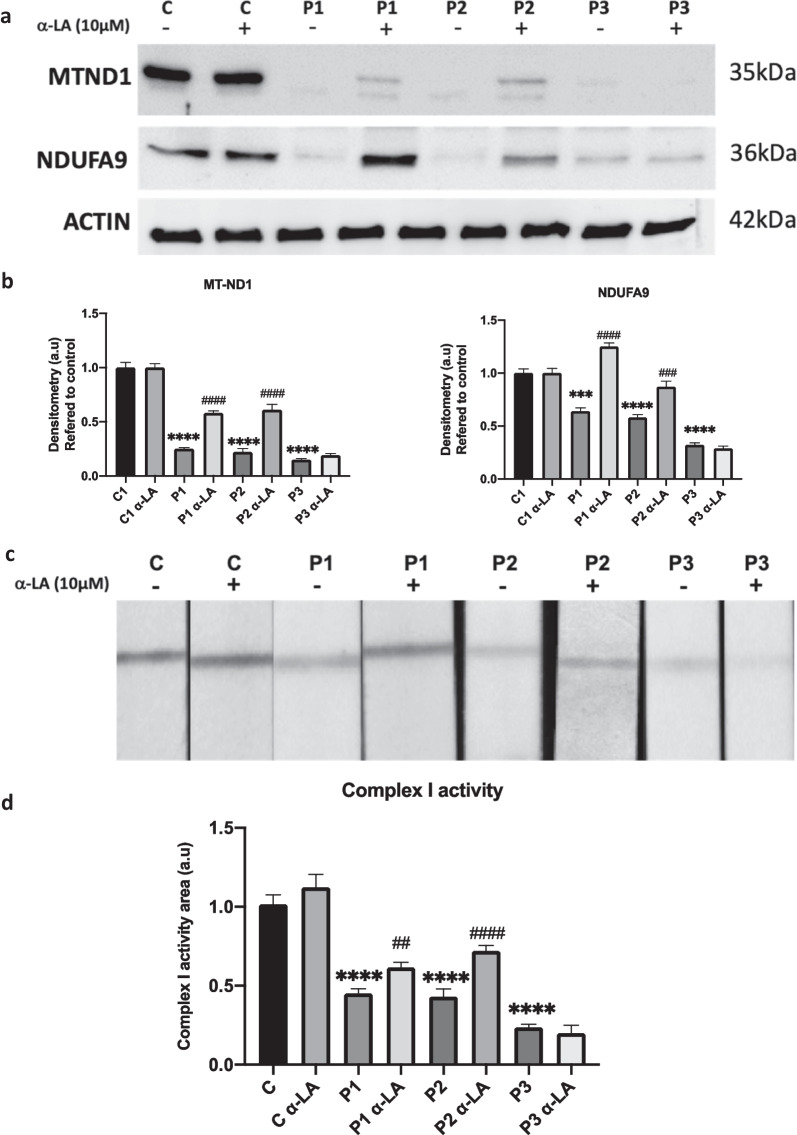
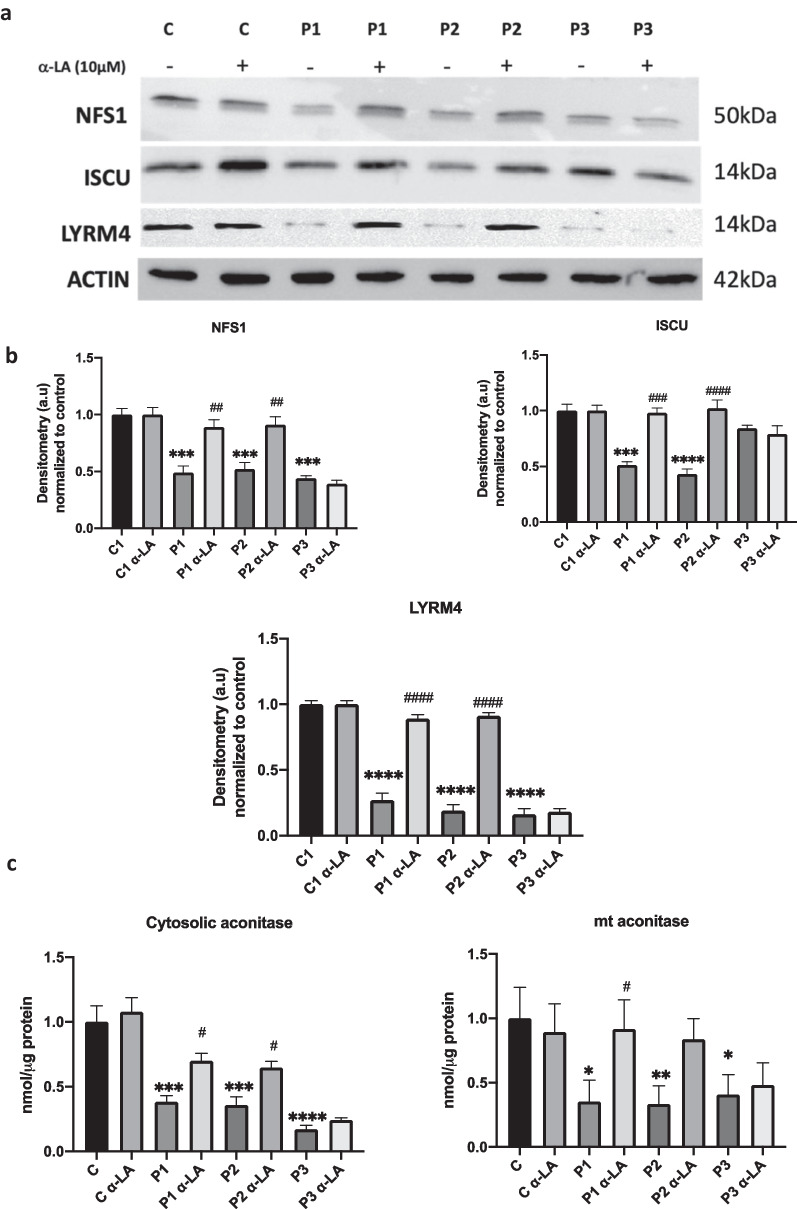
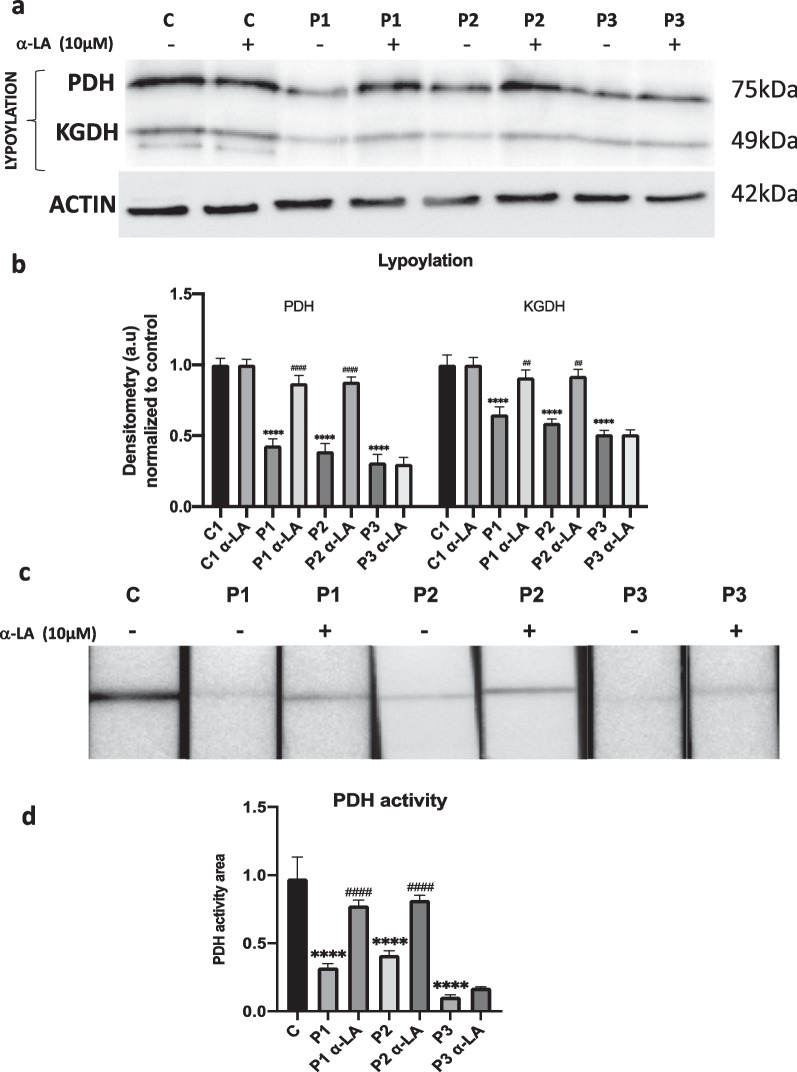
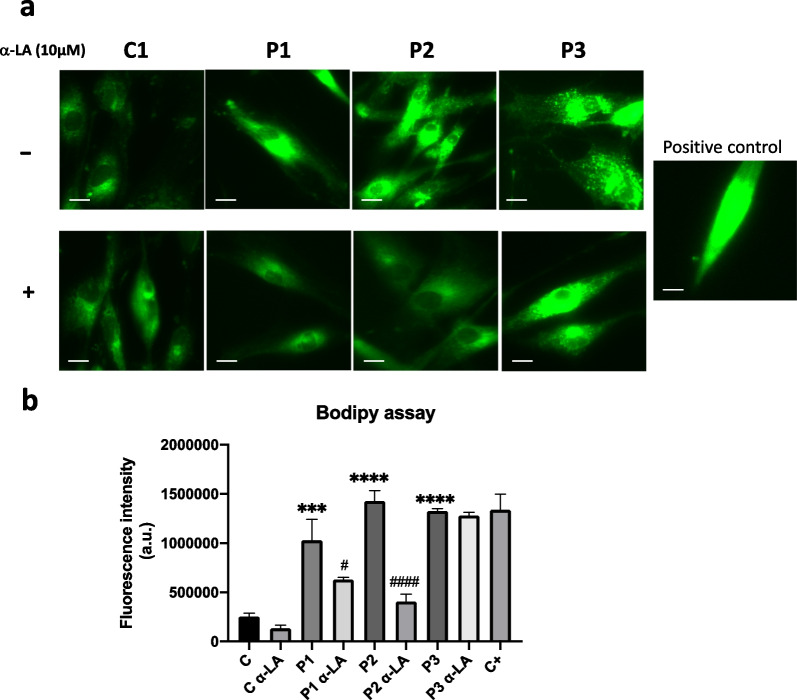
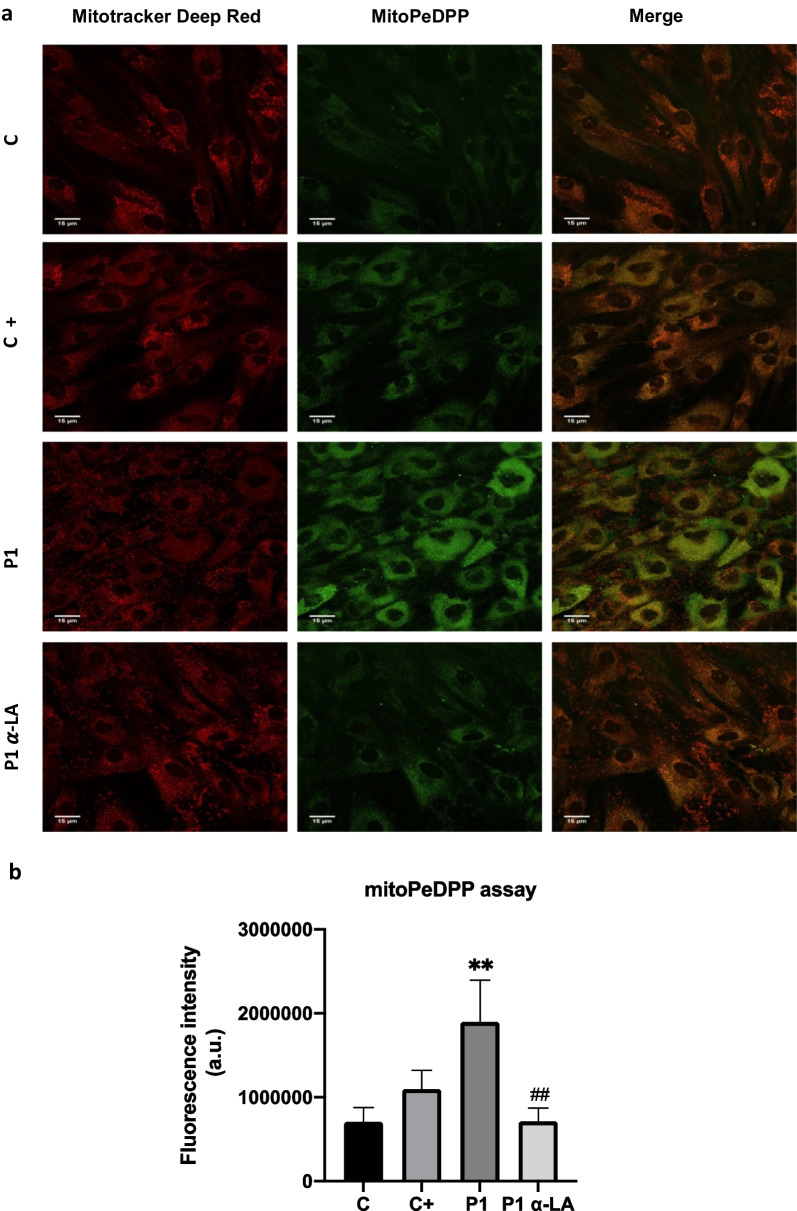
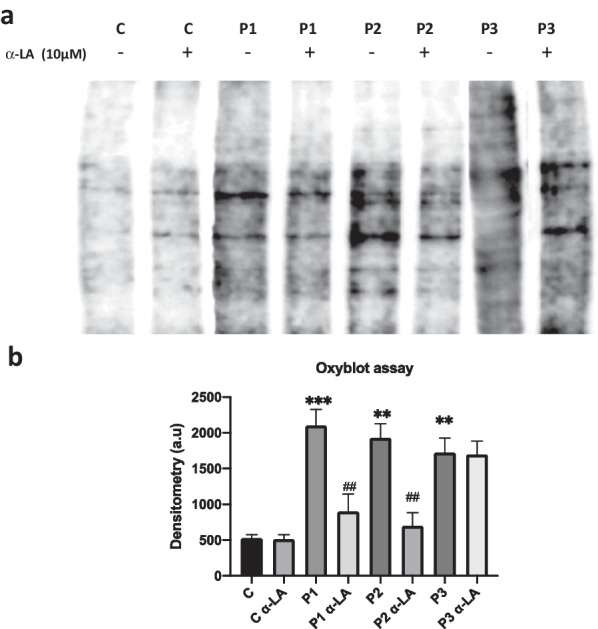
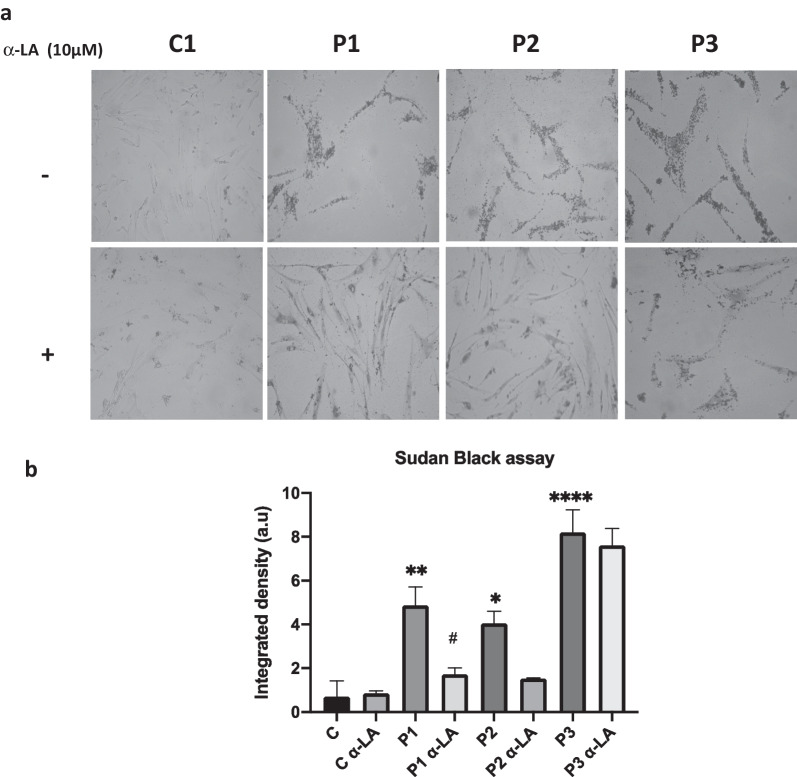
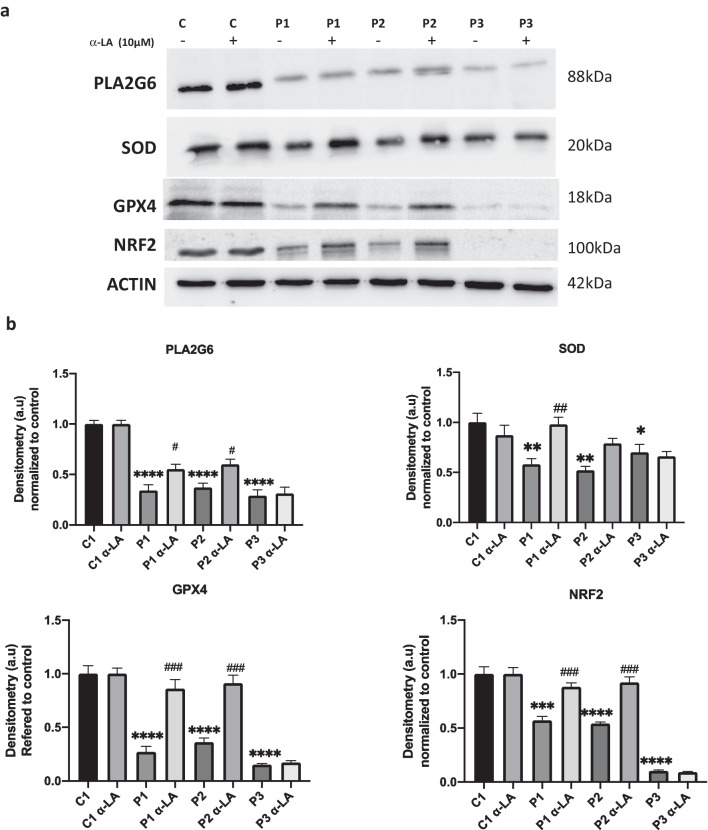
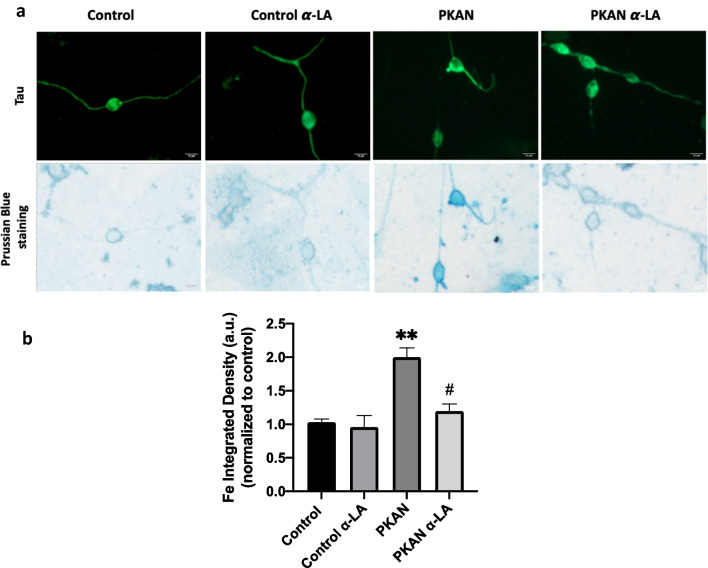
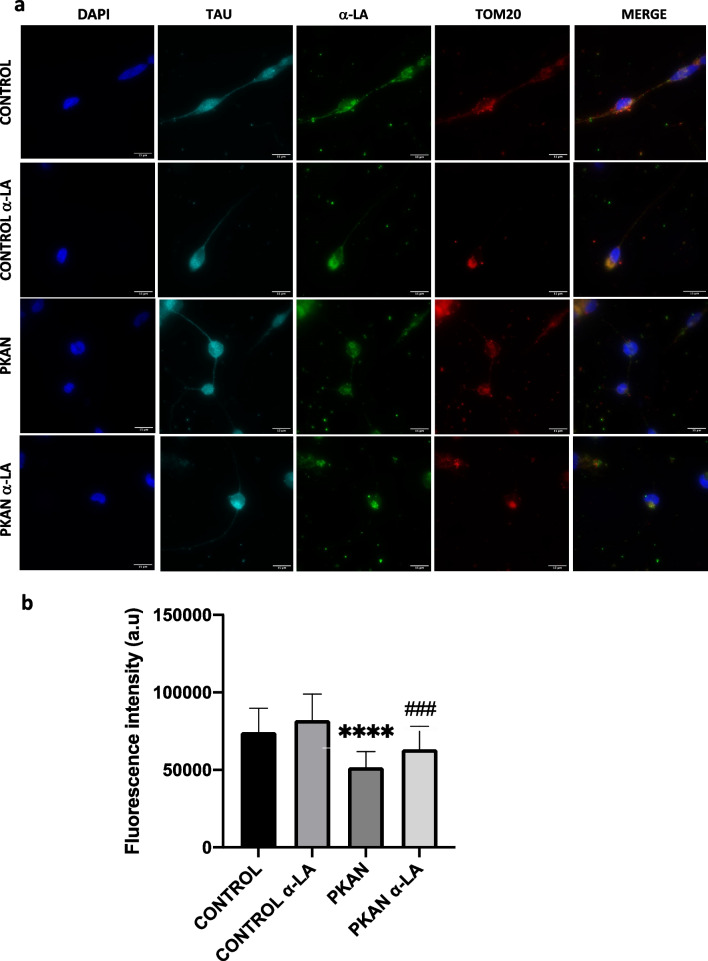
Methods: This study is aimed at evaluating the role of alpha-lipoic acid (α-LA) in reversing the pathological alterations in fibroblasts and induced neurons derived from PKAN patients. Iron accumulation, lipid peroxidation, transcript and protein expression levels of PANK2, mitochondrial ACP (mtACP), 4''-phosphopantetheinyl and lipoylated proteins, as well as pyruvate dehydrogenase (PDH) and Complex I activity were examined.

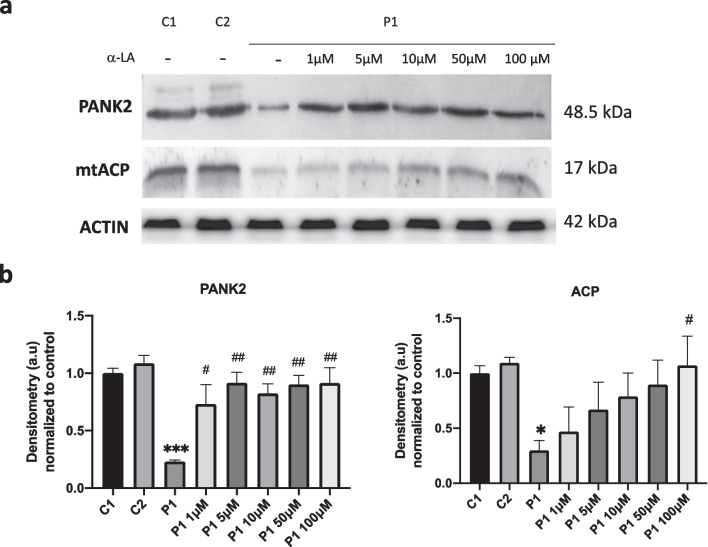
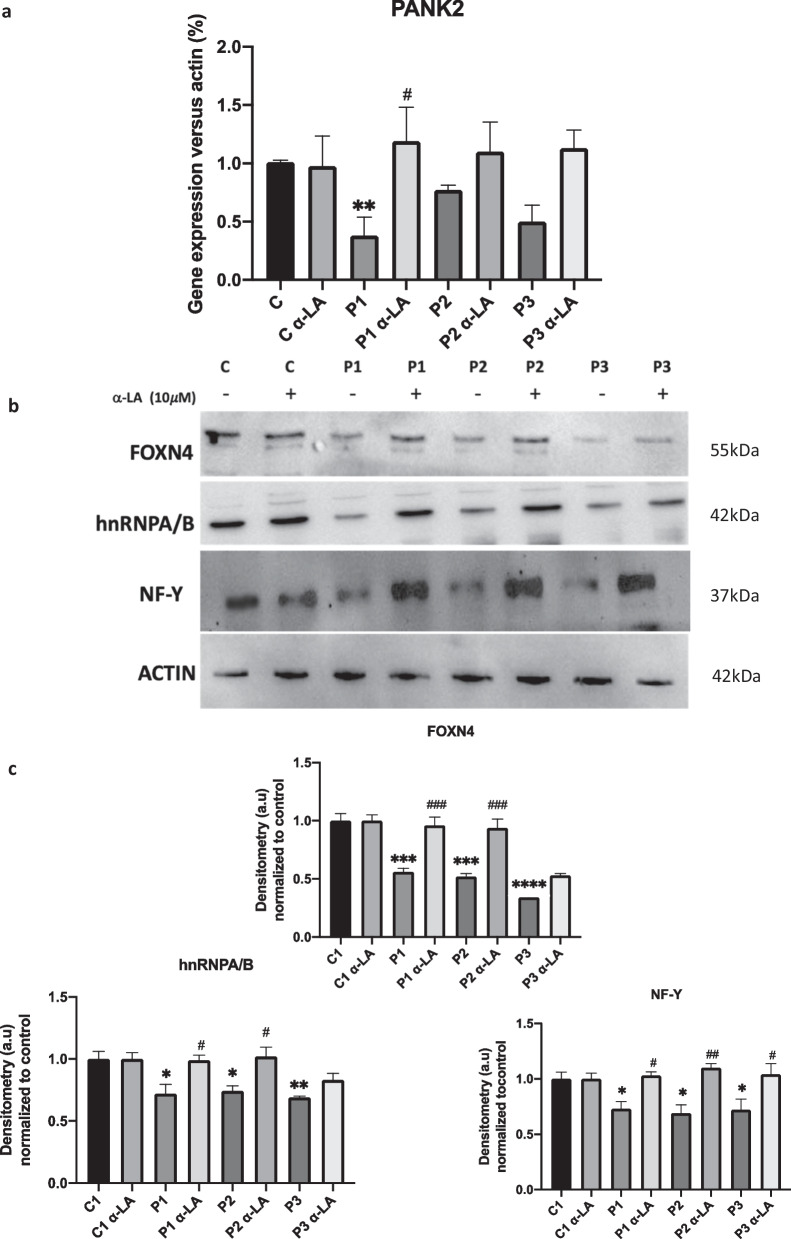
Results: Treatment with α-LA was able to correct all pathological alterations in responsive mutant fibroblasts with residual PANK2 enzyme expression. However, α-LA had no effect on mutant fibroblasts with truncated/incomplete protein expression. The positive effect of α-LA in particular pathogenic variants was also confirmed in induced neurons derived from mutant fibroblasts.

Conclusions: Our results suggest that α-LA treatment can increase the expression levels of PANK2 and reverse the mutant phenotype in PANK2 responsive pathogenic variants. The existence of residual enzyme expression in some affected individuals raises the possibility of treatment using high dose of α-LA.

Keywords: 4′-phosphopantetheinylation; Acyl carrier protein; Coenzyme A; Induced neurons; Mitochondria; PANK2; PKAN; Pantothenate kinase; Pantothenate kinase-associated neurodegeneration; α-lipoic acid.


Conflict of interest statement

The authors declare that they have no competing interests.

Figures

Fig. 1
Fig. 1
Effect of α-LA supplementation on iron accumulation in three mutant PANK2 cells. a Control (C1) and three PKAN fibroblast cell lines (P1, P2 and P3) were treated with increasing α-LA concentrations (1, 10, 50, 100 μM) for 20 days. Then, cells were stained with Prussian Blue as described in Material and Methods and examined by bright-field microscopy. Scale bar = 15 μm. Quantification of Prussian Blue staining is shown in Additional file 1: Fig. 1 b Iron accumulation determined by colorimetric Ferrozine-based assay. Significance between PKAN and control fibroblasts is represented as ****p < 0.0001, **p < 0.005, *p < 0.05 fibroblasts and ####p < 0.0001, #p < 0.05 between untreated and treated fibroblasts
Fig. 2
Fig. 2
Dose–response effect of α-LA on PANK2 and mtACP protein expression levels. a Controls (C1, C2) and patient P1 fibroblasts were treated with increasing concentrations of lipoic acid for 20 days. PANK2 and mtACP protein expression levels of P1 levels were analysed by Western blotting. Actin was used as loading control. b Densitometry of the Western blotting of PANK2 and mtACP. Data represent the mean ± SD of three separate experiments. *p < 0.05, ***p < 0.001 between PKAN patients and controls. #p < 0.05 and ##p < 0.005 between untreated and treated fibroblasts. A.U., arbitrary units
Fig. 3
Fig. 3
Effect of α-LA supplementation on PANK2 gene expression. Control and PKAN fibroblasts (P1, P2, P3) were treated with lipoic acid at 10 μM for twenty days. a PANK2 transcripts were quantified by RT-qPCR. b NF-Y, FOXN4 and hnRNPA/B transcription factors expression levels were analyzed by Western blotting. Actin was used as a loading control. c Densitometry of Western blotting. *p < 0.05, **p < 0.01, ***p < 0.005 ****p < 0.001 between PKAN patients and controls. #p < 0.05, ##p < 0.01, ###p < 0.005 between untreated and treated fibroblasts. A.U., arbitrary units
Fig. 4
Fig. 4
Effect of α-LA treatment on 4′-phosphopantetheinyl proteins expression levels. a Control and PKAN fibroblasts (P1, P2, P3) were treated with α-LA at 10 μM for twenty days. Protein extracts were separated on a SDS polyacrylamide gel and immunostained with antibodies against mtACP, ALDH1L2, AASS, FAS and AASDHPPT. Actin was used as a loading control. (b) Densitometry of Western blotting. *p < 0.05, **p < 0.005, ***p < 0.001 ****p < 0.0001 between PKAN patients and controls. #p < 0.05, ##p < 0.005, ###p < 0.001 ####p < 0.0001 between untreated and treated fibroblasts. A.U., arbitrary units
Fig. 5
Fig. 5
Effect of α-LA on mitochondrial complex I. Control and PKAN fibroblasts (P1, P2, P3) were treated with α-LA at 10 μM for twenty days. a MT-ND1 and NDUFA9, mitochondrial complex I subunits, analysed by Western blotting. b Densitometry of Western blotting. c Mitochondrial complex I activity in whole cellular extracts was measured as described in Material and Methods. d Quantification of mitochondrial complex I activity. Data represent the mean ± SD of two separate experiments. **p < 0.005, ***p < 0.001 ****p < 0.0001 between PKAN patients and controls; ##p < 0.005, ###p < 0.001 ####p < 0.0001 between untreated and treated cells
Fig. 6
Fig. 6
Effect of α-LA treatment on Fe-S cluster assembly complex proteins and aconitase activity. Control and PKAN fibroblasts (P1, P2, P3) were treated with α-LA at 10 μM for 20 days. a Representative image of NFS1, ISCU and LYRM4 protein levels, proteins involved in Fe-S cluster assembly, analysed by Western blotting of treated and untreated control and PKAN fibroblasts. b Densitometry of Western blotting. c Both mitochondrial and cytosolic aconitase activity were determined by colorimetric assay. Data represent the mean ± SD of three separate experiments. *p < 0.05, **p < 0.005, ***p < 0.005 ****p < 0.0001 between PKAN patients and controls; #p < 0.05, ##p < 0.005, ###p < 0.001 between untreated and treated cells
Fig. 7
Fig. 7
Effect of α-LA supplementation on mitochondrial lipoylated proteins and PDH activity. Control and PKAN fibroblasts (P1, P2, P3) were treated with α-LA at 10 μM for 20 days. a Representative image of lipoylated proteins expression levels assessed by Western blotting. b Densitometry of the Western blotting. c PDH activity in whole cellular extracts was measured as described in Material and Methods. Data represent the mean ± SD of two separate experiments. ****p < 0.0001 between PKAN patients and controls; ##p < 0.005, ###p < 0.001 ####p < 0.0001 between untreated and treated cells
Fig. 8
Fig. 8
Effect of α-LA treatment on lipid peroxidation. Control and PKAN fibroblasts (P1, P2 and P3) were treated with α-LA at 10 μM for 20 days. a Representative images of lipid peroxidation in treated and untreated control and PKAN cells using BODIPY® 581/591 C11 staining. Control cells treated with Luperox® (500 μM) for 15 min were used as a positive control of mitochondrial lipid peroxidation. Scale bar = 15 μm. b Fluorescence quantification of oxidized form of BODIPY® C11. Data represent the mean ± SD of three separate experiments (50 cell images for each condition). ***p < 0.001, ****p < 0.0001 between PKAN patients and controls. #p < 0.05, ###p < 0.001, between untreated and treated fibroblasts. A.U., arbitrary units
Fig. 9
Fig. 9
Effect of α-LA treatment on mitochondrial lipid peroxidation. Control and P1 PKAN fibroblasts were treated with α-LA at 10 μM for 20 days. a Representative images of mitochondrial lipid peroxidation in lipoic acid treated and untreated control and PKAN cells by MitoPeDPP staining. Scale bar = 15 μm. Cells also were stained with Mitotracker Deep Red. b Fluorescence quantification of MitoPeDPP. Control cells treated with Luperox® (500 μM) for 15 min were used as a positive control of mitochondrial lipid peroxidation. Data represent the mean ± SD of three separate experiments (50 cell images for each condition). *p < 0.01 between PKAN patients and controls. #p < 0.01 between untreated and treated fibroblasts. A.U., arbitrary units
Fig. 10
Fig. 10
Effect of α-LA treatment on carbonylated protein levels. Control and PKAN fibroblasts (P1, P2, P3) were treated with α-LA at 10 μM for 20 days. a A representative image of carbonylated protein content in treated and untreated control and PKAN fibroblasts by Oxyblot Protein Oxidation Kit b Oxyblot quantification by ImageJ. Data represent the mean ± SD of three separate experiments. **p < 0.005 ***p < 0.001 between PKAN patients and controls. ##p < 0.005 between untreated and treated fibroblasts. A.U., arbitrary units
Fig. 11
Fig. 11
Effect of α-LA treatment on lipofuscin accumulation. Control and PKAN fibroblasts (P1, P2, P3) were treated with α-LA at 10 μM for 20 days. a Representative images of lipofuscin staining by SBB of untreated and treated control and three PKAN patient fibroblasts. Scale bar = 20 μm. b SBB staining quantification. Data represent the mean ± SD of three separate experiments (50 cell images for each condition). *p < 0.05, **p < 0.05, ****p < 0.001 between PKAN patients and controls. #p < 0.05 between untreated and treated fibroblasts. A.U., arbitrary units
Fig. 12
Fig. 12
Effect of α-LA on antioxidant protein expression levels. Control and PKAN fibroblasts (P1, P2, P3) were treated with α-LA at 10 μM for 20 days a Expression levels of PLA2G6, SOD, GPX4 and NRF2 in treated and untreated control and PKAN cells. Actin was used as loading control. b Densitometry of the Western blotting. Data represent the mean ± SD of three separate experiments. **p < 0.01, ***p < 0.005, ****p < 0.0001 between PKAN patients and controls. #p < 0.05, ##p < 0.01, ###p < 0.005 between untreated and treated fibroblasts. A.U., arbitrary units
Fig. 13
Fig. 13
Effect of α-LA on iron accumulation in PKAN induced neurons (iNs). Control and PKAN iNs (P1) were treated with α-LA at 10 μM for 15 days a Representative images of iron accumulation by Prussian Blue staining in α-LA treated and untreated control and PKAN iNs. Scale bar = 15 μm. b Quantification of iron levels by FIJI-ImageJ. iNs showed positive immunoreactivity against Tau. Data represent the mean ± SD two separate experiment (50 cell images for each condition). **p < 0.01between PKAN patients and controls. #p < 0.05 between untreated and treated fibroblasts. A.U., arbitrary units
Fig. 14
Fig. 14
Effect of α-LA on protein lipoylation levels on induced neurons (iNs). Control and PKAN iNs (P1) were treated with α-LA at 10 μM for 15 days a Representative images of protein lipoylation levels in α-LA treated and untreated control and P1 PKAN iNs. Scale bar = 15 μm. b Quantification of fluorescence intensity by FIJI-ImageJ. iNs showed positive immunoreactivity against Tau. Data represent the mean ± SD of 50 cell images for each condition. ***p < 0.0001between PKAN patients and controls. ###p < 0.001 between untreated and treated fibroblasts. A.U., arbitrary units

Similar articles

Cited by

References

    1. Gregory A, Polster BJ, Hayflick SJ. Clinical and genetic delineation of neurodegeneration with brain iron accumulation. J Med Genet. 2009;46(2):73–80. doi: 10.1136/jmg.2008.061929. - DOI - PMC - PubMed
    1. Hayflick SJ, Westaway SK, Levinson B, Zhou B, Johnson MA, Ching KH, Gitschier J. Genetic, clinical, and radiographic delineation of Hallervorden-Spatz syndrome. N Engl J Med. 2003;348(1):33–40. doi: 10.1056/NEJMoa020817. - DOI - PubMed
    1. Levi S, Tiranti V: Neurodegeneration with brain iron accumulation disorders: valuable models aimed at understanding the pathogenesis of iron deposition. Pharmaceuticals 2019; 12(1). - PMC - PubMed
    1. Wilson JL, Gregory A, Kurian MA, Bushlin I, Mochel F, Emrick L, Adang L, Group BGCA, Hogarth P, Hayflick SJ: Consensus clinical management guideline for beta-propeller protein-associated neurodegeneration. Developmental medicine and child neurology 2021, 63(12):1402–1409 - PubMed
    1. Levi S, Finazzi D. Neurodegeneration with brain iron accumulation: update on pathogenic mechanisms. Front Pharmacol. 2014;5:99. doi: 10.3389/fphar.2014.00099. - DOI - PMC - PubMed

Publication types

MeSH terms