

Driving role of climatic and socioenvironmental factors on human brucellosis in China: machine-learning-based predictive analyses
- PMID: 37046326
- PMCID: PMC10091610
- DOI: 10.1186/s40249-023-01087-y
Driving role of climatic and socioenvironmental factors on human brucellosis in China: machine-learning-based predictive analyses
Abstract
Background: Brucellosis is a common zoonotic infectious disease in China. This study aimed to investigate the incidence trends of brucellosis in China, construct an optimal prediction model, and analyze the driving role of climatic factors for human brucellosis.
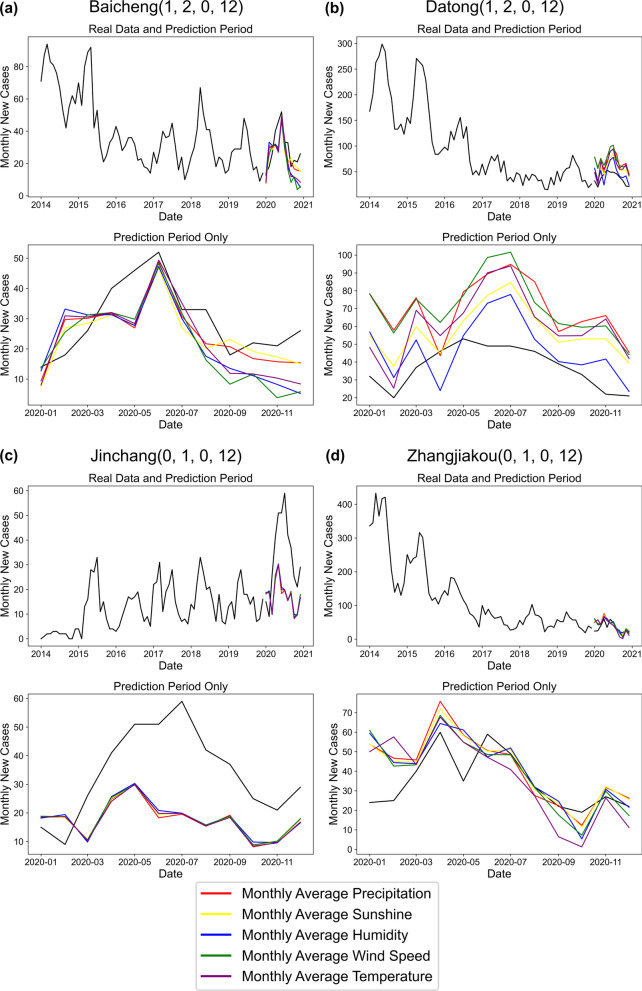
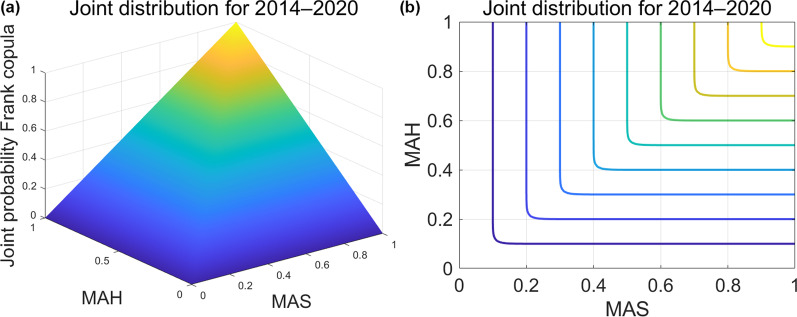
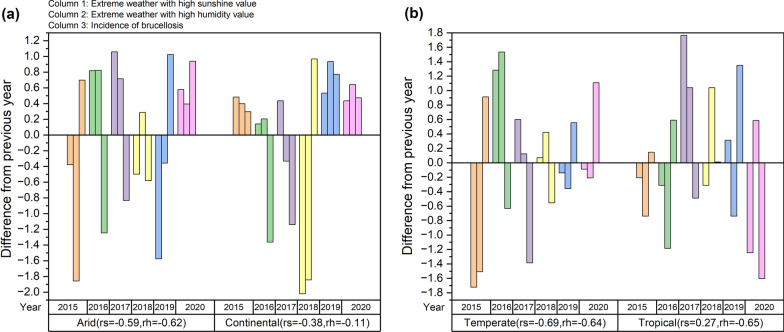
Methods: Using brucellosis incidence, and the socioeconomic and climatic data for 2014-2020 in China, we performed spatiotemporal analyses and calculated correlations with brucellosis incidence in China, developed and compared a series of regression and Seasonal Autoregressive Integrated Moving Average X (SARIMAX) models for brucellosis prediction based on socioeconomic and climatic data, and analyzed the relationship between extreme weather conditions and brucellosis incidence using copula models.
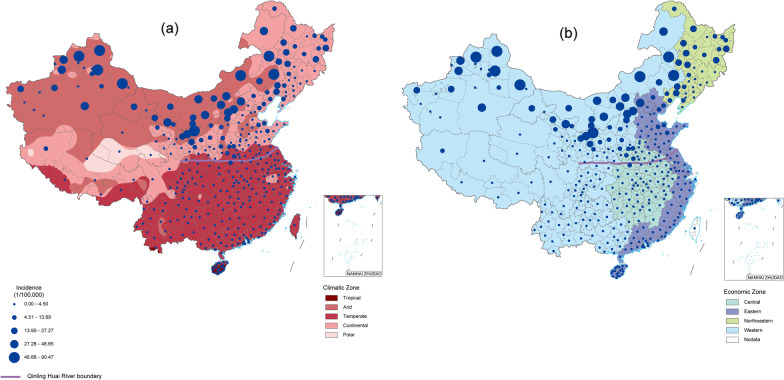
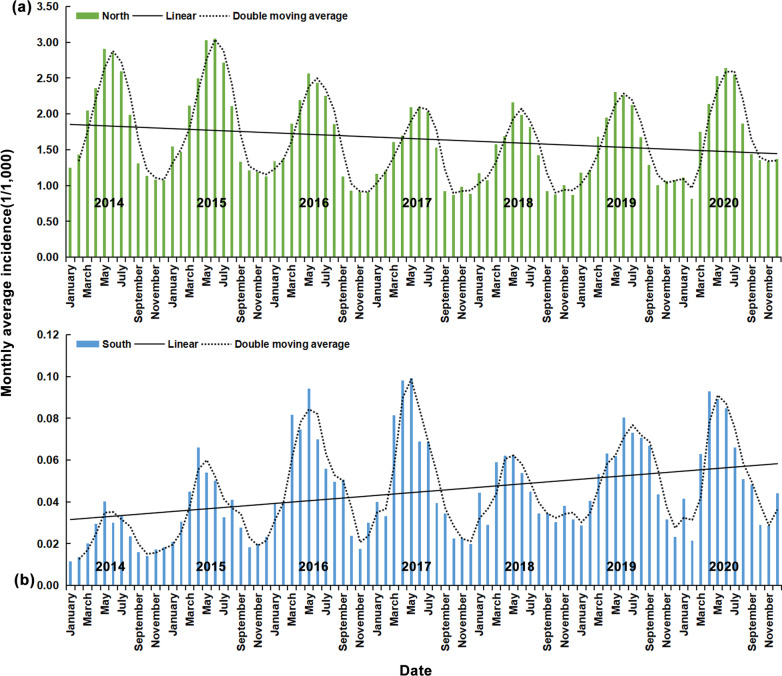
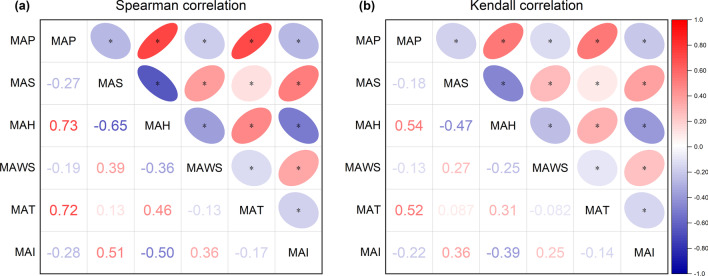
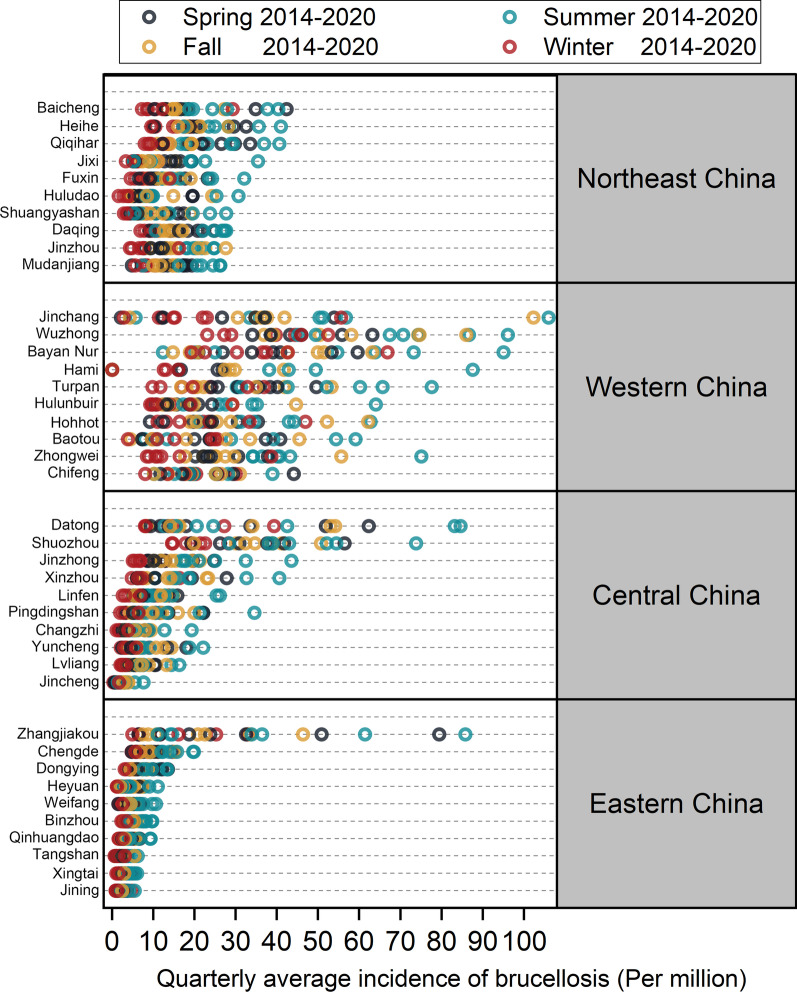
Results: In total, 327,456 brucellosis cases were reported in China in 2014-2020 (monthly average of 3898 cases). The incidence of brucellosis was distinctly seasonal, with a high incidence in spring and summer and an average annual peak in May. The incidence rate was highest in the northern regions' arid and continental climatic zones (1.88 and 0.47 per million people, respectively) and lowest in the tropics (0.003 per million people). The incidence of brucellosis showed opposite trends of decrease and increase in northern and southern China, respectively, with an overall severe epidemic in northern China. Most regression models using socioeconomic and climatic data cannot predict brucellosis incidence. The SARIMAX model was suitable for brucellosis prediction. There were significant negative correlations between the proportion of extreme weather values for both high sunshine and high humidity and the incidence of brucellosis as follows: high sunshine, [Formula: see text] = -0.59 and -0.69 in arid and temperate zones; high humidity, [Formula: see text] = -0.62, -0.64, and -0.65 in arid, temperate, and tropical zones.
Conclusions: Significant seasonal and climatic zone differences were observed for brucellosis incidence in China. Sunlight, humidity, and wind speed significantly influenced brucellosis. The SARIMAX model performed better for brucellosis prediction than did the regression model. Notably, high sunshine and humidity values in extreme weather conditions negatively affect brucellosis. Brucellosis should be managed according to the "One Health" concept.
Keywords: Climatic; Copula model; Extreme weather; Human brucellosis; Socioeconomics.
© 2023. The Author(s).
Conflict of interest statement
The authors declare no conflicts of interest.
Figures
Similar articles
-
Socioeconomic, meteorological factors and spatiotemporal distribution of human brucellosis in China between 2004 and 2019-A study based on spatial panel model.PLoS Negl Trop Dis. 2023 Nov 13;17(11):e0011765. doi: 10.1371/journal.pntd.0011765. eCollection 2023 Nov. PLoS Negl Trop Dis. 2023. PMID: 37956207 Free PMC article.
-
Effect of climatic factors on the seasonal fluctuation of human brucellosis in Yulin, northern China.BMC Public Health. 2020 Apr 16;20(1):506. doi: 10.1186/s12889-020-08599-4. BMC Public Health. 2020. PMID: 32299414 Free PMC article.
-
Driving effect of multiplex factors on human brucellosis in high incidence region, implication for brucellosis based on one health concept.One Health. 2022 Oct 20;15:100449. doi: 10.1016/j.onehlt.2022.100449. eCollection 2022 Dec. One Health. 2022. PMID: 36532675 Free PMC article.
-
Prediction of Human Brucellosis in China Based on Temperature and NDVI.Int J Environ Res Public Health. 2019 Nov 5;16(21):4289. doi: 10.3390/ijerph16214289. Int J Environ Res Public Health. 2019. PMID: 31694212 Free PMC article.
-
Population-based study and a scoping review for the epidemiology and seasonality in and effect of weather on Bell's palsy.Sci Rep. 2021 Aug 20;11(1):16941. doi: 10.1038/s41598-021-96422-4. Sci Rep. 2021. PMID: 34417505 Free PMC article.
Cited by
-
Meteorological, Socioeconomic, and Environmental Factors Influencing Human Brucellosis Occurrence in Yunnan, China, 2006-2021: A Bayesian Spatiotemporal Modeling Study.Transbound Emerg Dis. 2025 Jul 16;2025:8872434. doi: 10.1155/tbed/8872434. eCollection 2025. Transbound Emerg Dis. 2025. PMID: 40703200 Free PMC article.
-
Enhancing public health surveillance: SARIMAX model incorporating Baidu search index for HCV prediction in China.BMC Med Res Methodol. 2025 Apr 23;25(1):108. doi: 10.1186/s12874-025-02562-w. BMC Med Res Methodol. 2025. PMID: 40269734 Free PMC article.
-
Socioeconomic, meteorological factors and spatiotemporal distribution of human brucellosis in China between 2004 and 2019-A study based on spatial panel model.PLoS Negl Trop Dis. 2023 Nov 13;17(11):e0011765. doi: 10.1371/journal.pntd.0011765. eCollection 2023 Nov. PLoS Negl Trop Dis. 2023. PMID: 37956207 Free PMC article.
-
Risk effects of meteorological factors on human brucellosis in Jilin province, China, 2005-2019.Heliyon. 2024 Apr 15;10(8):e29611. doi: 10.1016/j.heliyon.2024.e29611. eCollection 2024 Apr 30. Heliyon. 2024. PMID: 38660264 Free PMC article.
-
Asymmetric Effects of Weather-Integrated Human Brucellosis Forecasting System Using a New Nonlinear Autoregressive Distributed Lag Model.Transbound Emerg Dis. 2024 Mar 5;2024:8381548. doi: 10.1155/2024/8381548. eCollection 2024. Transbound Emerg Dis. 2024. PMID: 40303170 Free PMC article.
References
MeSH terms
Grants and funding
LinkOut - more resources
Full Text Sources
