

Single-cell transcriptomics in ovarian cancer identify a metastasis-associated cell cluster overexpressed RAB13
- PMID: 37046345
- PMCID: PMC10091580
- DOI: 10.1186/s12967-023-04094-7
Single-cell transcriptomics in ovarian cancer identify a metastasis-associated cell cluster overexpressed RAB13
Abstract
Background: Metastasis, the leading cause of cancer-related death in patients diagnosed with ovarian cancer (OC), is a complex process that involves multiple biological effects. With the continuous development of sequencing technology, single-cell sequence has emerged as a promising strategy to understand the pathogenesis of ovarian cancer.
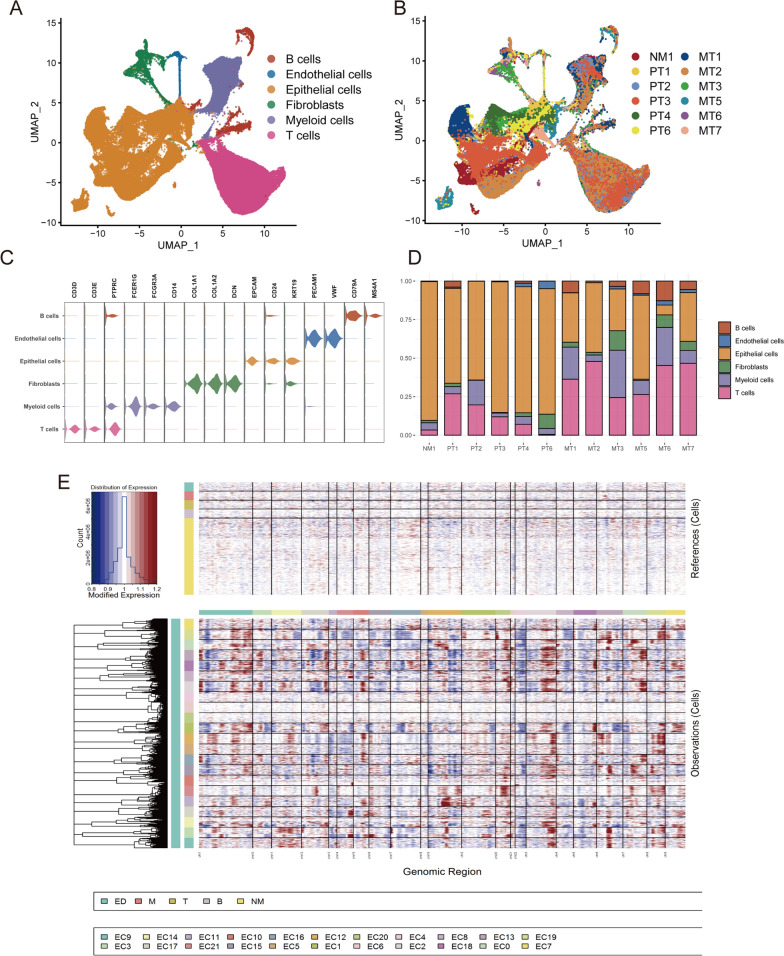
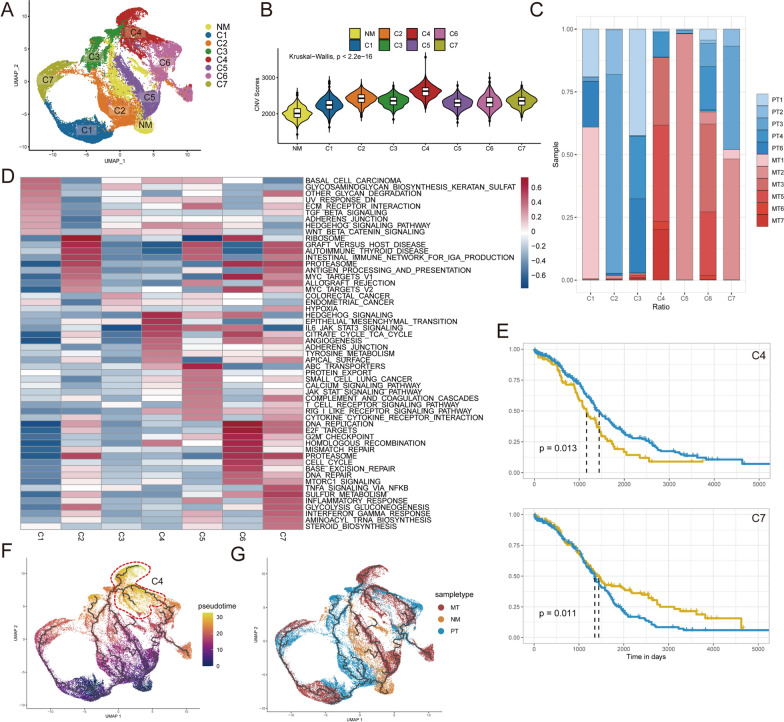
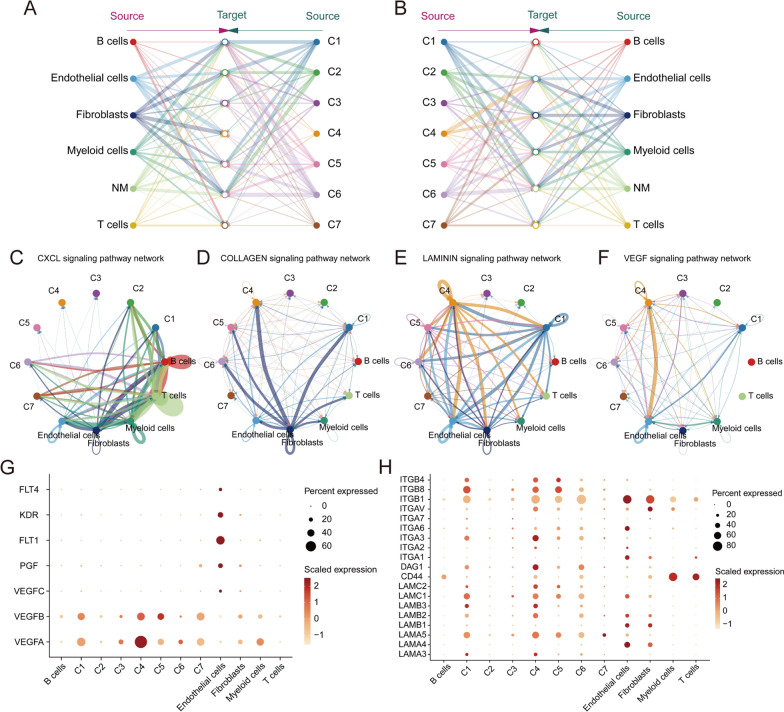
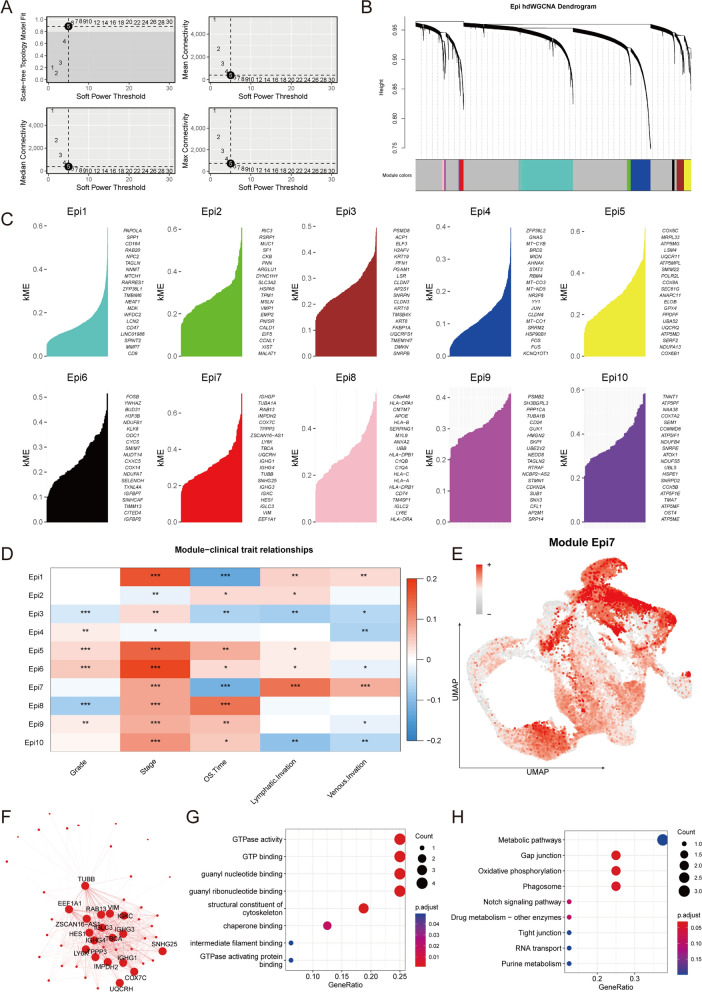
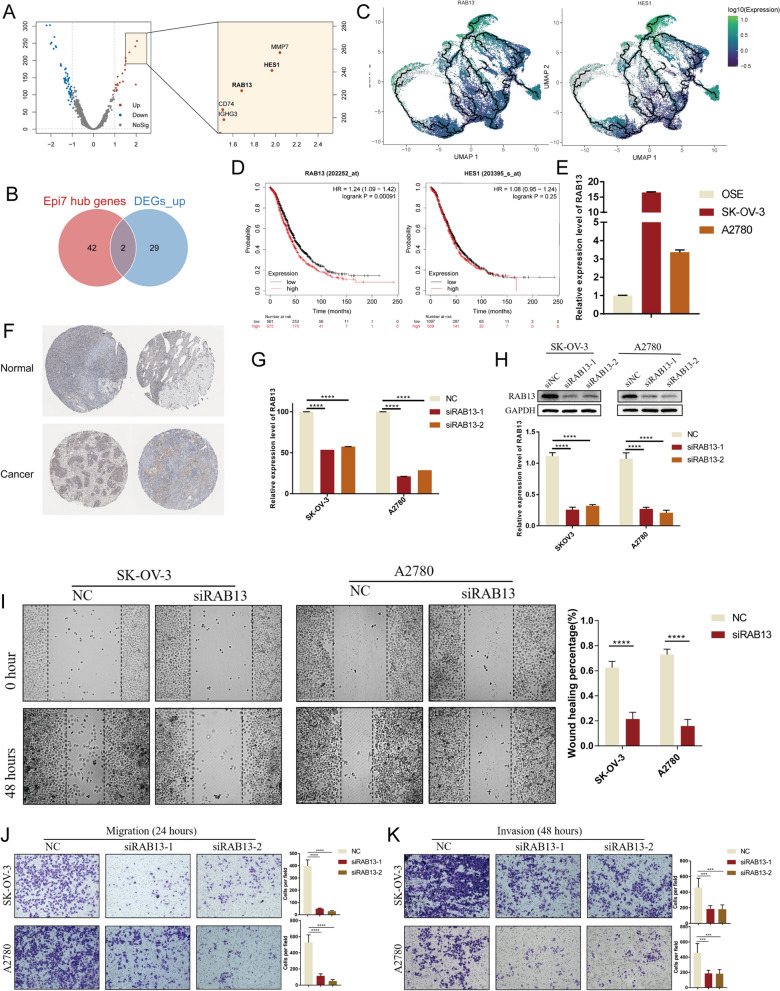
Methods: Through integrating 10 × single-cell data from 12 samples, we developed a single-cell map of primary and metastatic OC. By copy-number variations analysis, pseudotime analysis, enrichment analysis, and cell-cell communication analysis, we explored the heterogeneity among OC cells. We performed differential expression analysis and high dimensional weighted gene co-expression network analysis to identify the hub genes of C4. The effects of RAB13 on OC cell lines were validated in vitro.
Results: We discovered a cell subcluster, referred to as C4, that is closely associated with metastasis and poor prognosis in OC. This subcluster correlated with an epithelial-mesenchymal transition (EMT) and angiogenesis signature and RAB13 was identified as the key marker of it. Downregulation of RAB13 resulted in a reduction of OC cells migration and invasion. Additionally, we predicted several potential drugs that might inhibit RAB13.
Conclusions: Our study has identified a cell subcluster that is closely linked to metastasis in OC, and we have also identified RAB13 as its hub gene that has great potential to become a new therapeutic target for OC.
Keywords: Heterogeneity; Metastasis; Ovarian cancer; RAB13; Single-cell transcriptomics.
© 2023. The Author(s).
Conflict of interest statement
The authors declare that the research was conducted in the absence of any commercial or financial relationships that could be construed as a potential competing interests.
Figures

Similar articles
-
Single-cell transcriptomics identify a chemotherapy-resistance related cluster overexpressed CLIC3 in ovarian cancer.Discov Oncol. 2025 Jun 14;16(1):1099. doi: 10.1007/s12672-025-02882-9. Discov Oncol. 2025. PMID: 40515890 Free PMC article.
-
TRAP1 downregulation in human ovarian cancer enhances invasion and epithelial-mesenchymal transition.Cell Death Dis. 2016 Dec 15;7(12):e2522. doi: 10.1038/cddis.2016.400. Cell Death Dis. 2016. PMID: 27977010 Free PMC article.
-
CRISPR/Cas9-based genome-wide screening for metastasis ability identifies FCGR1A regulating the metastatic process of ovarian cancer by targeting LSP1.J Cancer Res Clin Oncol. 2024 Jun 15;150(6):306. doi: 10.1007/s00432-024-05837-9. J Cancer Res Clin Oncol. 2024. PMID: 38879666 Free PMC article.
-
Identification and validation of Rab GTPases RAB13 as biomarkers for peritoneal metastasis and immune cell infiltration in colorectal cancer patients.Front Immunol. 2024 Aug 13;15:1403008. doi: 10.3389/fimmu.2024.1403008. eCollection 2024. Front Immunol. 2024. PMID: 39192986 Free PMC article.
-
Single-cell transcriptomics in colorectal cancer uncover the potential of metastasis and immune dysregulation of a cell cluster overexpressed PRSS22.Front Immunol. 2025 May 20;16:1586428. doi: 10.3389/fimmu.2025.1586428. eCollection 2025. Front Immunol. 2025. PMID: 40463392 Free PMC article.
Cited by
-
Investigating cellular similarities and differences between upper tract urothelial carcinoma and bladder urothelial carcinoma using single-cell sequencing.Front Immunol. 2024 Jun 6;15:1298087. doi: 10.3389/fimmu.2024.1298087. eCollection 2024. Front Immunol. 2024. PMID: 38903524 Free PMC article.
-
Unlocking ovarian cancer heterogeneity: advancing immunotherapy through single-cell transcriptomics.Front Oncol. 2024 May 30;14:1388663. doi: 10.3389/fonc.2024.1388663. eCollection 2024. Front Oncol. 2024. PMID: 38873253 Free PMC article. Review.
-
Single-Cell RNA Sequencing Reveals the Critical Role of SEC16B in Lung Metastasis of Osteosarcoma.FASEB Bioadv. 2025 Jul 28;7(8):e70025. doi: 10.1096/fba.2024-00161. eCollection 2025 Aug. FASEB Bioadv. 2025. PMID: 40735296 Free PMC article.
-
The molecular mechanism of gemcitabine in inhibiting the HIF-1α/VEGFB/FGF2/FGFR1 signaling pathway for ovarian cancer treatment.Discov Oncol. 2025 Jan 3;16(1):3. doi: 10.1007/s12672-024-01723-5. Discov Oncol. 2025. PMID: 39752011 Free PMC article.
-
The chromatin landscape of high-grade serous ovarian cancer metastasis identifies regulatory drivers in post-chemotherapy residual tumour cells.Commun Biol. 2024 Sep 28;7(1):1211. doi: 10.1038/s42003-024-06909-9. Commun Biol. 2024. PMID: 39341888 Free PMC article.
References
Publication types
MeSH terms
Substances
LinkOut - more resources
Full Text Sources
Medical
Molecular Biology Databases
Miscellaneous
