. 2023 Apr 6;13(7):1359.
doi: 10.3390/diagnostics13071359.

Valid and Reproducible Quantitative Assessment of Cardiac Volumes by Echocardiography in Patients with Valvular Heart Diseases-Possible or Wishful Thinking?

Affiliations

Valid and Reproducible Quantitative Assessment of Cardiac Volumes by Echocardiography in Patients with Valvular Heart Diseases-Possible or Wishful Thinking?

Andreas Hagendorff et al. Diagnostics (Basel). .

Abstract

The analysis of left ventricular function is predominantly based on left ventricular volume assessment. Especially in valvular heart diseases, the quantitative assessment of total and effective stroke volumes as well as regurgitant volumes is necessary for a quantitative approach to determine regurgitant volumes and regurgitant fraction. In the literature, there is an ongoing discussion about differences between cardiac volumes estimated by echocardiography and cardiac magnetic resonance tomography. This viewpoint focuses on the feasibility to assess comparable cardiac volumes with both modalities. The former underestimation of cardiac volumes determined by 2D and 3D echocardiography is presumably explained by methodological and technical limitations. Thus, this viewpoint aims to stimulate an urgent and critical rethinking of the echocardiographic assessment of patients with valvular heart diseases, especially valvular regurgitations, because the actual integrative approach might be too error prone to be continued in this form. It should be replaced or supplemented by a definitive quantitative approach. Valid quantitative assessment by echocardiography is feasible once echocardiography and data analysis are performed with methodological and technical considerations in mind. Unfortunately, implementation of this approach cannot generally be considered for real-world conditions.

Keywords: cardiac magnetic resonance tomography; echocardiography; left ventricular volume; mitral regurgitation.


Conflict of interest statement

The authors declare no conflict of interest.

Figures
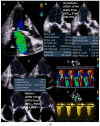
Figure 4
Figure 4
(a): Illustration of a systolic regurgitant jet phenomenon in a patient with isolated mitral regurgitation and the quantitative analysis of left ventricular volume parameters. In (A), the small vena contracta < 1 mm despite a remarkable jet area is shown. In (B), monoplane LV planimetry is shown using the apical long-axis view. In (C), the biplane LV planimetry is shown documenting a total LVSV of 90 mL. In (D), a color-coded M-Mode through the MR shows a nearly constant PISA radius. In (E), the cw regurgitant Doppler velocity is shown. LVEDV = left ventricular end diastolic volume, LVESV = left ventricular end systolic volume, LVSV = left ventricular stroke volume, LVSVtot = total LVSV, and LVEF = left ventricular ejection fraction. (b): Illustration to assess quantitatively effective LVSV and RVSV by pw Doppler echocardiography as well as regurgitant volume by 2D PISA method to analyze severity of mitral regurgitation (MR): in (A), the parasternal long-axis to document LVOT diameter during systole is shown; in (B), the measurements of LVSVeff by pw Doppler spectrum at the level of the LVOT is shown; in (C), the parasternal and subcostal short-axis views are shown to document RVOT diameter during systole; in (D), the measurements of RVSVeff by pw Doppler spectrum at the level of the RVOT is shown. The estimation of RegVolMR by 2D PISA is demonstrated by delineation of the 2D-PISA radius and the velocity time integral of the retrograde transmitral velocity during systole (E,F). LVSV = left ventricular stroke volume, LVEF = left ventricular ejection fraction, LVSVeff = effective LVSV, RegVol = transmitral regurgitant volume, LVOT = left ventricular outflow tract, RVOT = right ventricular outflow tract.
Figure 4
Figure 4
(a): Illustration of a systolic regurgitant jet phenomenon in a patient with isolated mitral regurgitation and the quantitative analysis of left ventricular volume parameters. In (A), the small vena contracta < 1 mm despite a remarkable jet area is shown. In (B), monoplane LV planimetry is shown using the apical long-axis view. In (C), the biplane LV planimetry is shown documenting a total LVSV of 90 mL. In (D), a color-coded M-Mode through the MR shows a nearly constant PISA radius. In (E), the cw regurgitant Doppler velocity is shown. LVEDV = left ventricular end diastolic volume, LVESV = left ventricular end systolic volume, LVSV = left ventricular stroke volume, LVSVtot = total LVSV, and LVEF = left ventricular ejection fraction. (b): Illustration to assess quantitatively effective LVSV and RVSV by pw Doppler echocardiography as well as regurgitant volume by 2D PISA method to analyze severity of mitral regurgitation (MR): in (A), the parasternal long-axis to document LVOT diameter during systole is shown; in (B), the measurements of LVSVeff by pw Doppler spectrum at the level of the LVOT is shown; in (C), the parasternal and subcostal short-axis views are shown to document RVOT diameter during systole; in (D), the measurements of RVSVeff by pw Doppler spectrum at the level of the RVOT is shown. The estimation of RegVolMR by 2D PISA is demonstrated by delineation of the 2D-PISA radius and the velocity time integral of the retrograde transmitral velocity during systole (E,F). LVSV = left ventricular stroke volume, LVEF = left ventricular ejection fraction, LVSVeff = effective LVSV, RegVol = transmitral regurgitant volume, LVOT = left ventricular outflow tract, RVOT = right ventricular outflow tract.
Figure 1
Figure 1
Instructions for proper 2D planimetry or 3D volumetry of the LV cavity. Firstly, check the standardization of apical views by using triplane imaging (A). Secondly, acquire comparable monoplane two- and four-chamber views (2-ChV, 4-ChV) with high spatial resolution to ensure proper visualization of cardiac structures (B,C). Thirdly, properly performed the delineation of mitral anulus—the proximal mitral leaflets normally do not represent the level of mitral anulus (D-Zoom area is labeled by dotted rectangles; the dotted red double arrow displays an improper labeling of the mitral anulus, the solid red double arrow the proper labeling) (D,E). Fourthly, identify intervening spaces between myocardial trabecula (small orange arrows) to delineate the border between compacted and non-compacted myocardium ((F)—4-ChV, (G)—2-ChV; zoom areas are labeled by dotted rectangles; the small orange arrows display the endings of the interspaces between the trabecula; the dotted white lines display an improper labeling of the compacted myocardium; the solid white line displays the proper labeling).
Figure 2
Figure 2
Scheme to illustrate the quantitative approach in a patient with pure mitral regurgitation (MR). The proximal convergence area, the vena contracta, and the jet area displayed in an apical long-axis view is shown in (A). In (B), a corresponding scheme is presented to explain the left ventricular (LV) and right ventricular (RV) volumes and the respective modalities for estimation by echocardiography. LVSV = LV stroke volume, RegVolMR = regurgitant volume through the mitral valve, RVSV = RV stroke volume, pw = pulse wave, LVOT = left ventricular outflow tract, and RVSV = right ventricular outflow tract.
Figure 3
Figure 3
(a): Illustration of underestimation of LVEDV and LVESV by 2D echocardiography: in (A), the planimetry of LVEDV in the two-chamber view (2-ChV) is shown; in (B), the corresponding LVESV is shown. In (C), the planimetry of LVEDV in the four-chamber view (4-ChV) is shown; in (D), the corresponding LVESV is shown. However, the obvious difference between the longitudinal LV axis in the 4-ChV between diastole and systole indicates the foreshortening of the 4-ChV causing errors of LV volume assessment. LVSV = left ventricular stroke volume, LVSVtot = total LVSV, LVSVeff = effective LVSV, LVEDV = left ventricular end diastolic volume, and LVESV = left ventricular end systolic volume. (b): Measurements of the corresponding LVEDV areas in adjusted sectional planes by postprocessing in a 3D dataset in comparison with the 2D echocardiography presented in (a): in (A), the LVEDV assessment of the adjusted four-chamber view is shown; in (B), the perpendicular lines of the apical planes in the short-axis view of the 3D dataset are shown; in (C), the 3D view of the azimuth plane is shown; in (D), the LVEDV assessment of the adjusted two-chamber view is shown. In (E), a parasternal short-axis view during systole to label the RVOT is shown. In (F), the RVOT-pw-Doppler spectrum is shown. In (G), a parasternal long-axis view during systole to label the LVOT is shown. In (H), the LVOT-pw-Doppler spectrum is shown. Estimation of effective LVSV is performed with pw Doppler echocardiography by determination of forward RVSV. In isolated mitral regurgitation, a countercheck can be performed by assessment of forward LVSV which corresponds to forward RVSV. LVSV = left ventricular stroke volume, RVSV = right ventricular stroke volume, LVSVtot = total LVSV, LVSVeff = effective LVSV, LVEDV = left ventricular end-diastolic volume, RVOT = right ventricular outflow tract, and LVOT = left ventricular outflow tract.
Figure 3
Figure 3
(a): Illustration of underestimation of LVEDV and LVESV by 2D echocardiography: in (A), the planimetry of LVEDV in the two-chamber view (2-ChV) is shown; in (B), the corresponding LVESV is shown. In (C), the planimetry of LVEDV in the four-chamber view (4-ChV) is shown; in (D), the corresponding LVESV is shown. However, the obvious difference between the longitudinal LV axis in the 4-ChV between diastole and systole indicates the foreshortening of the 4-ChV causing errors of LV volume assessment. LVSV = left ventricular stroke volume, LVSVtot = total LVSV, LVSVeff = effective LVSV, LVEDV = left ventricular end diastolic volume, and LVESV = left ventricular end systolic volume. (b): Measurements of the corresponding LVEDV areas in adjusted sectional planes by postprocessing in a 3D dataset in comparison with the 2D echocardiography presented in (a): in (A), the LVEDV assessment of the adjusted four-chamber view is shown; in (B), the perpendicular lines of the apical planes in the short-axis view of the 3D dataset are shown; in (C), the 3D view of the azimuth plane is shown; in (D), the LVEDV assessment of the adjusted two-chamber view is shown. In (E), a parasternal short-axis view during systole to label the RVOT is shown. In (F), the RVOT-pw-Doppler spectrum is shown. In (G), a parasternal long-axis view during systole to label the LVOT is shown. In (H), the LVOT-pw-Doppler spectrum is shown. Estimation of effective LVSV is performed with pw Doppler echocardiography by determination of forward RVSV. In isolated mitral regurgitation, a countercheck can be performed by assessment of forward LVSV which corresponds to forward RVSV. LVSV = left ventricular stroke volume, RVSV = right ventricular stroke volume, LVSVtot = total LVSV, LVSVeff = effective LVSV, LVEDV = left ventricular end-diastolic volume, RVOT = right ventricular outflow tract, and LVOT = left ventricular outflow tract.

Similar articles

Cited by

References

    1. Vahanian A., Beyersdorf F., Praz F., Milojevic M., Baldus S., Bauersachs J., Capodanno D., Conradi L., De Bonis M., De Paulis R., et al. 2021 ESC/EACTS Guidelines for the Management of Valvular Heart Disease: Developed by the Task Force for the Management of Valvular Heart Disease of the European Society of Cardiology (ESC) and the European Association for Cardio-Thoracic Surgery (EACTS) Rev. Española Cardiol. (Engl. Ed.) 2022;75:524. doi: 10.1016/j.rec.2022.05.006. - DOI - PubMed
    1. McDonagh T.A., Metra M., Adamo M., Gardner R.S., Baumbach A., Böhm M., Burri H., Butler J., Čelutkienė J., Chioncel O., et al. 2021 ESC Guidelines for the Diagnosis and Treatment of Acute and Chronic Heart Failure. Eur. Heart J. 2021;42:3599–3726. doi: 10.1093/eurheartj/ehab368. - DOI - PubMed
    1. Lancellotti P., Tribouilloy C., Hagendorff A., Popescu B.A., Edvardsen T., Pierard L.A., Badano L., Zamorano J.L., On behalf of the Scientific Document Committee of the European Association of Cardiovascular Imaging Recommendations for the Echocardiographic Assessment of Native Valvular Regurgitation: An Executive Summary from the European Association of Cardiovascular Imaging. Eur. Heart J. Cardiovasc. Imaging. 2013;14:611–644. doi: 10.1093/ehjci/jet105. - DOI - PubMed
    1. Lang R.M., Badano L.P., Mor-Avi V., Afilalo J., Armstrong A., Ernande L., Flachskampf F.A., Foster E., Goldstein S.A., Kuznetsova T., et al. Recommendations for Cardiac Chamber Quantification by Echocardiography in Adults: An Update from the American Society of Echocardiography and the European Association of Cardiovascular Imaging. Eur. Heart J. Cardiovasc. Imaging. 2015;16:233–271. doi: 10.1093/ehjci/jev014. - DOI - PubMed
    1. Zoghbi W.A., Adams D., Bonow R.O., Enriquez-Sarano M., Foster E., Grayburn P.A., Hahn R.T., Han Y., Hung J., Lang R.M., et al. Recommendations for Noninvasive Evaluation of Native Valvular Regurgitation. J. Am. Soc. Echocardiogr. 2017;30:303–371. doi: 10.1016/j.echo.2017.01.007. - DOI - PubMed

LinkOut - more resources