. 2023 Mar 23;24(7):6035.
doi: 10.3390/ijms24076035.

Cholesterol Is a Regulator of CAV1 Localization and Cell Migration in Oral Squamous Cell Carcinoma

Affiliations

Cholesterol Is a Regulator of CAV1 Localization and Cell Migration in Oral Squamous Cell Carcinoma

Nyein Nyein Chan et al. Int J Mol Sci. .

Abstract

Cholesterol plays an important role in cancer progression, as it is utilized in membrane biogenesis and cell signaling. Cholesterol-lowering drugs have exhibited tumor-suppressive effects in oral squamous cell carcinoma (OSCC), suggesting that cholesterol is also essential in OSCC pathogenesis. However, the direct effects of cholesterol on OSCC cells remain unclear. Here, we investigated the role of cholesterol in OSCC with respect to caveolin-1 (CAV1), a cholesterol-binding protein involved in intracellular cholesterol transport. Cholesterol levels in OSCC cell lines were depleted using methyl-β-cyclodextrin and increased using the methyl-β-cyclodextrin-cholesterol complex. Functional analysis was performed using timelapse imaging, and CAV1 expression in cholesterol-manipulated cells was investigated using immunofluorescence and immunoblotting assays. CAV1 immunohistochemistry was performed on surgical OSCC samples. We observed that cholesterol addition induced polarized cell morphology, along with CAV1 localization at the trailing edge, and promoted cell migration. Moreover, CAV1 was upregulated in the lipid rafts and formed aggregates in the plasma membrane in cholesterol-added cells. High membranous CAV1 expression in tissue specimens was associated with OSCC recurrence. Therefore, cholesterol promotes the migration of OSCC cells by regulating cell polarity and CAV1 localization to the lipid raft. Furthermore, membranous CAV1 expression is a potential prognostic marker for OSCC patients.

Keywords: caveolin-1; cell polarization; cholesterol; migration; oral squamous cell carcinoma.


Conflict of interest statement

The authors declare no conflict of interest.

Figures
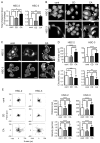
Figure 1
Figure 1
Cholesterol influences cell morphology and promotes cell migration. (A) Quantification of total cellular cholesterol levels using AmplexTM Red cholesterol assay. Open boxes indicate control (cont); gray-shaded boxes indicate cholesterol-depleted (CD) cells; solid boxes indicate cholesterol-added (CA) cells. Triplicate results of cholesterol levels represent fold change as mean ± SD (compared to control). * p < 0.05, ** p < 0.01, and **** p < 0.0001. (B) Fluorescence staining using a filipin III cholesterol probe. Scale bars, 20 µm. Arrows indicate high filipin III signaling at the periphery of the cells. (C) Fluorescence images of F-actin visualized by rhodamine-phalloidin staining to evaluate cellular morphology. Scale bars, 20 µm. Arrowheads indicate the development of a lamellipodia-like structure. (D) Bar graphs showing cellular area and circularity index (N ≥ 50) expressed as mean ± SD. * p < 0.05, ** p < 0.01, *** p < 0.001, and **** p < 0.0001. (E) Cell-tracking plots of timelapse imaging for 8 h (N ≥ 50). Distance and velocity are analyzed using chemotaxis and migration tools (ibidi) and expressed as mean ± SD. ** p < 0.01, *** p < 0.001, and **** p < 0.0001.
Figure 2
Figure 2
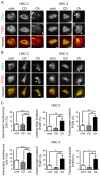
Cholesterol promotes asymmetric membranous localization of CAV1. (A) Colocalization of filipin III and CAV1. Blue, filipin III; red, CAV1. Scale bars, 20 µm. (B) Fluorescence staining for CAV1 and F-actin. Green, CAV1; red, F-actin; blue, Hoechst. Scale bars, 20 µm. Arrows indicate the asymmetric localization of CAV1. (C) CAV1 distribution assessed using confocal microscopy. Green, CAV1; red, F-actin; blue, Hoechst. Scale bars, 5 µm. Arrows indicate the asymmetric localization of CAV1. (D) Assessment of CAV1 distribution by centroid position. Cell centroid (blue square) and CAV1 centroid (red square) of CAV1- and actin-stained cells (N ≥ 50) were determined using ImageJ. The distance between the two points was measured using ImageJ software. Scale bar, 10 µm. Bar graphs represent the distance as mean ± SD. **** p < 0.0001.
Figure 3
Figure 3
Cholesterol endows cell polarity by asymmetric membranous localization of CAV1. (A) Combined immunofluorescence staining of CAV1 and integrin β1 (ITGB1). Green, CAV1; red, ITGB1. Scale bars, 10 µm. White arrows indicate asymmetric membranous localization of CAV1 at the trailing edge of polarized cells; white arrowheads indicate ITGB1 at the cell leading edge in polarized cells. (B) Combined immunofluorescence staining of CAV1 and PTEN. Green, CAV1; red, PTEN. Scale bars, 10 µm. White arrow, asymmetric membranous CAV1 at the trailing edge of polarized cells; yellow arrowhead, PTEN at the trailing edge in polarized cells. (C) Percentage of polarized cells as per the asymmetric localization of CAV1, ITGB1, and PTEN. Bar graphs show triplicate results of the percentage of polarized cells expressed as mean ± SD. * p < 0.05, ** p < 0.01, *** p < 0.001, and **** p < 0.0001.
Figure 4
Figure 4
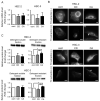
Cholesterol manipulation changes the CAV1 protein level in the cold Triton X-100 (TX)-resistant lipid raft region. (A) Quantitative RT-PCR for CAV1. Triplicate results are shown as mean ± SD. (B) Immunofluorescence staining for CAV1 in cells with or without TX pre-extraction in HSC-2 (upper) and HSC-3 (lower). Scale bars, 10 µm. Arrow indicates asymmetric membranous localization of CAV1 in TX pre-extracted cells. (C) CAV1 protein level in detergent-soluble fraction and detergent-resistant fraction in HSC-2 (upper) and HSC-3 (lower). Coomassie blue stain was used as the loading control. Bar graphs show triplicate results of relative protein level expressed as mean ± SD. * p < 0.05, **p < 0.01.
Figure 5
Figure 5
Membranous CAV1 expression in oral squamous cell carcinoma (OSCC) tissue and its correlation with relapse-free survival. (AC) Representative photomicrograph of the tumor with high membranous CAV1 expression (21%). (DF) Representative photomicrograph of the tumor with low membranous CAV1 expression (6%). (A,D) H&E staining. (B,C,E,F) Immunostaining for CAV1. (C) and (F) are higher-magnification images of (B,E), respectively. Scale bars, 1 mm (A,B,D,E) and 20 µm (C,F). (G) Kaplan–Meier curve showing relapse-free survival of OSCC patients based on membranous CAV1 expression. High membranous CAV1 expression is significantly associated with poor relapse-free survival (p < 0.001). (H) Schematic diagram showing the conclusions of this study. Cholesterol addition increases the cholesterol level in the plasma membrane and the CAV1 level in the lipid raft. Meanwhile, the cell promotes cell migration by changing its shape from polygonal to fan-shaped; polarized morphology with trailing edge localization of CAV1.

Similar articles

Cited by

References

    1. Skotland T., Kavaliauskiene S., Sandvig K. The Role of Lipid Species in Membranes and Cancer-Related Changes. Cancer Metastasis Rev. 2020;39:343–360. doi: 10.1007/s10555-020-09872-z. - DOI - PMC - PubMed
    1. Huang B., Song B.-L., Xu C. Cholesterol Metabolism in Cancer: Mechanisms and Therapeutic Opportunities. Nat. Metab. 2020;2:132–141. doi: 10.1038/s42255-020-0174-0. - DOI - PubMed
    1. Chang W.-C., Huang S.-F., Lee Y.-M., Lai H.-C., Cheng B.-H., Cheng W.-C., Ho J.Y.-P., Jeng L.-B., Ma W.-L. Cholesterol Import and Steroidogenesis Are Biosignatures for Gastric Cancer Patient Survival. Oncotarget. 2017;8:692–704. doi: 10.18632/oncotarget.13524. - DOI - PMC - PubMed
    1. Oni T.E., Biffi G., Baker L.A., Hao Y., Tonelli C., Somerville T.D.D., Deschênes A., Belleau P., Hwang C., Sánchez-Rivera F.J., et al. SOAT1 Promotes Mevalonate Pathway Dependency in Pancreatic Cancer. J. Exp. Med. 2020;217:e20192389. doi: 10.1084/jem.20192389. - DOI - PMC - PubMed
    1. Hryniewicz-Jankowska A., Augoff K., Sikorski A.F. Highlight Article: The Role of Cholesterol and Cholesterol-Driven Membrane Raft Domains in Prostate Cancer. Exp. Biol. Med. 2019;244:1053–1061. doi: 10.1177/1535370219870771. - DOI - PMC - PubMed