

Genome-Wide Urea Response in Rice Genotypes Contrasting for Nitrogen Use Efficiency
- PMID: 37047052
- PMCID: PMC10093866
- DOI: 10.3390/ijms24076080
Genome-Wide Urea Response in Rice Genotypes Contrasting for Nitrogen Use Efficiency
Abstract
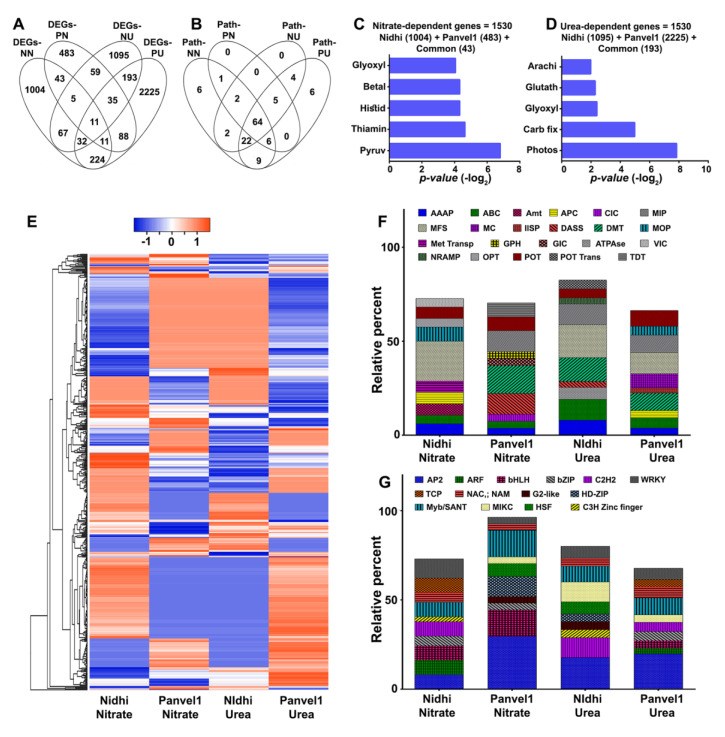
Rice is an ideal crop for improvement of nitrogen use efficiency (NUE), especially with urea, its predominant fertilizer. There is a paucity of studies on rice genotypes contrasting for NUE. We compared low urea-responsive transcriptomes of contrasting rice genotypes, namely Nidhi (low NUE) and Panvel1 (high NUE). Transcriptomes of whole plants grown with media containing normal (15 mM) and low urea (1.5 mM) revealed 1497 and 2819 differentially expressed genes (DEGs) in Nidhi and Panvel1, respectively, of which 271 were common. Though 1226 DEGs were genotype-specific in Nidhi and 2548 in Panvel1, there was far higher commonality in underlying processes. High NUE is associated with the urea-responsive regulation of other nutrient transporters, miRNAs, transcription factors (TFs) and better photosynthesis, water use efficiency and post-translational modifications. Many of their genes co-localized to NUE-QTLs on chromosomes 1, 3 and 9. A field evaluation under different doses of urea revealed better agronomic performance including grain yield, transport/uptake efficiencies and NUE of Panvel1. Comparison of our urea-based transcriptomes with our previous nitrate-based transcriptomes revealed many common processes despite large differences in their expression profiles. Our model proposes that differential involvement of transporters and TFs, among others, contributes to better urea uptake, translocation, utilization, flower development and yield for high NUE.
Keywords: QTLs; networks; nitrogen use efficiency; rice; transcriptome; urea.
Conflict of interest statement
The authors declare no conflict of interest.
Figures


Similar articles
-
Comparative Transcriptomic Analyses of Nitrate-Response in Rice Genotypes With Contrasting Nitrogen Use Efficiency Reveals Common and Genotype-Specific Processes, Molecular Targets and Nitrogen Use Efficiency-Candidates.Front Plant Sci. 2022 Jun 14;13:881204. doi: 10.3389/fpls.2022.881204. eCollection 2022. Front Plant Sci. 2022. PMID: 35774823 Free PMC article.
-
Phenotyping for Nitrogen Use Efficiency: Rice Genotypes Differ in N-Responsive Germination, Oxygen Consumption, Seed Urease Activities, Root Growth, Crop Duration, and Yield at Low N.Front Plant Sci. 2018 Oct 1;9:1452. doi: 10.3389/fpls.2018.01452. eCollection 2018. Front Plant Sci. 2018. PMID: 30327662 Free PMC article.
-
Genome wide analysis of NLP transcription factors reveals their role in nitrogen stress tolerance of rice.Sci Rep. 2020 Jun 10;10(1):9368. doi: 10.1038/s41598-020-66338-6. Sci Rep. 2020. PMID: 32523127 Free PMC article.
-
Nitrogen use efficiency in crops: lessons from Arabidopsis and rice.J Exp Bot. 2017 May 1;68(10):2477-2488. doi: 10.1093/jxb/erx101. J Exp Bot. 2017. PMID: 28419301 Review.
-
Molecular Regulatory Networks for Improving Nitrogen Use Efficiency in Rice.Int J Mol Sci. 2021 Aug 21;22(16):9040. doi: 10.3390/ijms22169040. Int J Mol Sci. 2021. PMID: 34445746 Free PMC article. Review.
Cited by
-
Weighted gene co-expression network analysis of nitrogen (N)-responsive genes and the putative role of G-quadruplexes in N use efficiency (NUE) in rice.Front Plant Sci. 2023 Jun 7;14:1135675. doi: 10.3389/fpls.2023.1135675. eCollection 2023. Front Plant Sci. 2023. PMID: 37351205 Free PMC article.
-
Phenotypic, Physiological, and Gene Expression Analysis for Nitrogen and Phosphorus Use Efficienies in Three Popular Genotypes of Rice (Oryza sativa Indica).Plants (Basel). 2024 Sep 13;13(18):2567. doi: 10.3390/plants13182567. Plants (Basel). 2024. PMID: 39339542 Free PMC article.
References
-
- Abrol Y.P., Adhya T.K., Aneja V.P., Raghuram N., Pathak H., Kulshrestha U., Sharma C., Singh B., editors. The Indian Nitrogen Assessment: Sources of Reactive Nitrogen, Environmental and Climate Effects, Management Options, and Policies. Elsevier; Amsterdam, The Netherlands: 2017. p. 14.
-
- Sutton M., Raghuram N., Adhya T.K., Baron J., Cox C., de Vries W., Hicks K., Howard C., Ju X., Kanter D., et al. Frontiers 2018/19: Emerging Issues of Environmental Concern. Frontiers; Lausanne, Switzerland: 2019. The nitrogen fix: From nitrogen cycle pollution to nitrogen circular economy-frontiers 2018/19: Emerging issues of environmental concern chapter 4.
-
- Sutton M.A., Howard C.M., Kanter D.R., Lassaletta L., Móring A., Raghuram N., Read N. The nitrogen decade: Mobilizing global action on nitrogen to 2030 and beyond. One Earth. 2021;4:10–14. doi: 10.1016/j.oneear.2020.12.016. - DOI
-
- Raghuram N., Sutton M.A., Jeffery R., Ramachandran R., Adhya T.K. From South Asia to the world: Embracing the chal-lenge of global sustainable nitrogen management. One Earth. 2021;4:22–27. doi: 10.1016/j.oneear.2020.12.017. - DOI
-
- Mandal V.K., Sharma N., Raghuram N. Engineering Nitrogen Utilization in Crop Plants. Springer Cham; Berlin/Heidelberg, Germany: 2018. Molecular targets for improvement of crop nitrogen use efficiency: Current and emerging options; pp. 77–93.
MeSH terms
Substances
Grants and funding
LinkOut - more resources
Full Text Sources
Molecular Biology Databases
