

Systematic Review and Meta-Analysis of the Impact of Bariatric Surgery on Future Cancer Risk
- PMID: 37047163
- PMCID: PMC10094585
- DOI: 10.3390/ijms24076192
Systematic Review and Meta-Analysis of the Impact of Bariatric Surgery on Future Cancer Risk
Abstract
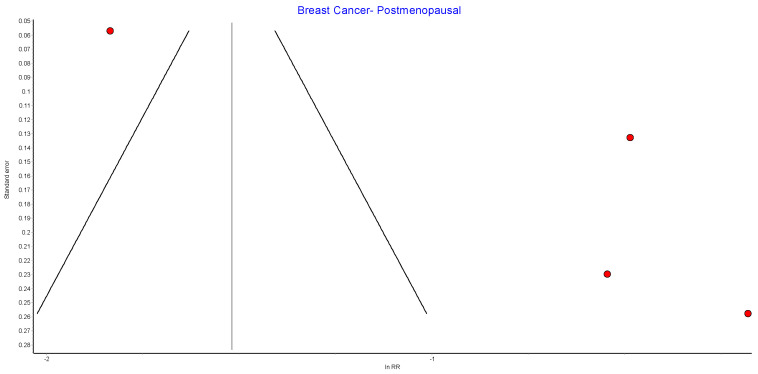
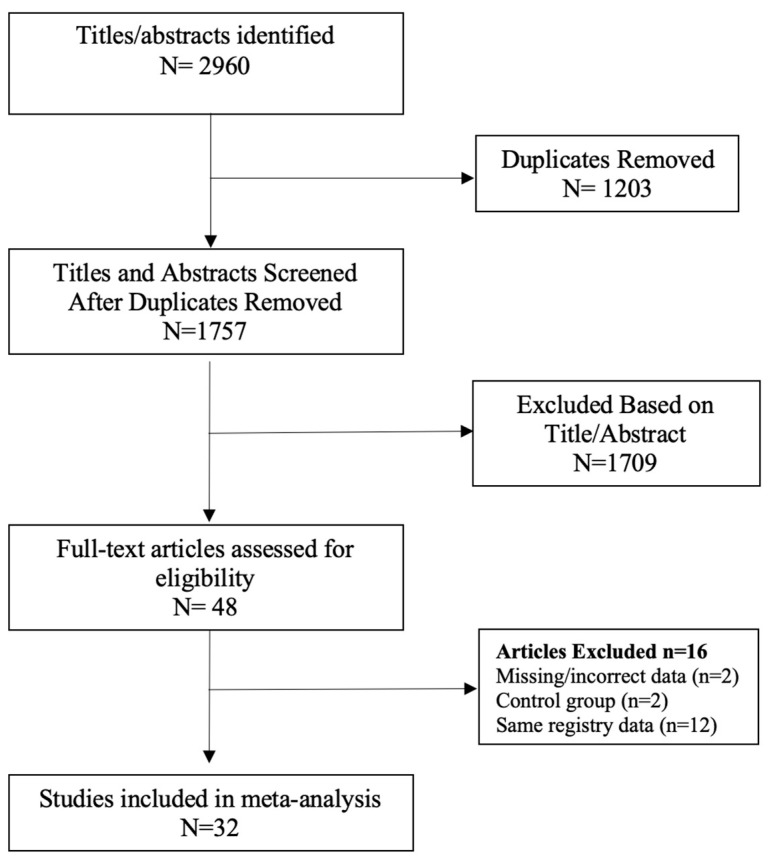
The study aimed to perform a systematic review and meta-analysis of the evidence for the prevention of future cancers following bariatric surgery. A systematic literature search of the Cochrane Library, Embase, Scopus, Web of Science and PubMed databases (2007-2023), Google Scholar and grey literature was conducted. A meta-analysis was performed using the inverse variance method and random effects model. Thirty-two studies involving patients with obesity who received bariatric surgery and control patients who were managed with conventional treatment were included. The meta-analysis suggested bariatric surgery was associated with a reduced overall incidence of cancer (RR 0.62, 95% CI 0.46-0.84, p < 0.002), obesity-related cancer (RR 0.59, 95% CI 0.39-0.90, p = 0.01) and cancer-associated mortality (RR 0.51, 95% CI 0.42-0.62, p < 0.00001). In specific cancers, bariatric surgery was associated with reduction in the future incidence of hepatocellular carcinoma (RR 0.35, 95% CI 0.22-0.55, p < 0.00001), colorectal cancer (RR 0.63, CI 0.50-0.81, p = 0.0002), pancreatic cancer (RR 0.52, 95% CI 0.29-0.93, p = 0.03) and gallbladder cancer (RR 0.41, 95% CI 0.18-0.96, p = 0.04), as well as female specific cancers, including breast cancer (RR 0.56, 95% CI 0.44-0.71, p < 0.00001), endometrial cancer (RR 0.38, 95% CI 0.26-0.55, p < 0.00001) and ovarian cancer (RR 0.45, 95% CI 0.31-0.64, p < 0.0001). There was no significant reduction in the incidence of oesophageal, gastric, thyroid, kidney, prostate cancer or multiple myeloma after bariatric surgery as compared to patients with morbid obesity who did not have bariatric surgery. Obesity-associated carcinogenesis is closely related to metabolic syndrome; visceral adipose dysfunction; aromatase activity and detrimental cytokine, adipokine and exosomal miRNA release. Bariatric surgery results in long-term weight loss in morbidly obese patients and improves metabolic syndrome. Bariatric surgery may decrease future overall cancer incidence and mortality, including the incidence of seven obesity-related cancers.
Keywords: GLP-1; NASH; adipokine; bariatric surgery; cancer; carcinogen; cytokine; diabetes; exosome; gastric bypass surgery; leptin; meta-analysis; metabolic surgery; metabolic syndrome; obesity; oestrogen; semaglutide; sleeve gastrectomy; weight loss.
Conflict of interest statement
R.B.W. discloses relationships with Merck, Fisher and Paykel, Medtronic, and Ethicon involving funding for education, research, and attendance at scientific meetings. The analyses, conclusions, opinions, and statements expressed in the study are solely those of the authors. No external funding was received by any of the authors for the preparation or publication of this study. No endorsement is intended or should be inferred.
Figures


Similar articles
-
The clinical effectiveness and cost-effectiveness of bariatric (weight loss) surgery for obesity: a systematic review and economic evaluation.Health Technol Assess. 2009 Sep;13(41):1-190, 215-357, iii-iv. doi: 10.3310/hta13410. Health Technol Assess. 2009. PMID: 19726018
-
Selenium for preventing cancer.Cochrane Database Syst Rev. 2018 Jan 29;1(1):CD005195. doi: 10.1002/14651858.CD005195.pub4. Cochrane Database Syst Rev. 2018. PMID: 29376219 Free PMC article.
-
Interventions for weight reduction in obesity to improve survival in women with endometrial cancer.Cochrane Database Syst Rev. 2023 Mar 27;3(3):CD012513. doi: 10.1002/14651858.CD012513.pub3. Cochrane Database Syst Rev. 2023. PMID: 36971688 Free PMC article.
-
Drugs for preventing postoperative nausea and vomiting in adults after general anaesthesia: a network meta-analysis.Cochrane Database Syst Rev. 2020 Oct 19;10(10):CD012859. doi: 10.1002/14651858.CD012859.pub2. Cochrane Database Syst Rev. 2020. PMID: 33075160 Free PMC article.
-
Bisphosphonates for breast cancer.Cochrane Database Syst Rev. 2005 Jul 20;(3):CD003474. doi: 10.1002/14651858.CD003474.pub2. Cochrane Database Syst Rev. 2005. Update in: Cochrane Database Syst Rev. 2012 Feb 15;(2):CD003474. doi: 10.1002/14651858.CD003474.pub3. PMID: 16034900 Updated.
Cited by
-
Long-term systemic effects of metabolic bariatric surgery: A multidisciplinary perspective.Heliyon. 2024 Jul 11;10(14):e34339. doi: 10.1016/j.heliyon.2024.e34339. eCollection 2024 Jul 30. Heliyon. 2024. PMID: 39149036 Free PMC article. Review.
-
Glucagon-like peptide-1 receptor agonists compared with bariatric metabolic surgery and the risk of obesity-related cancer: an observational, retrospective cohort study.EClinicalMedicine. 2025 May 11;83:103213. doi: 10.1016/j.eclinm.2025.103213. eCollection 2025 May. EClinicalMedicine. 2025. PMID: 40599584 Free PMC article.
-
YTHDF1-mediated m6A modification promotes cisplatin resistance in ovarian cancer via the FZD7/Wnt/β-catenin pathway.Apoptosis. 2025 Jun;30(5-6):1525-1546. doi: 10.1007/s10495-025-02094-0. Epub 2025 Apr 26. Apoptosis. 2025. PMID: 40281310
-
Embracing the Pros and Cons of the New Weight Loss Medications (Semaglutide, Tirzepatide, Etc.).Curr Urol Rep. 2023 Nov;24(11):515-525. doi: 10.1007/s11934-023-01180-7. Epub 2023 Sep 2. Curr Urol Rep. 2023. PMID: 37659049 Review.
-
Combined robotic surgery for concomitant treatment of endometrial cancer and obesity.Surg Endosc. 2024 Nov;38(11):6691-6699. doi: 10.1007/s00464-024-11274-z. Epub 2024 Sep 25. Surg Endosc. 2024. PMID: 39320546
References
-
- Australian Institute of Health and Welfare Cancer data in Australia [Internet] [(accessed on 29 November 2022)]; Cat. No. CAN 122. Available online: https://www.aihw.gov.au/reports/cancer/cancer-data-in-australia/data.
-
- Australian Institute of Health and Welfare Overweight and obesity [Internet]. Canberra: Australian Institute of Health and Welfare. [(accessed on 29 November 2022)];2022 Available online: https://www.aihw.gov.au/reports/australias-health/overweight-and-obesity.
Publication types
MeSH terms
LinkOut - more resources
Full Text Sources
Medical
