. 2023 Mar 25;24(7):6235.
doi: 10.3390/ijms24076235.

Profiling and Cellular Analyses of Obesity-Related circRNAs in Neurons and Glia under Obesity-like In Vitro Conditions

Affiliations

Profiling and Cellular Analyses of Obesity-Related circRNAs in Neurons and Glia under Obesity-like In Vitro Conditions

Danbi Jo et al. Int J Mol Sci. .

Abstract

Recent evidence indicates that the pathogenesis of neurodegenerative diseases, including Alzheimer's disease, is associated with metabolic disorders such as diabetes and obesity. Various circular RNAs (circRNAs) have been found in brain tissues and recent studies have suggested that circRNAs are related to neuropathological mechanisms in the brain. However, there is a lack of interest in the involvement of circRNAs in metabolic imbalance-related neuropathological problems until now. Herein we profiled and analyzed diverse circRNAs in mouse brain cell lines (Neuro-2A neurons, BV-2 microglia, and C8-D1a astrocytes) exposed to obesity-related in vitro conditions (high glucose, high insulin, and high levels of tumor necrosis factor-alpha, interleukin 6, palmitic acid, linoleic acid, and cholesterol). We observed that various circRNAs were differentially expressed according to cell types with many of these circRNAs conserved in humans. After suppressing the expression of these circRNAs using siRNAs, we observed that these circRNAs regulate genes related to inflammatory responses, formation of synaptic vesicles, synaptic density, and fatty acid oxidation in neurons; scavenger receptors in microglia; and fatty acid signaling, inflammatory signaling cyto that may play important roles in metabolic disorders associated with neurodegenerative diseases.

Keywords: astrocytes; circular RNAs (circRNAs); microglia; neurons; obesity.


Conflict of interest statement

The authors declare no conflict of interest.

Figures
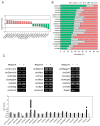
Figure 1
Figure 1
Differential expression and cell-type specificity of obesity-linked circRNAs in the brain. (A) A histogram displaying the differential expression of circRNAs in the brain cortices of obese mice compared to wild-type mice. The data are expressed as the average Log2 fold change (n = 4). (B) Stacked bars showing the cell-type specific expression of obesity-linked circRNAs in three mouse-brain cell lines. The total circRNA expression in the three cell lines is set at 100%, and the relative distribution of circRNAs in each cell line is expressed as percentages (n = 3). (C) Circular structure confirmation of circRNAs. Cropped bands showing the expression of circRNAs and Gapdh in untreated (−) and RNase R-treated (+) Neuro-2A mouse neuroblastoma cells. A histogram displaying changes in expression of circRNAs and Gapdh in RNase R-treated [RNase R (+)] Neuro-2A cells compared to untreated control cells [RNase R (−)]. CircRNAs’ structure confirmation results from a comparative analysis of the expression value of Gapdh mRNA (linear) and the expression value of circRNAs (circular) in the RNase R (+) group. The data are expressed as a relative value of the RNase R-treated group when the untreated control value is 1. Neuro-2A: mouse neuroblastoma cells, BV-2: mouse microglial cells, C8-D1a: mouse astrocytes.
Figure 2
Figure 2
The heatmap displaying the differential expression of obesity-linked circRNAs in three mouse-brain cell lines under obesity-like conditions compared to normal controls. The data for in vivo RNA-seq were obtained and rearranged from our previous report about the transcriptomic analysis of the obese mouse-brain cortex (A reference is referred to in the manuscript). The data are expressed as the average Log2 fold change (in vivo RNA-seq: n = 4, three cell lines: n = 3). The data value and cropped bands corresponding to the heatmap are provided in Supplementary Figures S3–S9. HG/HI: high glucose and insulin concentration, TNF-α: tumor-necrosis factor-alpha, IL-6: interleukin-6, PA: BSA-conjugated palmitic acid, LA: BSA-conjugated linoleic acid, Chol: cholesterol, Neuro-2A: mouse neuroblastoma cells, BV-2: mouse microglial cells, C8-D1a: mouse astrocytes.
Figure 3
Figure 3
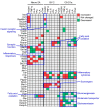
The heatmap displays upregulated and downregulated genes associated with functions by cell type and obesity-related serum factor in three mouse-brain cell lines under obesity-like conditions compared to normal controls. The blue letters and boxes represent clusters of genes that function similarly. The data are expressed as “increased” when the gene expression was significantly increased in cells under obesity-like conditions compared to controls (Red). “Not changed” indicates no significant changes in gene expression in cells under obesity-like conditions compared to normal controls (Silver). “Decreased” indicates the gene expression was significantly decreased in cells under obesity-like conditions compared to normal controls (Green). The data values used in the heatmap are expressed as a histogram in Supplementary Figure S11A–F. HG/HI: high glucose and insulin concentration, TNF-α: tumor-necrosis factor-alpha, IL-6: interleukin-6, PA: BSA-conjugated palmitic acid, LA: BSA-conjugated linoleic acid, Chol: cholesterol, Neuro-2A: mouse neuroblastoma cells, BV-2: mouse microglial cells, C8-D1a: mouse astrocytes.
Figure 4
Figure 4
Histograms displaying the differential expression of functional genes after depletion of circRNAs in neuronal cell lines under obesity-like conditions. (A) Expression changes of genes associated with neuronal responses by high glucose and insulin concentration (HG/HI) after circSnx12 depletion in mouse neuroblastoma cells (Neuro-2A). (B) Expression changes of genes associated with neuronal responses by BSA-conjugated linoleic acid (LA) after circRabgef1 depletion in Neuro-2A cells. (C) Expression changes of genes associated with neuronal responses by LA after circDennd1b depletion in Neuro-2A cells. (D) Expression changes of genes associated with neuronal responses by cholesterol (Chol) after circDennd1b depletion in Neuro-2A cells. In (AD), the data are presented as the mean ± standard error of the mean (SEM) (n = 3), and statistical significance was determined using an unpaired two-tailed t-test with Welch’s correction; * p < 0.05, ** p < 0.01, *** p < 0.001.
Figure 5
Figure 5
Histograms displaying the differential expression of functional genes after depletion of circRNAs in an astrocyte cell line under obesity-like conditions. (A) Expression changes of genes associated with astrocytic responses by TNF-α after circZzz3 depletion in C8-D1a cells. (B) Expression changes of genes associated with astrocytic responses by LA after circStx6 depletion in C8-D1a cells. (C) Expression changes of genes associated with astrocytic responses by PA after circStx6 depletion in C8-D1a cells. (D) Expression changes of genes associated with astrocytic responses by Chol after circAftph depletion in C8-D1a cells. (E) Expression changes of genes associated with astrocytic responses by Chol after circUsp3 depletion in C8-D1a cells. The cropped band used for analysis is in Supplementary Figure S13. In (Figure S13A–I), the data are presented as the mean ± standard error of the mean (SEM) (n = 3), and statistical significance was determined using an unpaired two-tailed t-test with Welch’s correction; * p < 0.05, ** p < 0.01, *** p < 0.001.
Figure 6
Figure 6
Characterization of circRNAs (A) The protein-coding potential of circRNAs was analyzed by CPC 2.0 (expressed as coding or non-coding) and CPAT (expressed as yes or no) tools. (B) The prediction of protein factors using ChEA3 that may regulate transcription of genes affected by HFD in the RNA-seq data. The color bar expresses the top ten ranking of the integrated score for ChEA3. (C) The interaction probability between circStx6 and transcription factors was predicted using RPIseq. (D) The interaction probability between circRagbef1 and transcription factors was predicted using RPIseq. (E) The interaction probability between circDeen1b and transcription factors was predicted using RPIseq. (F) The interaction probability between circZzz3 and transcription factors was predicted using RPIseq. (G) The interaction probability between circSnx12 and transcription factors was predicted using RPIseq. (H) The interaction probability between circAftph and transcription factors was predicted using RPIseq. (I) The interaction probability between circUsp3 and transcription factors was predicted using RPIseq. In (CI), the color bar indicates the interaction probability score (0–1) between circRNAs and transcription factors. RF: random forest, SVM: support vector forest.

Similar articles

Cited by

References

    1. Knopman D.S., Amieva H., Petersen R.C., Chetelat G., Holtzman D.M., Hyman B.T., Nixon R.A., Jones D.T. Alzheimer disease. Nat. Rev. Dis. Prim. 2021;7:33. doi: 10.1038/s41572-021-00269-y. - DOI - PMC - PubMed
    1. Hardy J., Selkoe D.J. The amyloid hypothesis of Alzheimer’s disease: Progress and problems on the road to therapeutics. Science. 2002;297:353–356. doi: 10.1126/science.1072994. - DOI - PubMed
    1. Hardy J.A., Higgins G.A. Alzheimer’s disease: The amyloid cascade hypothesis. Science. 1992;256:184–185. doi: 10.1126/science.1566067. - DOI - PubMed
    1. Arnsten A.F.T., Datta D., Del Tredici K., Braak H. Hypothesis: Tau pathology is an initiating factor in sporadic Alzheimer’s disease. Alzheimers Dement. 2021;17:115–124. doi: 10.1002/alz.12192. - DOI - PMC - PubMed
    1. Scheltens P., De Strooper B., Kivipelto M., Holstege H., Chetelat G., Teunissen C.E., Cummings J., van der Flier W.M. Alzheimer’s disease. Lancet. 2021;397:1577–1590. doi: 10.1016/S0140-6736(20)32205-4. - DOI - PMC - PubMed