. 2023 Mar 25;24(7):6238.
doi: 10.3390/ijms24076238.

Discovery of SNP Molecular Markers and Candidate Genes Associated with Sacbrood Virus Resistance in Apis cerana cerana Larvae by Whole-Genome Resequencing

Affiliations

Discovery of SNP Molecular Markers and Candidate Genes Associated with Sacbrood Virus Resistance in Apis cerana cerana Larvae by Whole-Genome Resequencing

Aqai Kalan Hassanyar et al. Int J Mol Sci. .

Abstract

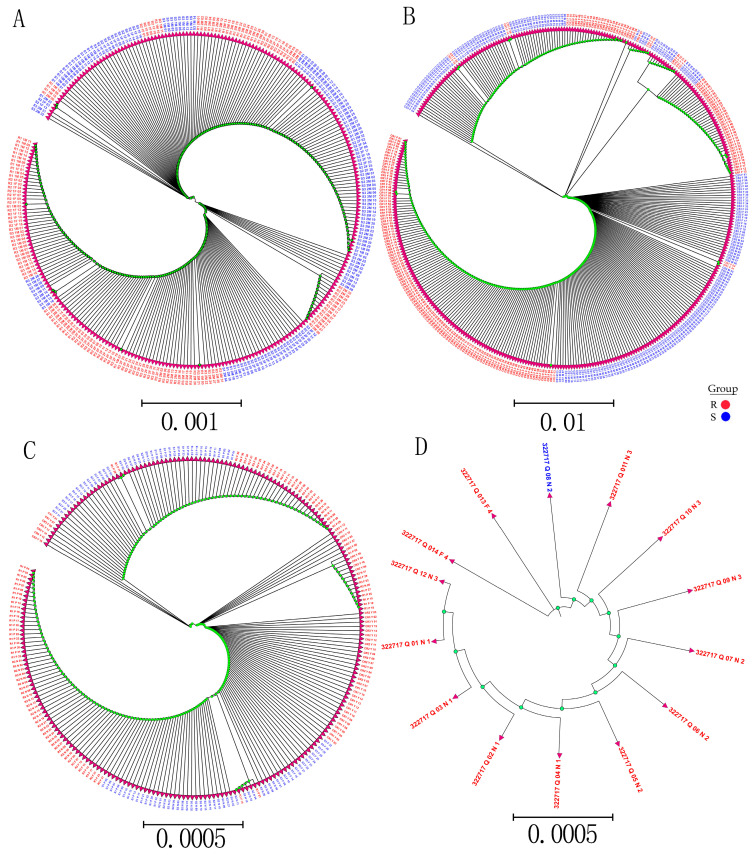
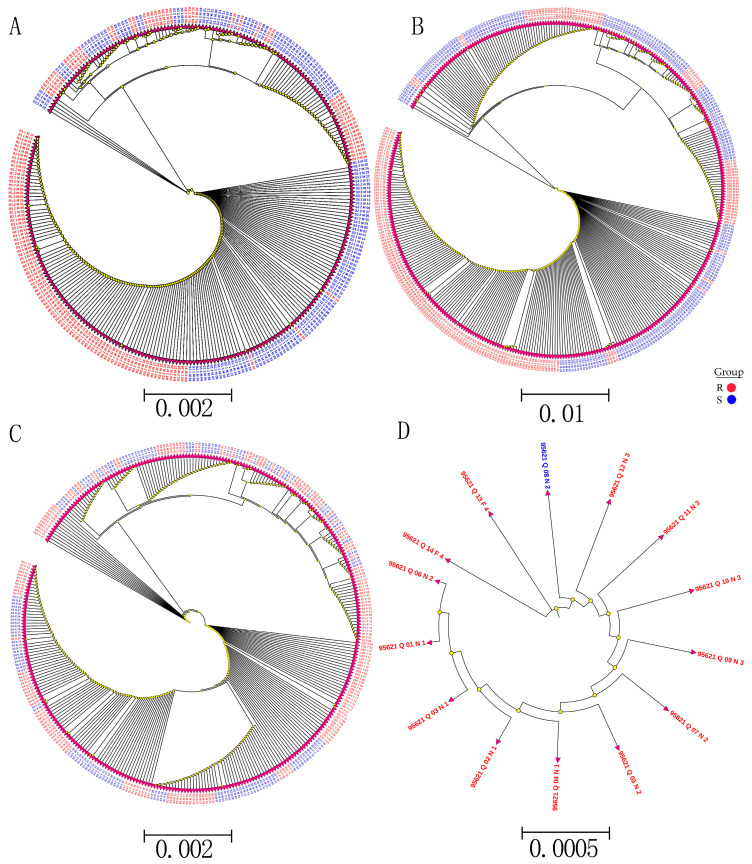
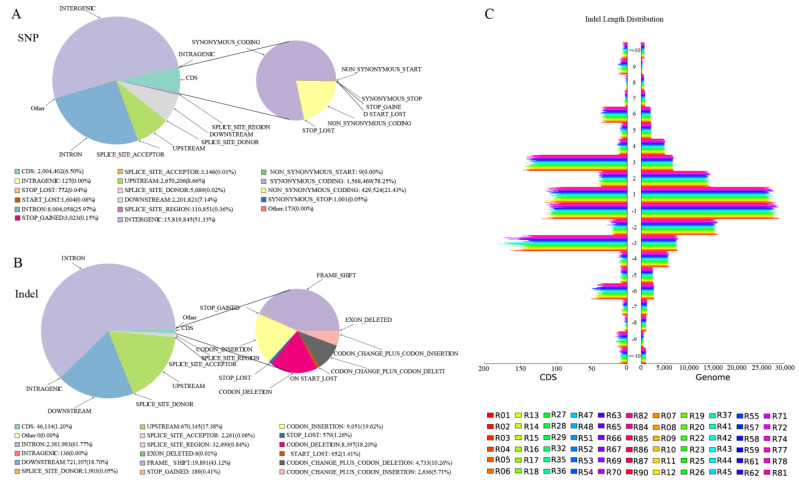
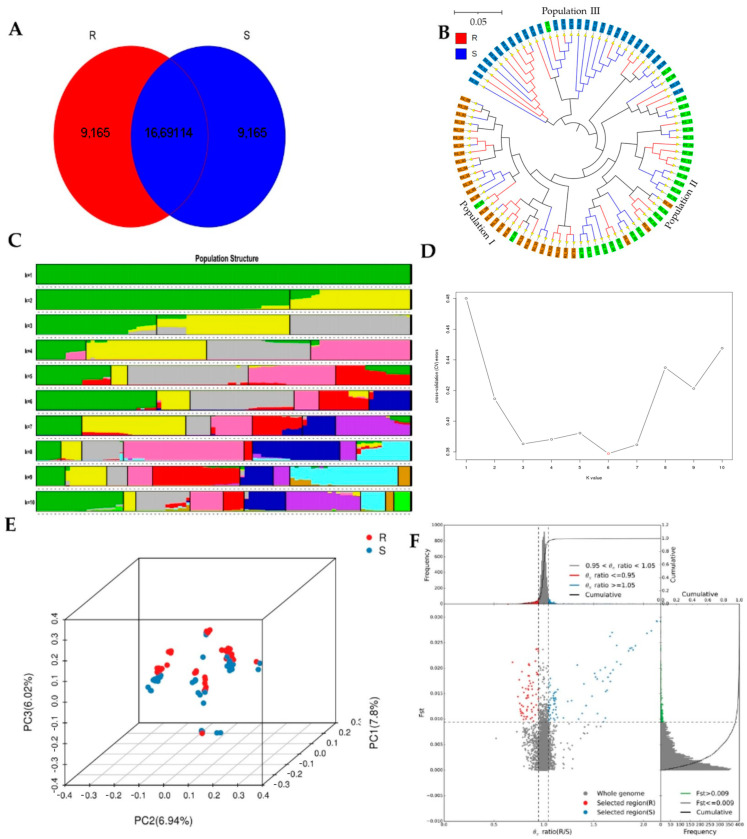
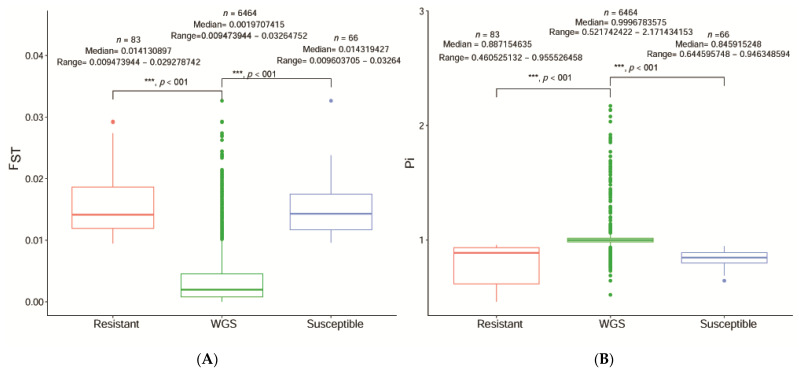
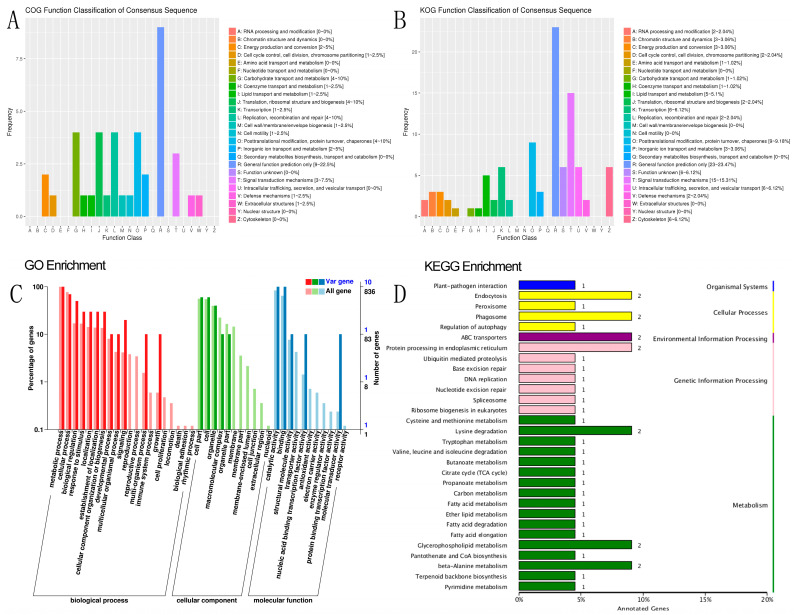
Sacbrood virus (SBV) is a significant problem that impedes brood development in both eastern and western honeybees. Whole-genome sequencing has become an important tool in researching population genetic variations. Numerous studies have been conducted using multiple techniques to suppress SBV infection in honeybees, but the genetic markers and molecular mechanisms underlying SBV resistance have not been identified. To explore single nucleotide polymorphisms (SNPs), insertions, deletions (Indels), and genes at the DNA level related to SBV resistance, we conducted whole-genome resequencing on 90 Apis cerana cerana larvae raised in vitro and challenged with SBV. After filtering, a total of 337.47 gigabytes of clean data and 31,000,613 high-quality SNP loci were detected in three populations. We used ten databases to annotate 9359 predicted genes. By combining population differentiation index (FST) and nucleotide polymorphisms (π), we examined genome variants between resistant (R) and susceptible (S) larvae, focusing on site integrity (INT < 0.5) and minor allele frequency (MAF < 0.05). A selective sweep analysis with the top 1% and top 5% was used to identify significant regions. Two SNPs on the 15th chromosome with GenBank KZ288474.1_322717 (Guanine > Cytosine) and KZ288479.1_95621 (Cytosine > Thiamine) were found to be significantly associated with SBV resistance based on their associated allele frequencies after SNP validation. Each SNP was authenticated in 926 and 1022 samples, respectively. The enrichment and functional annotation pathways from significantly predicted genes to SBV resistance revealed immune response processes, signal transduction mechanisms, endocytosis, peroxisomes, phagosomes, and regulation of autophagy, which may be significant in SBV resistance. This study presents novel and useful SNP molecular markers that can be utilized as assisted molecular markers to select honeybees resistant to SBV for breeding and that can be used as a biocontrol technique to protect honeybees from SBV.

Keywords: Apis cerana cerana; larva; nucleotide polymorphisms; population differentiation index; sacbrood virus; sequencing; single nucleotide polymorphism; variants.


Conflict of interest statement

The authors declare no conflict of interest.

Figures

Figure A1
Figure A1
Phylogenetic trees of short DNA Sanger Sequencing of SNP KZ288474_322717 from 926 samples in different categories. (A) Phylogenetic trees of first and second SNP validation of R (resistant) and S (susceptible) of 288 samples from three Apis ceranacerana colonies in Minhou (M) (1 and 2 M) and F (Fuzhou) (1 and 2 F); (B) comparison of SNP validation of 384 samples from six colonies (three colonies resistant (CR) in Fuzhou and three colonies susceptible (CS) in Minho); (C) further SNP validation of 240 samples from six colonies and different geographic locations in P (Putian) (one colony), N (Nanping) (one colony), Fuzhou (one colony), and in Y (Yunnan Province) (three colonies); (D) SNP validation at the queen level of 14 colonies (12 colonies in Nanping and 2 colonies in Fuzhou). Neighbor-joining trees were constructed using MEGA 11 software with 1000-fold bootstrap resampling. The numbers at the bottom of each tree represent the level of evolution relationship difference between R and S samples after the trimmed end.
Figure A2
Figure A2
Phylogenetic trees of short DNA Sanger Sequencing of SNP KZ288479_95621 from 1022 samples in different categories. (A) Phylogenetic tree of first and second SNP validation of R (resistant) and S (susceptible) of 288 samples from three Apis ceranacerana colonies in Minhou (1 and 2 M); (B) comparison of SNP validation of 384 samples from six colonies (three RC (resistant colonies) in Fuzhou and three CS (colonies susceptible) in Minho). (C) Further SNP validation of 336 samples from different geographic locations from eight colonies (one colony in Putian (P), one colony in Minhou (M), two colonies in Fuzhou (F), one colony in Nanping (N), and three resistant colonies (CR) in Yunnan Province (Y)); and (D) SNP validation at the queen level from 14 colonies (12 colonies in Nanping from three apiaries and two colonies in Fuzhou from one apiary). Neighbor-joining trees were constructed using MEGA 11 software with 1000-fold bootstrap resampling. After trimming, the numbers at the bottom of each tree represent the different levels of evolutionary relationships between the R and S samples.
Figure 1
Figure 1
Screening colonies, infected and uninfected larva, and probability survival function. (A) Screening candidate colonies against seven common bee viruses. Based on RT–PCR detection of viruses, three out of eight colonies were infected with a single virus (CSBV and DWV), two were infected with multiple viruses (CSBV, DWV, and IAPV) in the three colonies, and no virus was detected. (B) Infected larvae on the left ← and resistant larvae (pupae) on the right side → after inoculation with SBV. (C) To assess the efficient infectiousness of the purified virus, a comparison of the survival function of normal colonies with the free virus group with the treatment groups was conducted using a log-rank (Mantel–Cox) test with 95% CI ratio, where a p value of < 0.01 was defined as significantly different. ꭓ2 = 595, df = 1, n = 3 colonies. Each colony comprised 144 larvae with three replicates of the control and treatment groups of nine months. A total of 1296 samples from two groups were included in the data analysis. (D) Comparison of the survival function of the colony-resistant control with that of the treatment groups. ꭓ2 = 115.2, df =1, n = 3 colonies. A total of 864 samples with three replicates from the control and treatment groups were included in the data analysis. (E) Comparison of the survival function of susceptible colonies control with the treatment groups. ꭓ2 = 229.5, df = 1, n = 3 colonies. The data from these comparisons between the control and treatment groups, and between resistant and susceptible colonies and with the control groups, also showed significant differences (p < 0.001). However, comparison analyses of the control groups with the control groups of all colonies were not significantly different (p > 0.01).
Figure 2
Figure 2
Genome variations, annotation, and indel length distribution map in CDS, condign area, and the whole genome. (A) A plot of all SNP annotations. (B) A plot of all indel annotation distributions. (C) Indel length distribution in CDS and the genome. The longitudinal Y-axis coordinates are indel lengths (within 10 bp); greater than 0 is an insertion and less than 0 is a deletion. The horizontal X-axis coordinates are the corresponding quantities. R represents resistance and S represents the susceptibility of 90 samples in the three populations of A. c. cerana.
Figure 3
Figure 3
Venn diagram of unique SNPs, phylogenetic tree, population structure, principle component analysis, and selection signature for resistance to SBV. (A) Venn diagram of unique SNPs and shared SNP genotypes between R and S. By using 1,797,078 VCFs and considering the 50% optimal genotype in the R group, we obtained 9165 unique SNPs in R and S, and 669,114 SNP genotypes were not found to be the cause of 118,801 SNP loci in at least one subgroup that was under 50% optimal genotypes. Such loci were not involved in analyzing the group. (B) A phylogenetic neighbor-joining tree was constructed using 696,352 SNPs with 1000 bootstrap replicates of three populations. (C) Population structure and admixture of 90 samples between R and S from three populations and the cross-validation error rate. The x-axis represents the K values from 1 to 10 and the y-axis represents the cross-validation (CV) errors between 0.38 and 0.48, where the best K was 6. The accessions were divided into ten subgroups (there was a minimum K-value when K = 6); within each subgroup, the accessions were ordered according to the genetic component, and each line gives the subgroup value. Each accession shown as a vertical line partitioned into K colored components represents inferred membership in K genetic clusters. (D) A 3D principle component analysis (PCA) plot was constructed using SNP genotypes of the two groups (R and S) with a 3D plot. (E) Distribution of selective sweep and population differenciaciation index (FST) with nucleotide polymorphism (θπ) ratio selection regions of genes and SNPs for the top 5% R (resistant) and S (susceptible) A. c. cerana larvae and (F) The horizontal coordinate represents the ratio of θπ (π ratio); the vertical coordinate represents the FST value, corresponding to the frequency distribution diagram above and the frequency distribution diagram on the right, respectively; and the dot plot in the middle represents the corresponding ratio of FST to θπ in different windows. Gray represents the whole genome; the red and blue areas at the top are the top 5% regions selected by θπ, the green area is the top 5% region selected by FST, and the blue and red areas in the middle are the intersection of FST and θπ, which are the candidate sites. The distributions of threshold line FST < 0.95, θπ < 1.05, FST, and θπ < 0.95 ratios of the top 5% strong signal region analysis on genome selection of genes were calculated in 10 kb windows sliding in 1 kb steps in R and S, respectively.
Figure 4
Figure 4
Distributions of selective sweep analysis results of significant regions of intersection FST and π ratios between R and S in A. c. cerana larvae that had undergone positive selection the top 5% of the whole genome. (A,B) Comparison analysis of selected regions based on population differentiation index (FST) and nucleotide polymorphisms (π) of the significant intersecting regions (top 5%) of genome variants between R (resistant) larvae and S (susceptible) larvae of A. c. cerana. Data were reanalyzed and plotted from analyzed significance regions.
Figure 5
Figure 5
(A) Clusters of Orthologous Genes (COG); (B) Gene Ontology (GO); (C) KOG (Eukaryotic Orthologous Groups)), and (D) Kyoto Encyclopedia of Genes and Genomes (KEGG) of top 5% population differentiation index (FST) and nucleotide polymorphisms (π) in A. c. cerana.

Similar articles

References

    1. Klatt B.K., Holzschuh A., Westphal C., Clough Y., Smit I., Pawelzik E., Tscharntke T. Bee Pollination Improves Crop Quality, Shelf Life and Commercial Value. Proc. R. Soc. B Biol. Sci. 2013;281:20132440. doi: 10.1098/rspb.2013.2440. - DOI - PMC - PubMed
    1. Potts S.G., Biesmeijer J.C., Kremen C., Neumann P., Schweiger O., Kunin W.E. Global Pollinator Declines: Trends, Impacts and Drivers. Trends Ecol. Evol. 2010;25:345–353. doi: 10.1016/j.tree.2010.01.007. - DOI - PubMed
    1. McMenamin A.J., Genersch E. Honey Bee Colony Losses and Associated Viruses. Curr. Opin. Insect Sci. 2015;8:121–129. doi: 10.1016/j.cois.2015.01.015. - DOI - PubMed
    1. Bailey L., Gibbs A.J., Woods R.D. Sacbrood Virus of the Larval Honey Bee (Apis mellifera Linnaeus) Virology. 1964;23:425–429. doi: 10.1016/0042-6822(64)90266-1. - DOI - PubMed
    1. Ellis J.D., Munn P.A. The Worldwide Health Status of Honey Bees. Bee World. 2005;86:88–101. doi: 10.1080/0005772X.2005.11417323. - DOI

Supplementary concepts