. 2023 Mar 27;24(7):6276.
doi: 10.3390/ijms24076276.

Plasma Proteomics Unveil Novel Immune Signatures and Biomarkers upon SARS-CoV-2 Infection

Affiliations

Plasma Proteomics Unveil Novel Immune Signatures and Biomarkers upon SARS-CoV-2 Infection

Víctor Urbiola-Salvador et al. Int J Mol Sci. .

Abstract

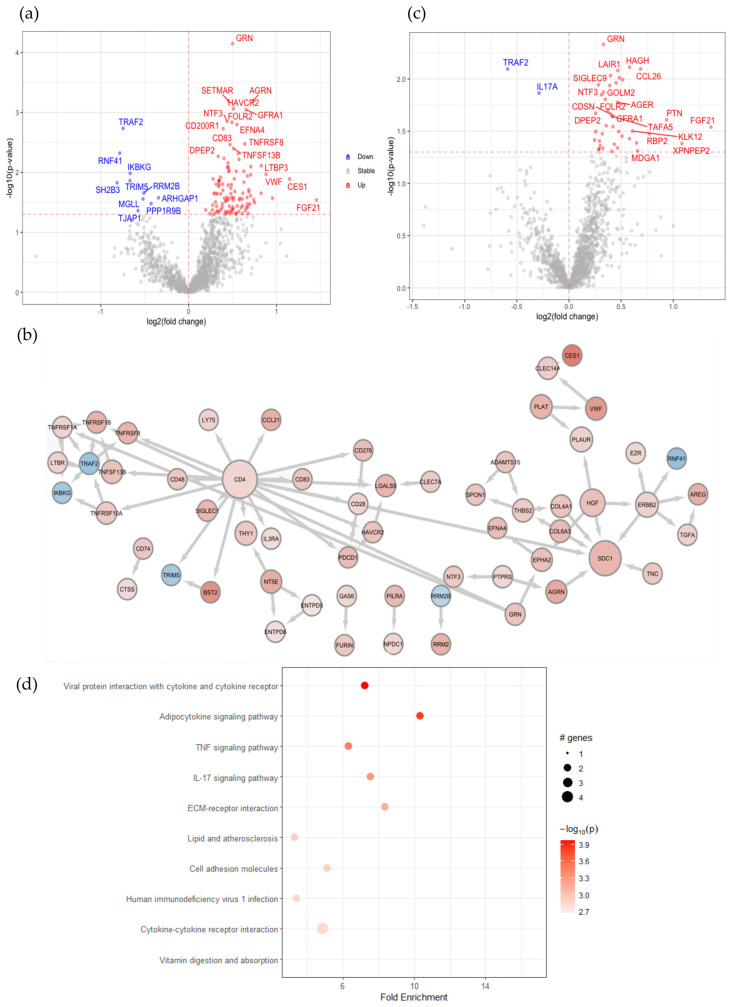
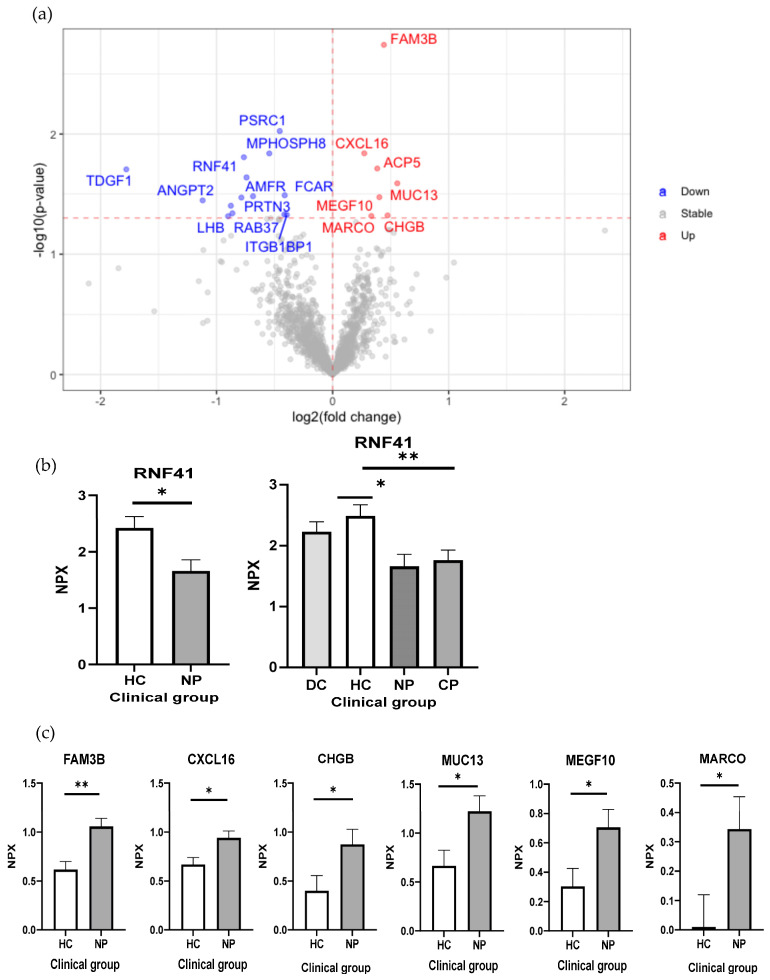
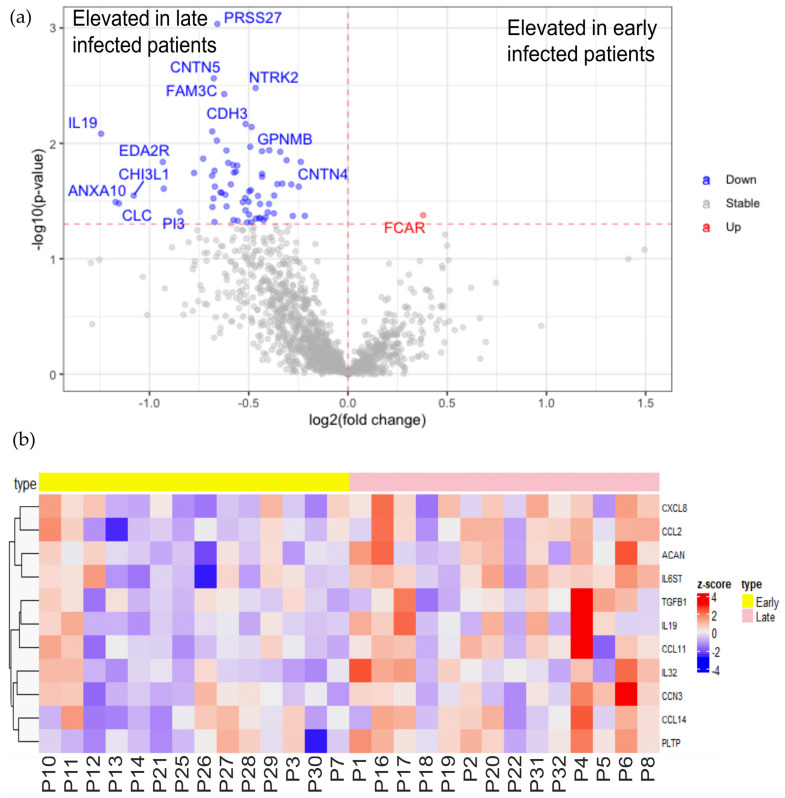
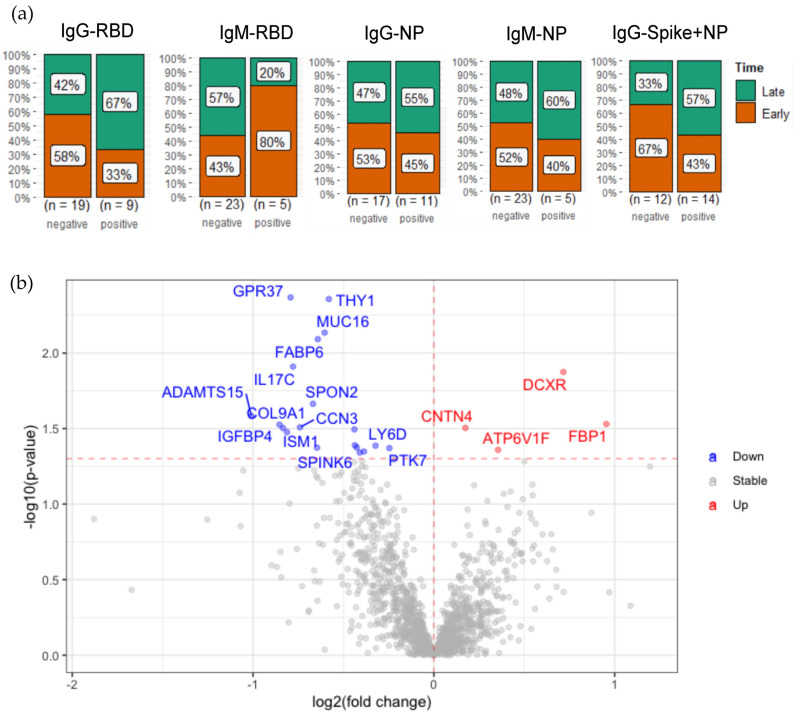
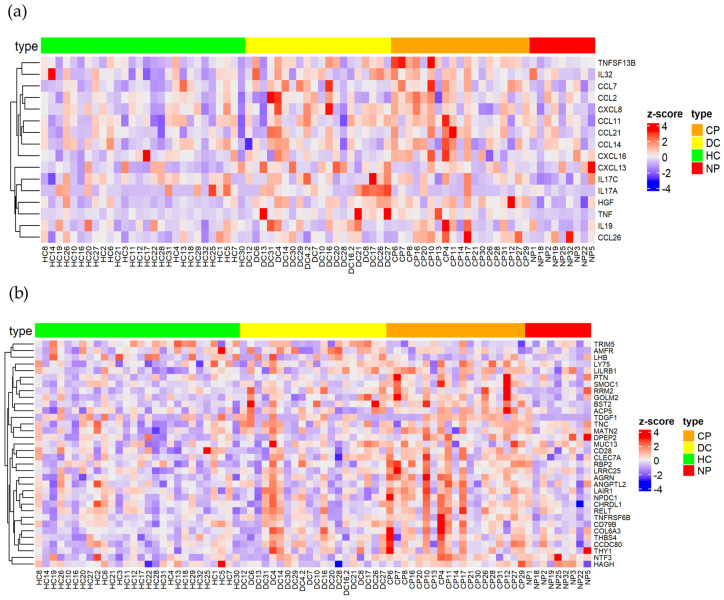
Several elements have an impact on COVID-19, including comorbidities, age and sex. To determine the protein profile changes in peripheral blood caused by a SARS-CoV-2 infection, a proximity extension assay was used to quantify 1387 proteins in plasma samples among 28 Finnish patients with COVID-19 with and without comorbidities and their controls. Key immune signatures, including CD4 and CD28, were changed in patients with comorbidities. Importantly, several unreported elevated proteins in patients with COVID-19, such as RBP2 and BST2, which show anti-microbial activity, along with proteins involved in extracellular matrix remodeling, including MATN2 and COL6A3, were identified. RNF41 was downregulated in patients compared to healthy controls. Our study demonstrates that SARS-CoV-2 infection causes distinct plasma protein changes in the presence of comorbidities despite the interpatient heterogeneity, and several novel potential biomarkers associated with a SARS-CoV-2 infection alone and in the presence of comorbidities were identified. Protein changes linked to the generation of SARS-CoV-2-specific antibodies, long-term effects and potential association with post-COVID-19 condition were revealed. Further study to characterize the identified plasma protein changes from larger cohorts with more diverse ethnicities of patients with COVID-19 combined with functional studies will facilitate the identification of novel diagnostic, prognostic biomarkers and potential therapeutic targets for patients with COVID-19.

Keywords: COVID-19; SARS-CoV-2; biomarker; immune signature; plasma proteomics.


Conflict of interest statement

The authors declare no conflict of interest. The funders had no role in the design of the study; in the collection, analyses, or interpretation of data; in the writing of the manuscript; or in the decision to publish the results.

Figures

Figure 1
Figure 1
SARS-CoV-2 infection in patients with comorbidities causes plasma protein changes with enhanced soluble CD4 and associated proteins. (a) Volcano plot of statistical significance against fold-change of proteins between SARS-CoV-2 virus-infected patients with comorbidities and healthy controls. Colored dots indicate statistically differentially expressed proteins (DEPs); (b) protein–protein interaction network of DEPs between SARS-CoV-2 virus-infected patients with comorbidities and healthy controls with the organic layout from the STRING database query with a 0.7 confidence cut-off. The size of nodes indicates the degree of connectivity of the nodes; (c) volcano plot of statistical significance against fold-change of proteins between SARS-CoV-2 virus-infected patients with comorbidities and paired disease controls. Dots indicate statistical DEPs; (d) dot plot of KEGG pathway enrichment combined with STRING protein–protein interaction network analysis from DEPs between patients and disease controls. (ac) The red and blue dots represent upregulation and downregulation in patients, respectively.
Figure 2
Figure 2
Reduced plasmas level of RNF41 is associated with SARS-CoV-2 infection. (a) Volcano plot of statistical significance against fold-change of proteins between patients without comorbidities and healthy controls. The red (upregulated in patients without comorbidities) and blue (downregulated in patients without comorbidities) dots indicate statistical DEPs; (b) bar plots with normalized protein expression of RNF41 among different clinical groups; (c) bar plots with normalized protein expression of FAM3B, CXCL16, CHGB, MUC13, MEGF10 and MARCO in patients without comorbidities and their respective healthy controls. * and ** indicate statistically significant with an adjusted p-value < 0.05 and <0.01, respectively. CP, comorbidities patient; DC, disease control; HC; healthy control; NP, non-comorbidities patient; NPX, normalized protein expression.
Figure 3
Figure 3
Characterization of long-term plasma protein responses associated with SARS-CoV-2 infection. (a) Volcano plot of statistical significance against fold-change of proteins between patients with plasma samples collected less than 3 months after infection (early) and collected more than 3 months after infection (late). Red (upregulated in patients with early collection) and blue (upregulated in patients with late collected plasma) dots indicate statistically DEPs; (b) heatmap of selected statistical DEPs between patients with plasma collected less than 3 months after infection (early) and collected more than 3 months after infection (late) with z-score by row normalization and distributed by hierarchical clustering.
Figure 4
Figure 4
Plasma protein changes associated with SARS-CoV-2 antibody generation. (a) Bar plots represent the percentage of patients with positive and negative antibody generation for different SARS-CoV-2 antigens from patients with early-collected plasma (<3 months) and late-collected plasma (>3 months); (b) volcano plot of statistical significance against fold-change of proteins between patients with positive antibody generation and patients with negative antibody generation. The red (upregulated in patients with positive antibody generation) and blue (downregulated in patients with positive antibody generation) dots statistically indicate DEPs.
Figure 5
Figure 5
Identification of key immune signatures and novel proteins after SARS-CoV-2 infection. (a) Heatmap of differentially expressed cytokines and (b) novel protein changes among different clinical groups (patients with and without comorbidities, disease controls, and healthy controls) with z-score by row normalization and distributed by hierarchical clustering.

Similar articles

Cited by

References

    1. WHO . COVID-19 Weekly Epidemiological Update. World Health Organization; Geneva, Switzerland: 2022. pp. 1–23.
    1. Pietro R.D., Calcagno S., Biondi-Zoccai G., Versaci F. Is COVID-19 the deadliest event of the last century? Eur. Heart J. 2021;42:2876–2879. doi: 10.1093/eurheartj/ehab083. - DOI - PMC - PubMed
    1. Bergamaschi L., Mescia F., Turner L., Hanson A.L., Kotagiri P., Dunmore B.J., Ruffieux H., De Sa A., Huhn O., Morgan M.D., et al. Longitudinal analysis reveals that delayed bystander CD8+ T cell activation and early immune pathology distinguish severe COVID-19 from mild disease. Immunity. 2021;54:1257–1275.e8. doi: 10.1016/j.immuni.2021.05.010. - DOI - PMC - PubMed
    1. Jamilloux Y., Henry T., Belot A., Viel S., Fauter M., El Jammal T., Walzer T., François B., Sève P. Should we stimulate or suppress immune responses in COVID-19? Cytokine and anti-cytokine interventions. Autoimmun. Rev. 2020;19:102567. doi: 10.1016/j.autrev.2020.102567. - DOI - PMC - PubMed
    1. Cao X. COVID-19: Immunopathology and its implications for therapy. Nat. Rev. Immunol. 2020;20:269–270. doi: 10.1038/s41577-020-0308-3. - DOI - PMC - PubMed