. 2023 Mar 27;24(7):6284.
doi: 10.3390/ijms24076284.

An Innovative Fluid Dynamic System to Model Inflammation in Human Skin Explants

Affiliations

An Innovative Fluid Dynamic System to Model Inflammation in Human Skin Explants

Andrea Galvan et al. Int J Mol Sci. .

Abstract

Skin is a major administration route for drugs, and all transdermal formulations must be tested for their capability to overcome the cutaneous barrier. Therefore, developing highly reliable skin models is crucial for preclinical studies. The current in vitro models are unable to replicate the living skin in all its complexity; thus, to date, excised human skin is considered the gold standard for in vitro permeation studies. However, skin explants have a limited life span. In an attempt to overcome this problem, we used an innovative bioreactor that allowed us to achieve good structural and functional preservation in vitro of explanted human skin for up to 72 h. This device was then used to set up an in vitro inflammatory model by applying two distinct agents mimicking either exogenous or endogenous stimuli: i.e., dithranol, inducing the contact dermatitis phenotype, and the substance P, mimicking neurogenic inflammation. Our in vitro system proved to reproduce inflammatory events observed in vivo, such as vasodilation, increased number of macrophages and mast cells, and increased cytokine secretion. This bioreactor-based system may therefore be suitably and reliably used to simulate in vitro human skin inflammation and may be foreseen as a promising tool to test the efficacy of drugs and cosmetics.

Keywords: bioreactor; cytokines; dithranol; in vitro tissue preservation; light microscopy; macrophages; mast cells; substance P; transmission electron microscopy; vasodilation.


Conflict of interest statement

The authors declare no conflict of interest.

Figures

Figure 1
Figure 1
Bright-field microscopy images of human skin samples at T0 (a) and after 24 h (b), 48 h (c) and 72 h (d) in the bioreactor. E, epidermis; P, papillary dermis; R, reticular dermis. In the epidermis, arrowheads indicate the corneocytes’ layer, asterisks indicate the keratinocytes’ layers and arrows the dermal papillae. Bars: 50 µm.
Figure 2
Figure 2
TEM micrographs of control (untreated) human skin explants at T0 (immediately after excision) and after 24 h and 72 h in the bioreactor. Note the good preservation of the outer epidermis layer (ac), with clearly recognizable corneocytes (C) and keratinocytes (K), and the basal epidermis layer (df), where keratinocytes (K) are connected to the dermis (D) by the basal membrane (asterisks). Insets show intercellular junctions (arrowheads) between keratinocytes; intracellular junctions are present also between keratinocytes of the basal layer (arrowheads in (d,e)). The papillary dermis (gi) also shows good preservation, with fibroblasts (F) surrounded by collagen bundles (stars). Bars: 1 µm (ai); 200 nm (insets in (ac)).
Figure 3
Figure 3
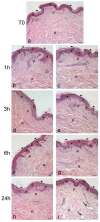
Bright-field microscopy images of human skin samples at T0 (a) and after 1 h (b,c), 3 h (d,e), 6 h (f,g) and 24 h (h,i) in the bioreactor in the presence of dithranol (c,e,g,i) or without dithranol as controls) (b,d,f,h). E, epidermis; P, papillary dermis; R, reticular dermis. In the epidermis, arrowheads indicate the corneocytes’ layer, asterisks indicate the keratinocytes’ layers and small arrows the dermal papillae. Note the dilated capillaries in (i) (arrows). Bars: 50 µm.
Figure 4
Figure 4
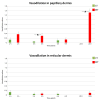
Mean ± standard error values of vasodilation in the papillary and reticular dermis. Asterisks indicate significant difference (3 h CT vs. 3 h DIT, p = 0.043; 24 h CT vs. 24 h DIT, p < 0.001). CT, control (untreated); DIT, dithranol-treated.
Figure 5
Figure 5
(a) Mast cells stained with the acidified toluidine blue method (arrows); note the red-violet granules. Bar: 20 µm. (b,c) Mean ± standard error values of mast cell number in papillary (b) and reticular (c) dermis. Asterisks indicate significant difference. In papillary dermis: 1 h CT vs. 1 h DIT, p = 0.028; 24 h CT vs. 24 h DIT, p = 0.001). In reticular dermis: 3 h CT vs. 3 h DIT, p < 0.001. CT, control (untreated); DIT, dithranol-treated.
Figure 6
Figure 6
(a) Skin sample treated with dithranol for 24 h and immunolabelled with anti-CD68 antibody. Labeled macrophages are indicated by arrows. Bar: 50 µm. (b,c) Mean ± standard error values of macrophage number in papillary (b) and reticular (c) dermis. Asterisks indicate significant difference (3 h CT vs. 3 h DIT, p = 0.032; 24 h CT vs. 24 h DIT, p = 0.003). CT, control (untreated); DIT, dithranol-treated.
Figure 7
Figure 7
(a) Skin sample untreated (left) and treated with dithranol for 1 h (right); immunolabelling with anti-COX-2 antibody. Keratinocytes of the treated sample show an evident signal (arrows). Bars: 50 µm. (b) Mean ± standard error values of labeling values. Asterisks indicate significant difference (3 h CT vs. 3 h DIT, p < 0.001; 6 h CT vs. 6 h DIT, p = 0.013; 24 h CT vs. 24 h DIT, p = 0.009). CT, control (untreated); DIT, dithranol-treated.
Figure 8
Figure 8
TEM micrographs of human skin explants treated with dithranol and maintained in the bioreactor for 24 h. The epidermis (a) is generally well preserved both in the upper layer (a) and in the basal layer (b), especially the intercellular junctions between keratinocytes (inset in (a)) and the basal membrane (asterisks in (b)). However, the corneocyte (C) layers appear loosened, whereas, in the keratinocytes (K), some swollen mitochondria occurred (thin arrows). In the dermis (D), macrophages (M) containing many vacuoles were frequently found (b). In (c), four mast cells (arrows) occur in close proximity to a capillary vessel (V). In (d), a higher magnification of c shows a mast cell (MC) that underwent partial degranulation (star). F, fibroblasts; P, polymorphonuclear leukocyte; E, erythrocytes. Bars: 1 µm (ad); 200 nm (inset in (a)).
Figure 9
Figure 9
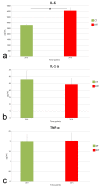
(a) Mean ± standard error values of IL-6 in culture medium of samples treated with dithranol. Asterisk indicates significant difference (p = 0.028). (b) Mean ± standard error values of IL-1alpha in culture medium of samples treated with dithranol. No significant difference was found. (c) Mean ± standard error values of TNF-1alpha in culture medium of samples treated with dithranol. No significant difference was found. CT, control (untreated); DIT, dithranol-treated.
Figure 10
Figure 10
Bright-field microscopy images of human skin samples at T0 (a) and after 24 h (b,c), 48 h (d,e) and 72 h (f,g) in the bioreactor in the presence of substance P (c,e,g) or without substance P as controls (b,d,f). Note the dilated capillaries in (c,e,g) (arrows). Bars: 50 µm.
Figure 11
Figure 11
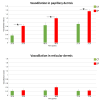
Mean ± standard error values of vasodilation in papillary and reticular dermis. Asterisks indicate significant difference (24 h CT vs. 24 h SP, p < 0.001; 48 h CT vs. 48 h SP, p < 0.007; 72 h CT vs. 72 h SP, p < 0.001). CT, control (untreated); SP, substance P-treated.
Figure 12
Figure 12
Mean ± standard error values of mast cell number in papillary and reticular dermis. Asterisks indicate significant difference. In papillary dermis: 24 h CT vs. 24 h SP, p = 0.015; 48 h CT vs. 48 h SP, p = 0.017). In reticular dermis: 48 h CT vs. 48 h SP, p = 0.035. CT, control (untreated); SP, substance P-treated.
Figure 13
Figure 13
Mean ± standard error values of macrophage number in papillary and reticular dermis. Asterisks indicate significant difference (24 h CT vs. 24 h SP, p = 0.036; 48 h CT vs. 48 h SP, p = 0.050). CT, control (untreated); SP, substance P-treated.
Figure 14
Figure 14
Mean ± standard error values of anti-COX-2 labeling values. Asterisks indicate significant difference (24 h CT vs. 24 h SP, p = 0.007). CT, control (untreated); SP, substance P-treated.
Figure 15
Figure 15
TEM micrographs of human skin explants treated with substance P and maintained in the bioreactor for 72 h. The epidermis (a) is preserved both in the upper layer (a) and in the basal layer (b), although some vacuolization is present in keratinocytes (K). Note the well-preserved intercellular junctions between corneocytes (arrows in (a)) and keratinocytes (K) (arrow in (b)) as well as the basal membrane (asterisks in (b)). (c) A macrophage contains many vacuoles. (d) A mast cell shows partial degranulation (star). D, dermis. Bars: 1 µm.
Figure 16
Figure 16
(a) Mean ± standard error values of IL-6 in culture medium of samples treated with substance P. Asterisks indicate significant difference (24 h CT vs. 24 h SP, p = 0.048; 48 h CT vs. 48 h SP, p = 0.040). (b) Mean ± standard error values of IL-1 alpha in culture medium of samples treated with substance P. Asterisks indicate significant difference (48 h CT vs. 48 h SP, p = 0.031; 72 h CT vs. 72 h SP, p = 0.042). (c) Mean ± standard error values of TNF-alpha in culture medium of samples treated with substance P. No significant difference was found. CT, control (untreated); SP, substance P -treated.

Similar articles

Cited by

References

    1. Hwa C., Bauer E.A., Cohen D.E. Skin biology. Dermatol. Ther. 2011;24:464–470. doi: 10.1111/j.1529-8019.2012.01460.x. - DOI - PubMed
    1. Vitorino C., Sousa J., Pais A. Overcoming the skin permeation barrier: Challenges and opportunities. Curr. Pharm. Des. 2015;21:2698–2712. doi: 10.2174/1381612821666150428124053. - DOI - PubMed
    1. Gorzelanny C., Mess C., Schneider S.W., Huck V., Brandner J.M. Skin Barriers in Dermal Drug Delivery: Which Barriers Have to Be Overcome and How Can We Measure Them? Pharmaceutics. 2020;12:684. doi: 10.3390/pharmaceutics12070684. - DOI - PMC - PubMed
    1. Ng K.W., Lau W.M. Skin deep: The basics of human skin structure and drug penetration. In: Dragicevic N., Maibach H.I., editors. Percutaneous Penetration Enhancers: Chemical Methods in Penetration Enhancement. Springer; Berlin/Heidelberg, Germany: 2015. pp. 3–11. - DOI
    1. Russell W.M.S., Burch R.L. The Principles of Humane Experimental Technique. 1st ed. Methuen & Co.; London, UK: 1959. pp. 1–252.

Substances

LinkOut - more resources