. 2023 Mar 28;24(7):6315.
doi: 10.3390/ijms24076315.

Next Generation of Ovarian Cancer Detection Using Aptamers

Affiliations

Next Generation of Ovarian Cancer Detection Using Aptamers

Rayane da Silva Abreu et al. Int J Mol Sci. .

Abstract

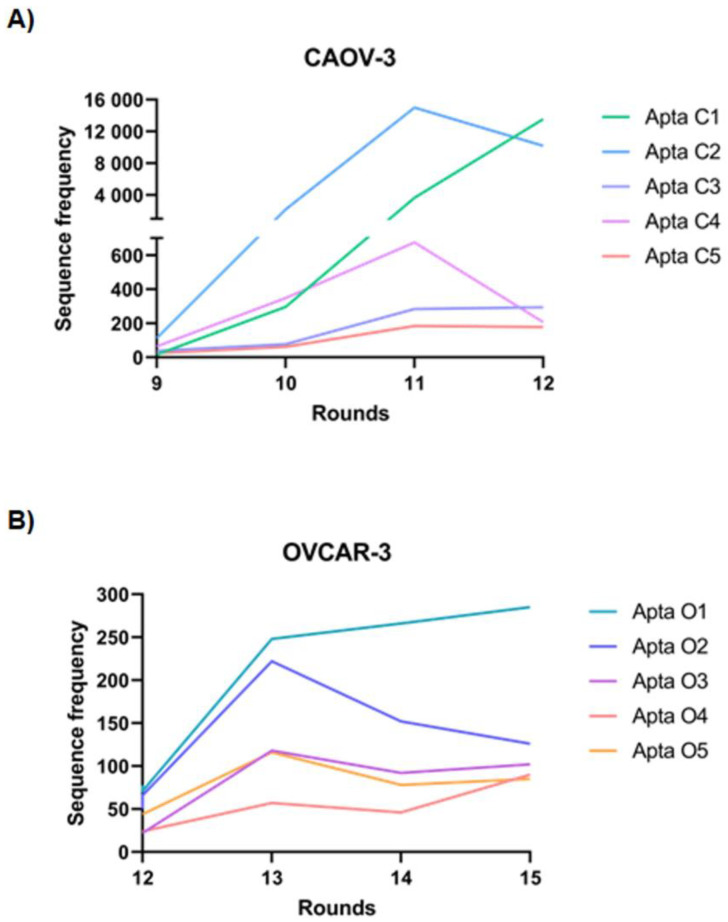
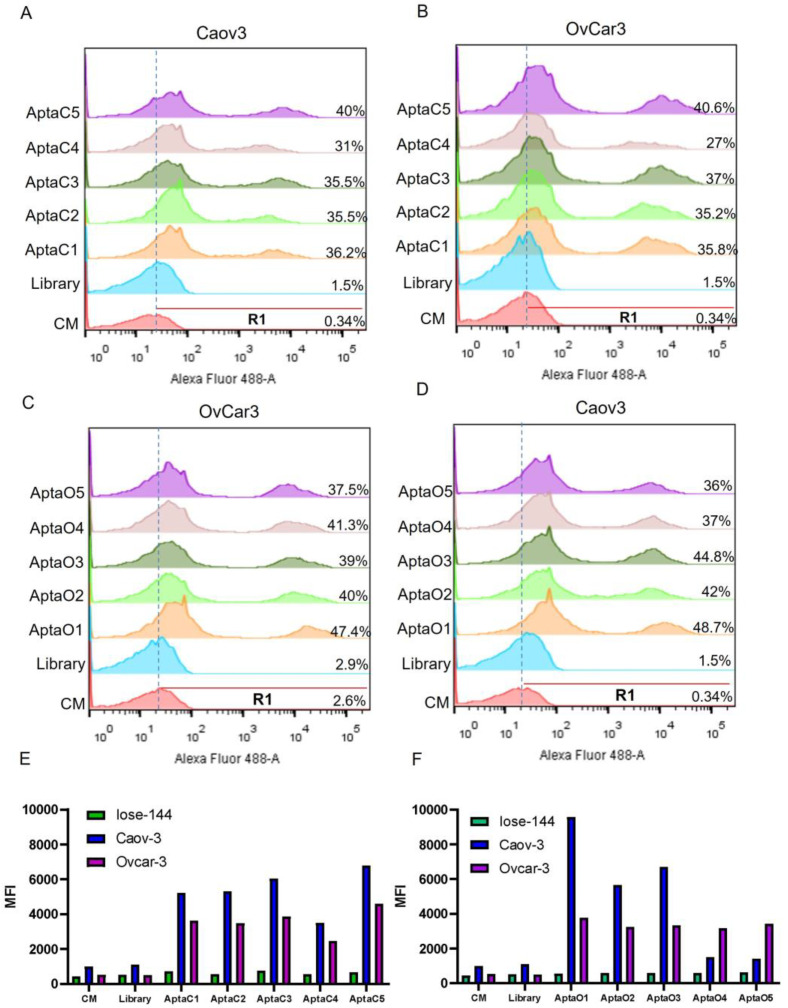
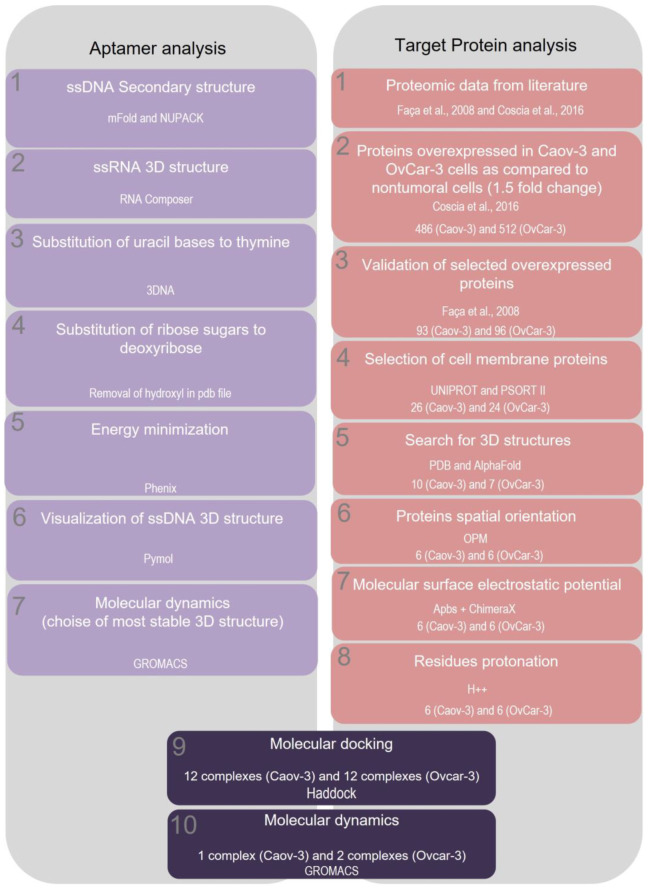
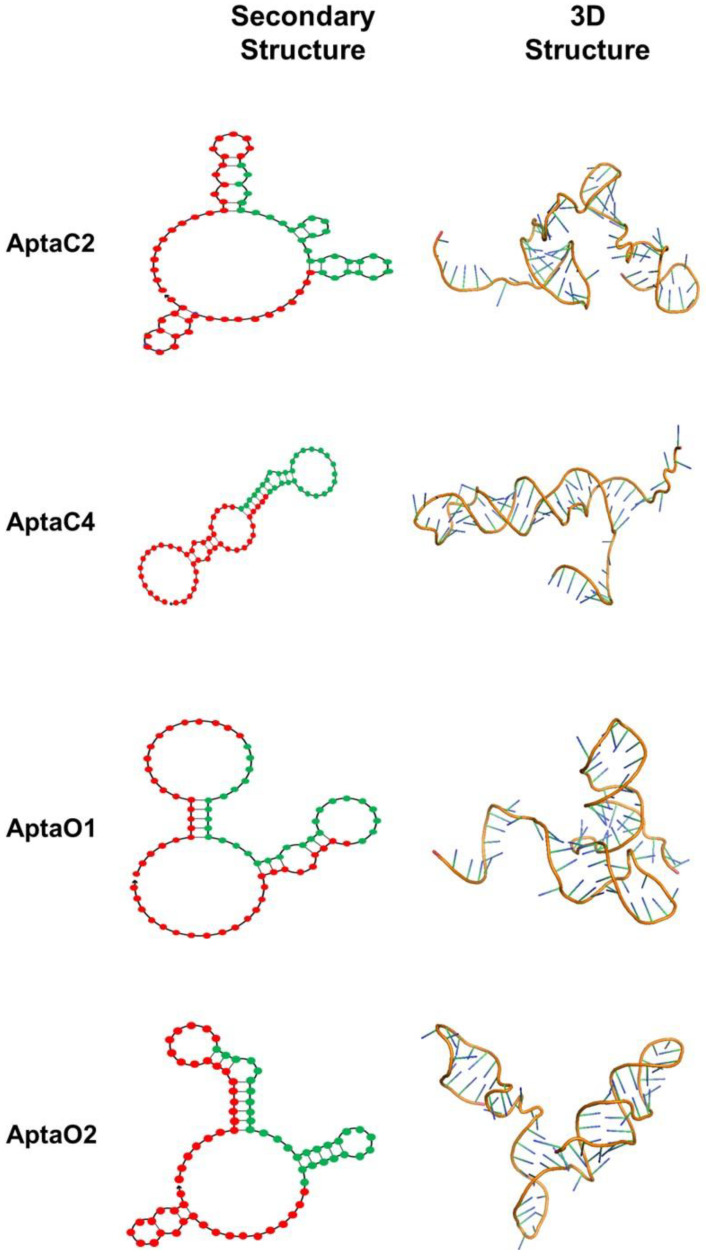
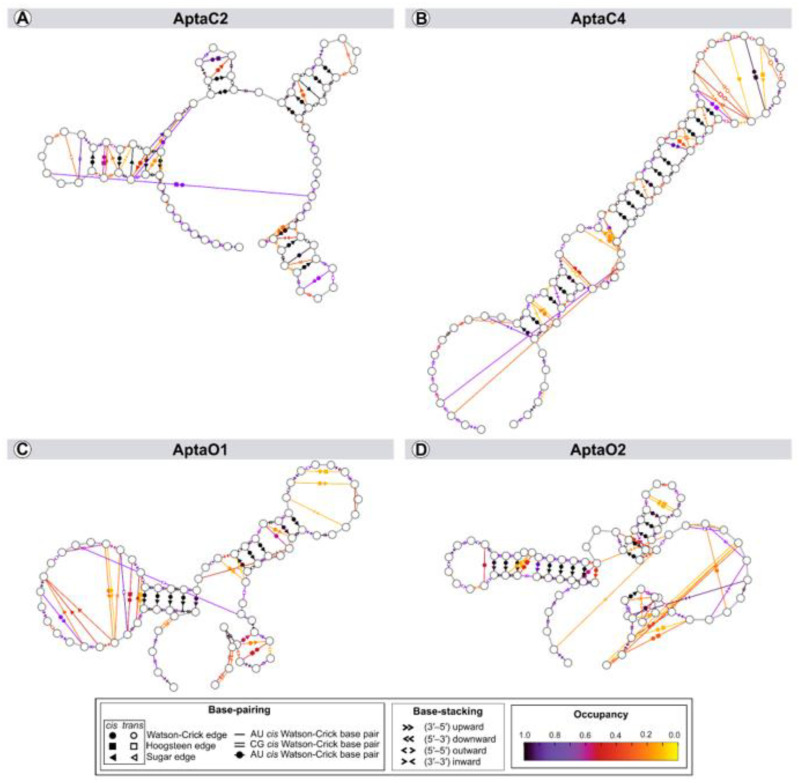
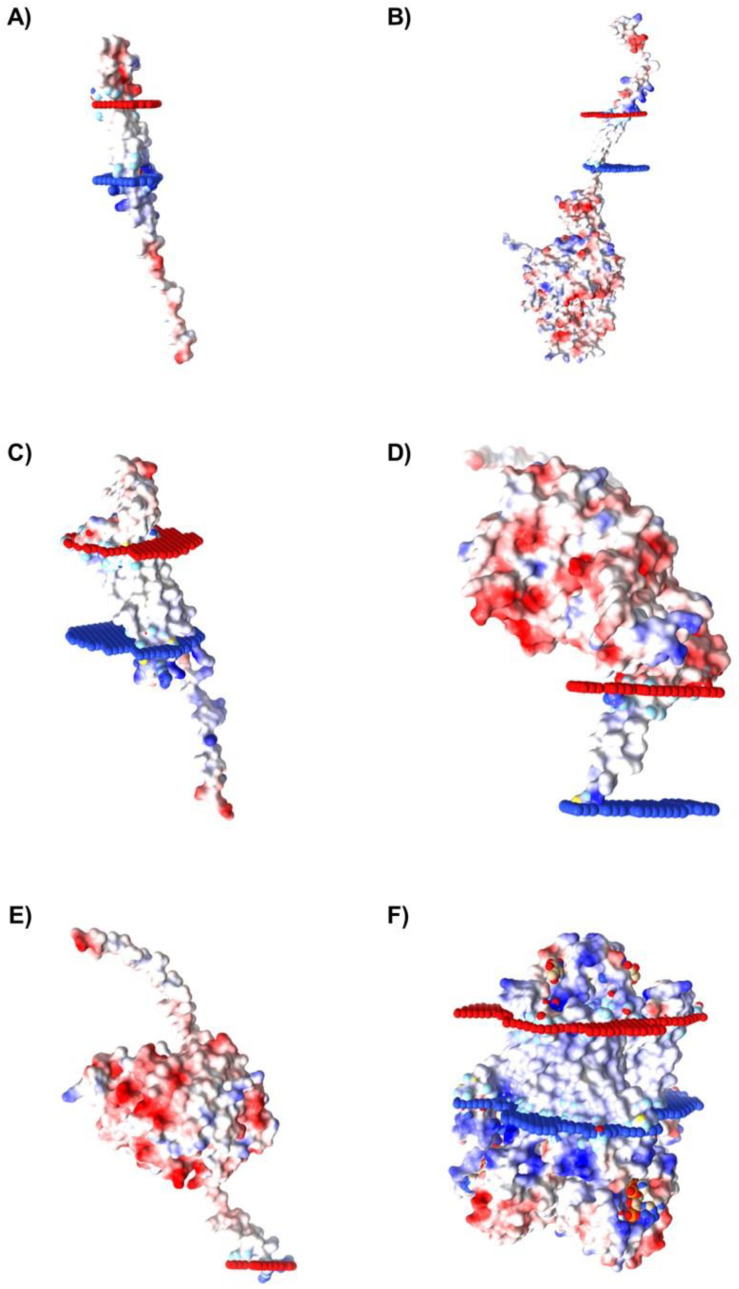
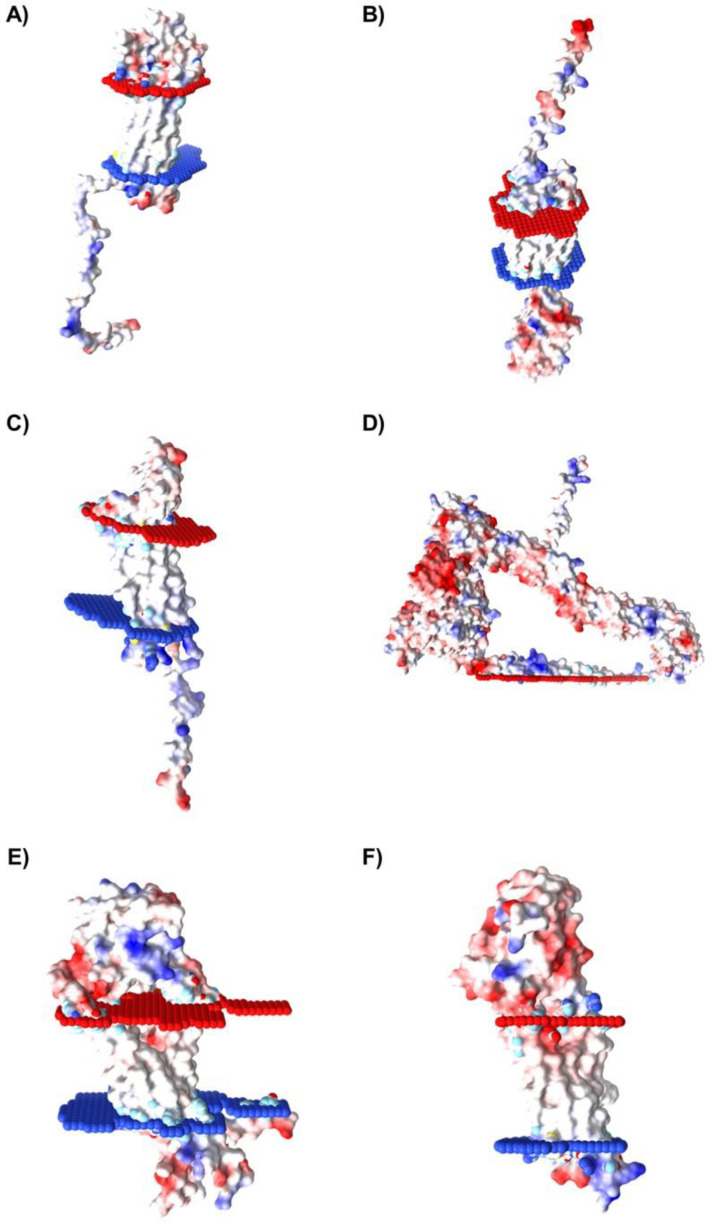
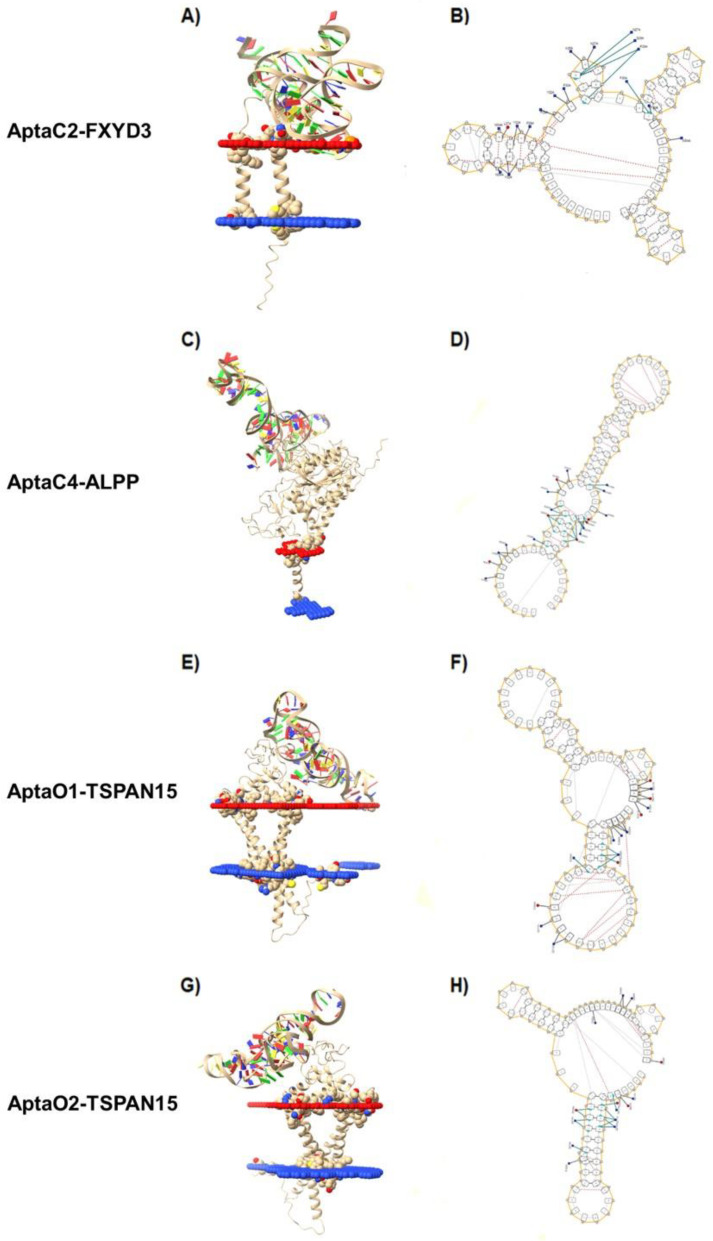
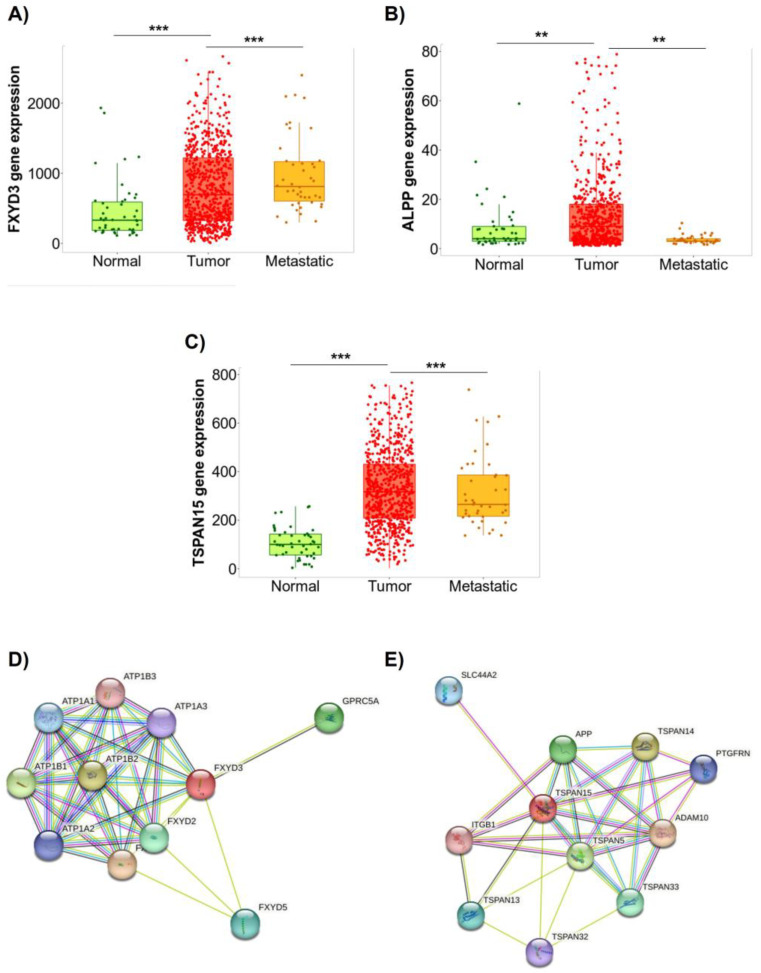
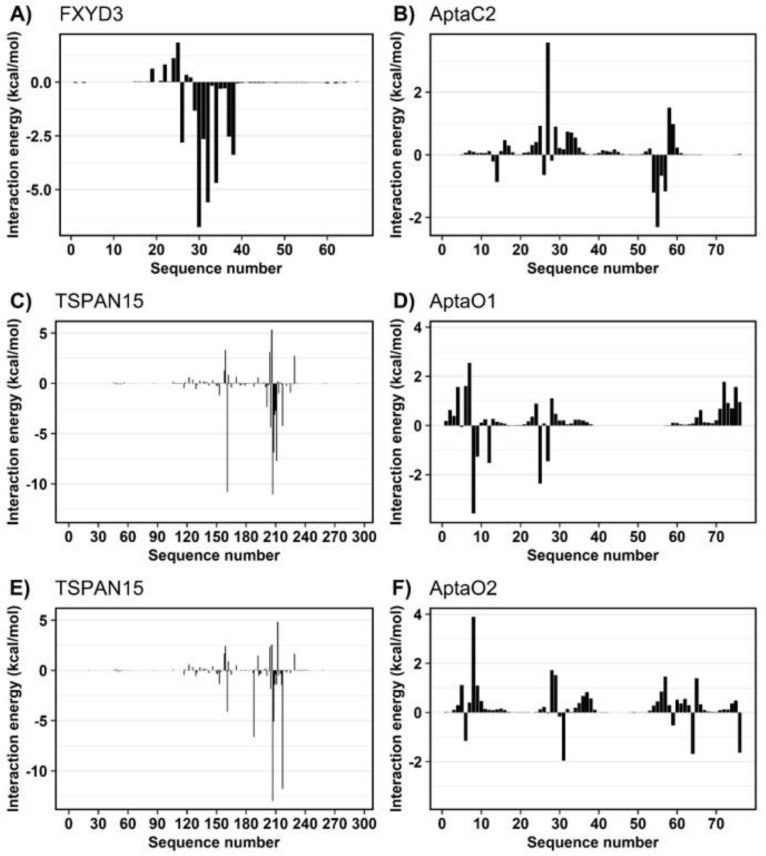
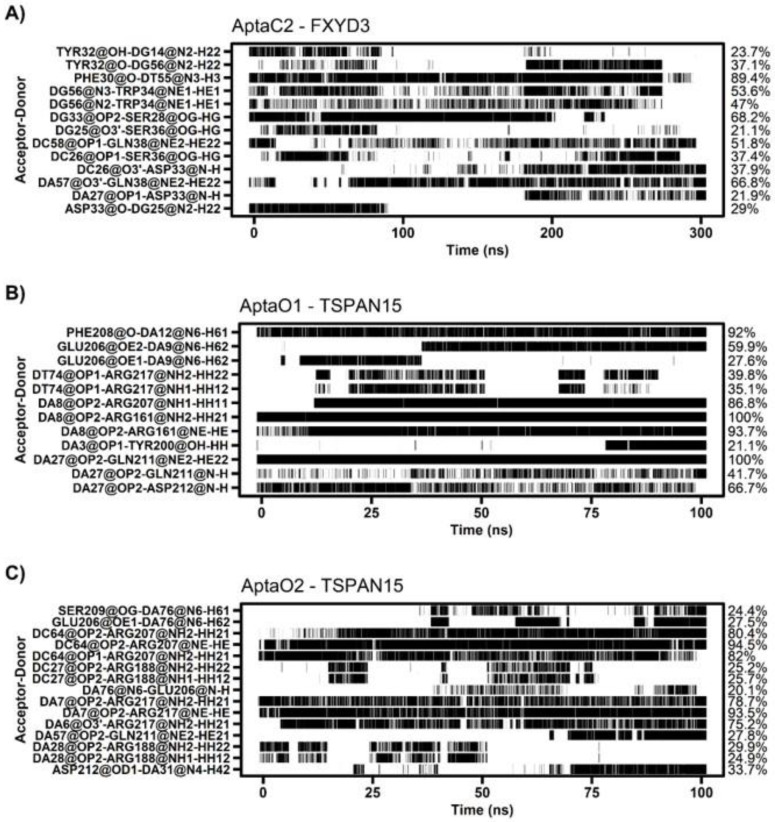
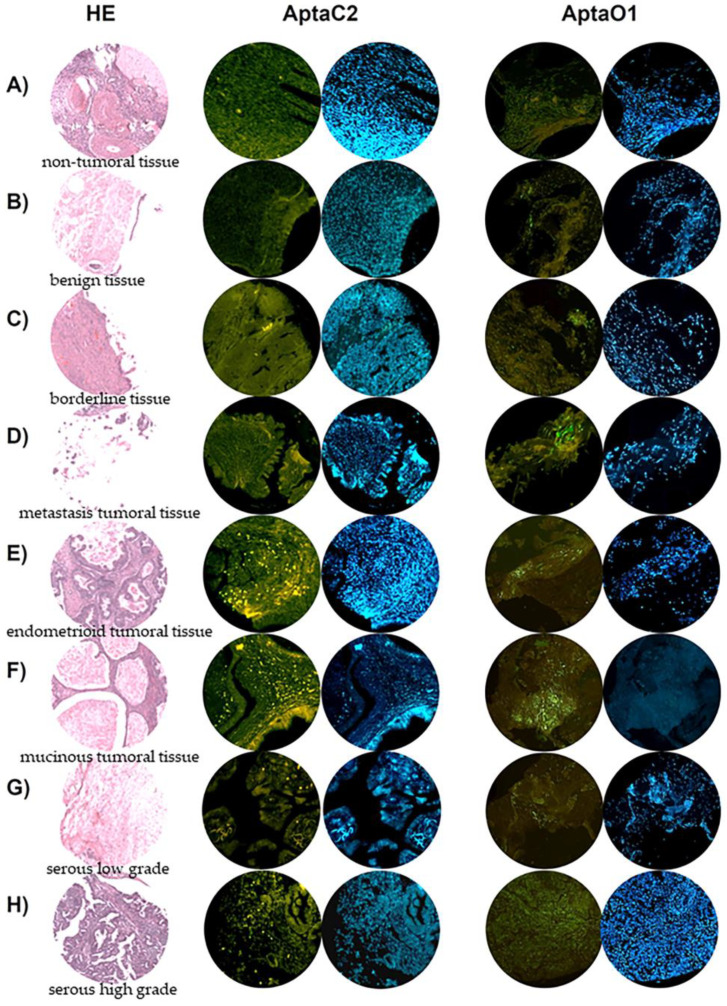
Ovarian cancer is among the seven most common types of cancer in women, being the most fatal gynecological tumor, due to the difficulty of detection in early stages. Aptamers are important tools to improve tumor diagnosis through the recognition of specific molecules produced by tumors. Here, aptamers and their potential targets in ovarian cancer cells were analyzed by in silico approaches. Specific aptamers were selected by the Cell-SELEX method using Caov-3 and OvCar-3 cells. The five most frequent aptamers obtained from the last round of selection were computationally modeled. The potential targets for those aptamers in cells were proposed by analyzing proteomic data available for the Caov-3 and OvCar-3 cell lines. Overexpressed proteins for each cell were characterized as to their three-dimensional model, cell location, and electrostatic potential. As a result, four specific aptamers for ovarian tumors were selected: AptaC2, AptaC4, AptaO1, and AptaO2. Potential targets were identified for each aptamer through Molecular Docking, and the best complexes were AptaC2-FXYD3, AptaC4-ALPP, AptaO1-TSPAN15, and AptaO2-TSPAN15. In addition, AptaC2 and AptaO1 could detect different stages and subtypes of ovarian cancer tissue samples. The application of this technology makes it possible to propose new molecular biomarkers for the differential diagnosis of epithelial ovarian cancer.

Keywords: aptamers; computational modeling; ovarian cancer.


Conflict of interest statement

The authors declare no conflict of interest. The funders had no role in the design of the study; in the collection, analyses, or interpretation of data; in the writing of the manuscript; or in the decision to publish the results.

Figures

Figure 1
Figure 1
Graph demonstrating the enrichment of the five most abundant individual aptamers in the last rounds of Cell-Selex. (A) Aptamers frequency selected for Caov-3 cell line: AptaC1, AptaC2, AptaC3, AptaC4, and AptaC5 over the R9, R10, R11, and R12 rounds. (B) Aptamers frequency selected for OvCar-3 cell line: AptaO1, AptaO2, AptaO3, AptaO4, and AptaO5 over the R12, R13, R14, and R15 rounds.
Figure 2
Figure 2
Specificity evaluation of the five most abundant individual aptamers in the last round. Labeling Intensity of the five individual aptamers selected for Caov-3 AptaC1, AptaC2, AptaC3, AptaC4, and AptaC5 in: (A) Caov-3 cells, and (B) Ovcar-3 cells. Labeling Intensity of the five individual aptamers selected for Ovcar-3: AptaO1, AptaO2, AptaO3, AptaO4, and AptaO5 in (C) Ovcar-3 cells and (D) Caov-3 cells. Graph demonstrating the Median Fluorescence Intensity (MFI) of the five individual aptamers selected for (E) Caov-3 and (F) Ovcar-3 in Iose-144 non-tumor control cells and Caov-3 and Ovcar-3 tumor cells. Negative controls correspond to culture medium (CM) and unbound unspecific aptamers from the first round of selection (Library).
Figure 3
Figure 3
Workflow demonstrating the sequential steps for aptamer analysis and potential protein target analysis. Proteomic data was obtained by Coscia et al., 2016 and Faça et al., 2008 [16,17].
Figure 4
Figure 4
Characterization of secondary and tertiary aptamer structures. The aptamers from Caov-3 (AptaC2 and AptaC4) and from OvCar-3 (AptaO1 and AptaO2), presenting the lower ΔG, were described. In the secondary structures, the nucleotides marked in red correspond to the adapter sequences, while the nucleotides marked in green correspond to the central core N30.
Figure 5
Figure 5
Root-mean-square deviations (A) and radius of gyration (B) throughout the molecular simulations. Aptamer structure representations corresponding to the initial production structure and the central structure resulting from clustering analysis of simulation are displayed within each plot. The regions of the adapter and central core are depicted in blue and red, respectively.
Figure 6
Figure 6
Dynamic secondary structure representation of aptamers AptaC2 (A); AptaC4 (B); AptaO1 (C); and AptaO2 (D). The extended secondary structure annotation follows the Leontis–Westhof classification (see legend caption). The color scheme shows the fraction of frames (occupancy) within the system for which the interaction was formed.
Figure 7
Figure 7
Membrane regions’ spatial distribution and electrostatic potential determination of proteins identified for Caov-3 cell line. The proteins selected for Caov-3 cells were: (A) FXYD3, (B) ITGB2, (C) CLDN7, (D) ALPP, (E) SMPDL3B, and (F) STEAP4. For the spatial orientation, the red portion indicates the extracellular region, and the blue portion indicates the intracellular region. For the electrostatic potential determination, blue color indicates a positive charge and red color indicates a negative charge.
Figure 8
Figure 8
Membrane regions spatial distribution and electrostatic potential of proteins identified for OvCar-3 cell line. The proteins selected for OvCar-3 cells were: (A) CLDN6, (B) CD47, (C) CLDN7, (D) EPHA1, (E) TSPAN15, and (F) UPK1B. For the spatial orientation, the red portion indicates the extracellular region, and the blue portion indicates the intracellular region. For the electrostatic potential evaluation, blue color indicates a positive charge and red color indicates a negative charge.
Figure 9
Figure 9
The best binding complexes for potential protein targets in Caov-3 and OvCar-3 cell lines. Image representing the best clusters from molecular docking for: (A) AptaC2-FXYD3, (C) AptaC4-ALPP, (E) AptaO1-TSPAN15, and (G) AptaO2-TSPAN15. Residues and interactions between the binding complexes: (B) AptaC2-FXYD3, (D) AptaC4-ALPP, (F) AptaO1-TSPAN15, and (H) AptaO2-TSPAN15.
Figure 10
Figure 10
Gene expression profile of the selected targets in ovarian cancer and PPI network analysis. Samples from ovarian cancer patients comparing normal, primary site tumor, and metastatic tissues from genetic chip data available in the TNMplot database for (A) FXYD3, (B) ALPP, and (C) TSPAN15. The y axis represents mRNA expression, and the x axis represents the studied groups. The main signaling pathways were triggered by (D) FXYD3 and (E) TSPAN15 in ovarian cancer by STRING database. (**) indicates p value < 0.05. (***) indicates p value < 0.001.
Figure 11
Figure 11
Decomposition of the binding free energy for the three simulated systems.
Figure 12
Figure 12
Hydrogen bond between protein and aptamer of each system. (A) AptaC2-FXYD3; (B) AptaO1-TSPAN15; (C) AptaO2-TSPAN15. The occupancy of each interaction is on the right axis.
Figure 13
Figure 13
Tissue microarray analysis for the evaluation of AptaC2 and AptaO1 detection capacity for different ovarian tumor samples. Images demonstrate different stages and histologic subtypes of ovarian cancer: (A) non-tumoral tissue, (B) benign tissue, (C) borderline tissue, (D) metastasis tumoral tissue, (E) subtype endometrioid tumoral tissue, (F) subtype mucinous tumoral tissue, (G) subtype serous low grade, and (H) serous high grade, marked with: HE, AptaO1-FAM, and DAPI.

References

    1. Momenimovahed Z., Tiznobaik A., Taheri S., Salehiniya H. Ovarian cancer in the world: Epidemiology and risk factors. Int. J. Women’s Health. 2019;11:287–299. doi: 10.2147/IJWH.S197604. - DOI - PMC - PubMed
    1. Coburn S.B., Bray F., Sherman M.E., Trabert B. International patterns and trends in ovarian cancer incidence, overall and by histologic subtype. Int. J. Cancer. 2017;140:2451–2460. doi: 10.1002/ijc.30676. - DOI - PMC - PubMed
    1. Davidson B., Stavnes H.T., Holth A., Chen X., Yang Y., Shih I.-M., Wang T.-L. Gene expression signatures differentiate ovarian/peritoneal serous carcinoma from breast carcinoma in effusions. J. Cell. Mol. Med. 2011;15:535–544. doi: 10.1111/j.1582-4934.2010.01019.x. - DOI - PMC - PubMed
    1. Mrochem J., Sodowski K., Deja R., Walaszek-Gruszka A., Wojcieszek A., Kołosza Z., Chmura A., Czernik E., Masłyk B., Bartnik W., et al. Evaluation of selected serum protein markers as early detectors of ovarian cancer. Ginekol. Pol. 2008;79:271–275. - PubMed
    1. Meden H., Fattahi-Meibodi A. CA 125 in benign gynecological conditions. Int. J. Biol. Mark. 1998;13:231–237. doi: 10.1177/172460089801300411. - DOI - PubMed