

Transcriptomic Analysis from Normal Glucose Tolerance to T2D of Obese Individuals Using Bioinformatic Tools
- PMID: 37047308
- PMCID: PMC10093815
- DOI: 10.3390/ijms24076337
Transcriptomic Analysis from Normal Glucose Tolerance to T2D of Obese Individuals Using Bioinformatic Tools
Abstract
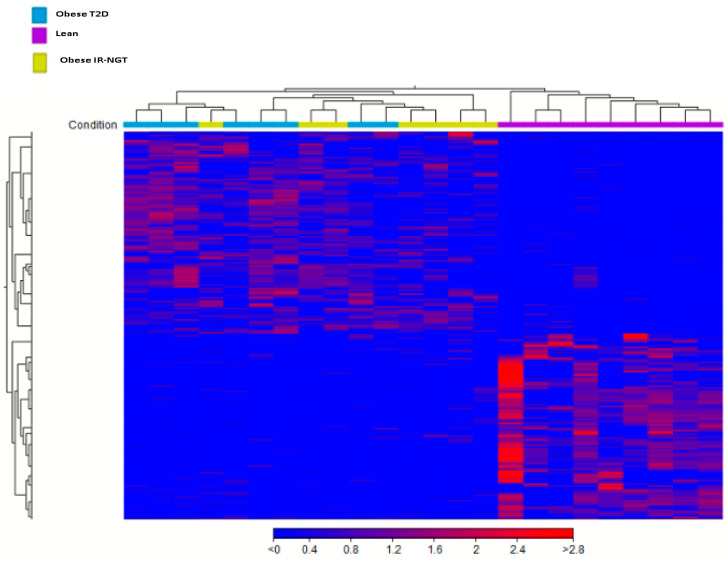
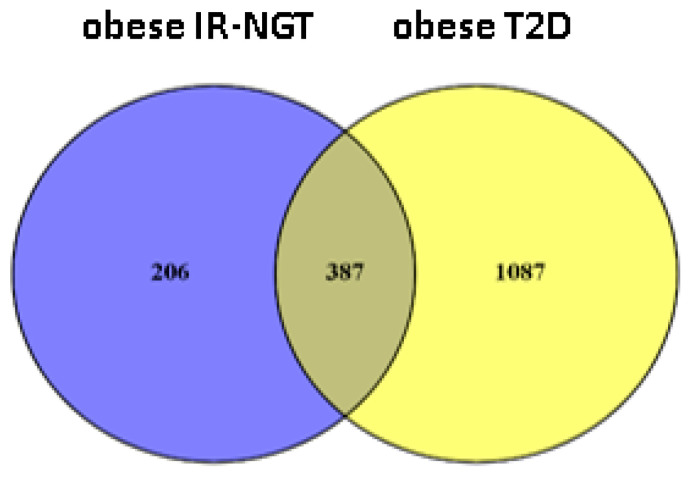
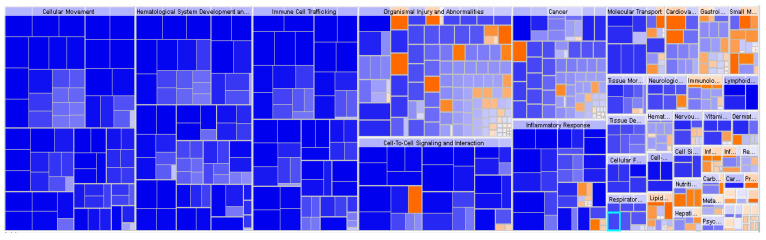
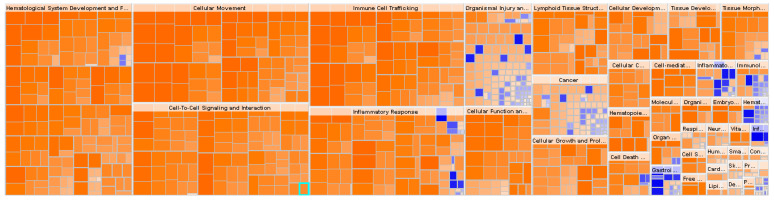
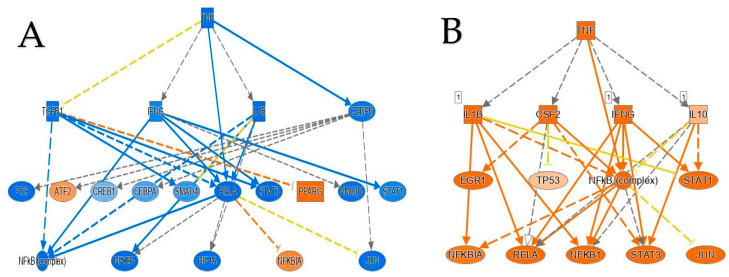
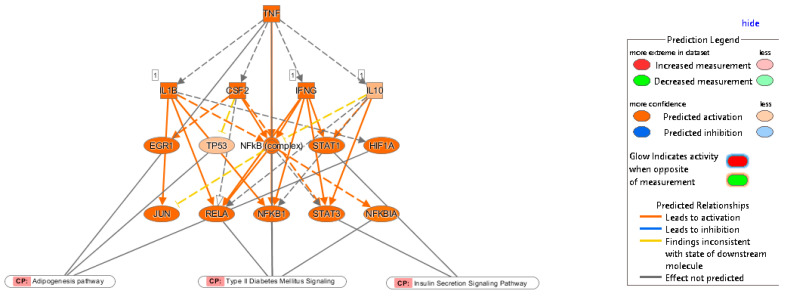
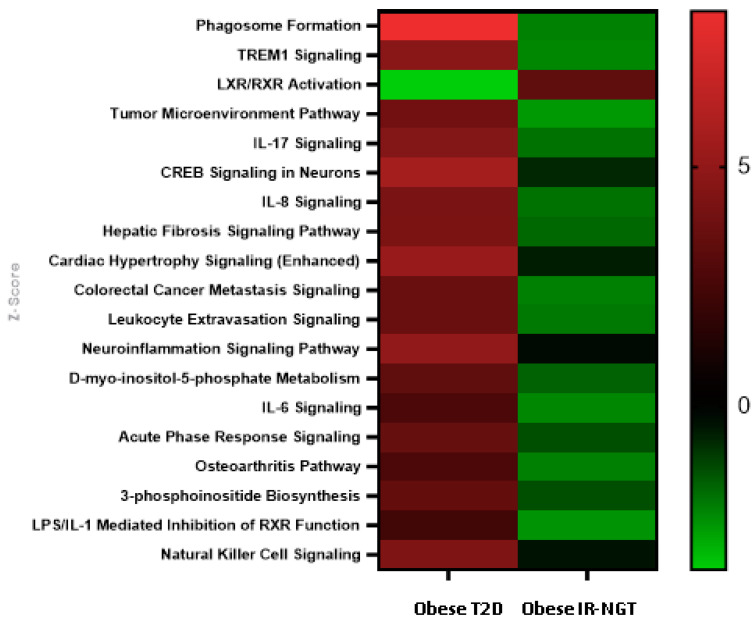
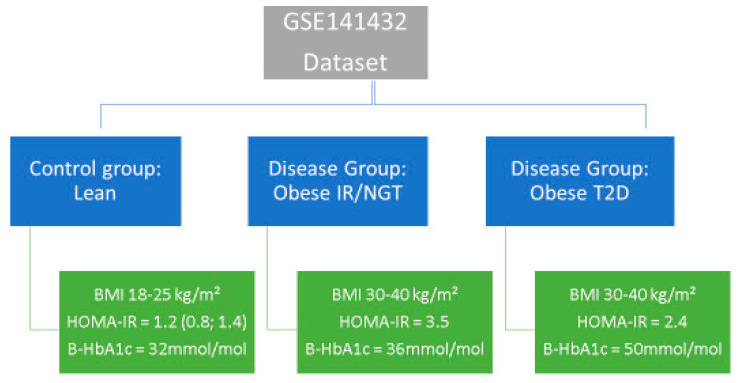
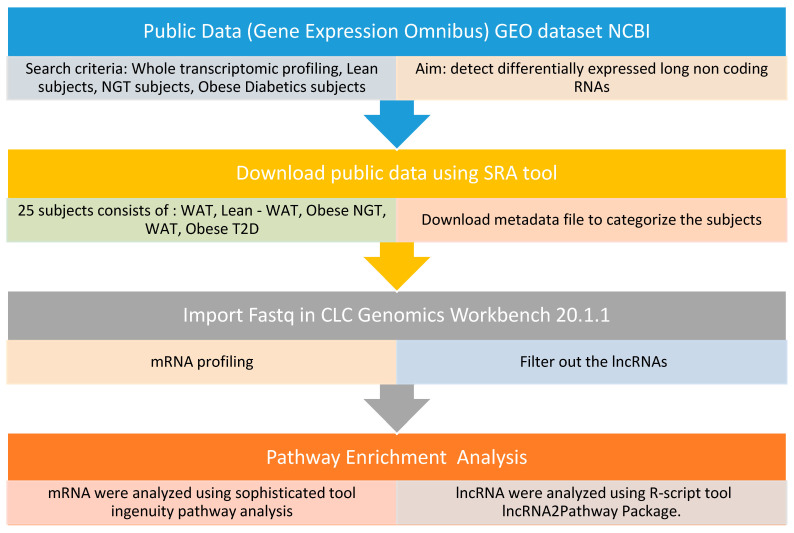
Understanding the role of white adipose tissue (WAT) in the occurrence and progression of metabolic syndrome is of considerable interest; among the metabolic syndromes are obesity and type 2 diabetes (T2D). Insulin resistance is a key factor in the development of T2D. When the target cells become resistant to insulin, the pancreas responds by producing more insulin to try to lower blood glucose. Over time, this can lead to a state of hyperinsulinemia (high levels of insulin in the blood), which can further exacerbate insulin resistance and contribute to the development of T2D. In order to understand the difference between healthy and unhealthy obese individuals, we have used published transcriptomic profiling to compare differences between the WAT obtained from obese diabetics and subjects who are obese with normal glucose tolerance and insulin resistance. The identification of aberrantly expressed messenger RNA (mRNA) and the resulting molecular interactions and signaling networks is essential for a better understanding of the progression from normal glucose-tolerant obese individuals to obese diabetics. Computational analyses using Ingenuity Pathway Analysis (IPA) identified multiple activated signaling networks in obesity progression from insulin-resistant and normal glucose-tolerant (IR-NGT) individuals to those with T2D. The pathways affected are: Tumor Necrosis Factor (TNF), Extracellular signal-Regulated protein Kinase 1/2 ERK1/2, Interleukin 1 A (IL1A), Protein kinase C (Pkcs), Convertase C5, Vascular endothelial growth factor (Vegf), REL-associated protein (RELA), Interleukin1/1 B (IL1/1B), Triggering receptor expressed on myeloid cells (TREM1) and Nuclear factor KB1 (NFKB1) networks, while functional annotation highlighted Liver X Receptor (LXR) activation, phagosome formation, tumor microenvironment pathway, LPS/IL-1 mediated inhibition of RXR function, TREM1 signaling and IL-6 signaling. Together, by conducting a thorough bioinformatics study of protein-coding RNAs, prospective targets could be exploited to clarify the molecular pathways underlying the development of obesity-related type 2 diabetes.
Keywords: T2D; insulin resistance; obesity; transcriptomics.
Conflict of interest statement
The authors declare no conflict of interest.
Figures

Similar articles
-
Diabetes and branched-chain amino acids: What is the link?J Diabetes. 2018 May;10(5):350-352. doi: 10.1111/1753-0407.12645. Epub 2018 Feb 13. J Diabetes. 2018. PMID: 29369529
-
Elevated NF-κB activation is conserved in human myocytes cultured from obese type 2 diabetic patients and attenuated by AMP-activated protein kinase.Diabetes. 2011 Nov;60(11):2810-9. doi: 10.2337/db11-0263. Epub 2011 Sep 12. Diabetes. 2011. PMID: 21911750 Free PMC article.
-
NPC86 Increases LncRNA Gas5 In Vivo to Improve Insulin Sensitivity and Metabolic Function in Diet-Induced Obese Diabetic Mouse Model.Int J Mol Sci. 2025 Apr 14;26(8):3695. doi: 10.3390/ijms26083695. Int J Mol Sci. 2025. PMID: 40332318 Free PMC article.
-
Metabolism and insulin signaling in common metabolic disorders and inherited insulin resistance.Dan Med J. 2014 Jul;61(7):B4890. Dan Med J. 2014. PMID: 25123125 Review.
-
Recent advances in the relationship between obesity, inflammation, and insulin resistance.Eur Cytokine Netw. 2006 Mar;17(1):4-12. Eur Cytokine Netw. 2006. PMID: 16613757 Review.
Cited by
-
A Panel of Diverse Inflammatory Biomarkers Is Not Associated with BMI-Calibrated Obesity nor with Dyslipidemia or Dysglycemia in Clinically Healthy Adults Aged 20 to 40 Years.Int J Environ Res Public Health. 2025 Jan 31;22(2):207. doi: 10.3390/ijerph22020207. Int J Environ Res Public Health. 2025. PMID: 40003433 Free PMC article.
-
Mechanism of Ginsenosides in the Treatment of Diabetes Mellitus Based on Network Pharmacology and Molecular Docking.Int J Mol Sci. 2025 May 30;26(11):5300. doi: 10.3390/ijms26115300. Int J Mol Sci. 2025. PMID: 40508108 Free PMC article.
-
Thyrotropin exacerbates insulin resistance by triggering macrophage inflammation in subclinical hypothyroidism.Exp Mol Med. 2025 Jun;57(6):1246-1259. doi: 10.1038/s12276-025-01478-1. Epub 2025 Jun 16. Exp Mol Med. 2025. PMID: 40523992 Free PMC article.
-
Father's adolescent body silhouette is associated with offspring asthma, lung function and BMI through DNA methylation.Commun Biol. 2025 May 24;8(1):796. doi: 10.1038/s42003-025-08121-9. Commun Biol. 2025. PMID: 40410506 Free PMC article.
References
MeSH terms
Substances
LinkOut - more resources
Full Text Sources
Medical
Miscellaneous
