LTR Retroelements and Bird Adaptation to Arid Environments
- PMID: 37047324
- PMCID: PMC10094322
- DOI: 10.3390/ijms24076332
LTR Retroelements and Bird Adaptation to Arid Environments
Abstract
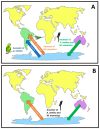
TEs are known to be among the main drivers in genome evolution, leading to the generation of evolutionary advantages that favor the success of organisms. The aim of this work was to investigate the TE landscape in bird genomes to look for a possible relationship between the amount of specific TE types and environmental changes that characterized the Oligocene era in Australia. Therefore, the mobilome of 29 bird species, belonging to a total of 11 orders, was analyzed. Our results confirmed that LINE retroelements are not predominant in all species of this evolutionary lineage and highlighted an LTR retroelement dominance in species with an Australian-related evolutionary history. The bird LTR retroelement expansion might have happened in response to the Earth's dramatic climate changes that occurred about 30 Mya, followed by a progressive aridification across most of Australian landmasses. Therefore, in birds, LTR retroelement burst might have represented an evolutionary advantage in the adaptation to arid/drought environments.
Keywords: Australian bird evolution; Aves; genome evolution; molecular adaptation; transposable elements; vertebrates.
Conflict of interest statement
The authors declare no conflict of interest.
Figures


Similar articles
-
Transposable element discovery and characterization of LTR-retrotransposon evolutionary lineages in the tropical fruit species Passiflora edulis.Mol Biol Rep. 2019 Dec;46(6):6117-6133. doi: 10.1007/s11033-019-05047-4. Epub 2019 Sep 24. Mol Biol Rep. 2019. PMID: 31549373
-
An intriguing relationship between teleost Rex3 retroelement and environmental temperature.Biol Lett. 2019 Sep 27;15(9):20190279. doi: 10.1098/rsbl.2019.0279. Epub 2019 Sep 4. Biol Lett. 2019. PMID: 31480936 Free PMC article.
-
Network dynamics of eukaryotic LTR retroelements beyond phylogenetic trees.Biol Direct. 2009 Nov 2;4:41. doi: 10.1186/1745-6150-4-41. Biol Direct. 2009. PMID: 19883502 Free PMC article.
-
Evolution of bird genomes-a transposon's-eye view.Ann N Y Acad Sci. 2017 Feb;1389(1):164-185. doi: 10.1111/nyas.13295. Epub 2016 Dec 20. Ann N Y Acad Sci. 2017. PMID: 27997700 Review.
-
Co-evolution of plant LTR-retrotransposons and their host genomes.Protein Cell. 2013 Jul;4(7):493-501. doi: 10.1007/s13238-013-3037-6. Epub 2013 Jun 23. Protein Cell. 2013. PMID: 23794032 Free PMC article. Review.
Cited by
-
Reactivation of retrotransposable elements is associated with environmental stress and ageing.Nat Rev Genet. 2025 Aug;26(8):547-558. doi: 10.1038/s41576-025-00829-y. Epub 2025 Apr 2. Nat Rev Genet. 2025. PMID: 40175591 Review.
-
A reference genome for the Harpy Eagle reveals steady demographic decline and chromosomal rearrangements in the origin of Accipitriformes.Sci Rep. 2024 Sep 12;14(1):19925. doi: 10.1038/s41598-024-70305-w. Sci Rep. 2024. PMID: 39261501 Free PMC article.
References
-
- Canapa A., Biscotti M.A., Barucca M., Carducci F., Carotti E., Olmo E. Shedding light upon the complex net of genome size, genome composition and environment in chordates. Eur. Zool. J. 2020;87:192–202. doi: 10.1080/24750263.2020.1747558. - DOI
MeSH terms
Substances
LinkOut - more resources
Full Text Sources

