

Transcriptome Analysis Reveals the Profile of Long Non-Coding RNAs during Myogenic Differentiation in Goats
- PMID: 37047345
- PMCID: PMC10094361
- DOI: 10.3390/ijms24076370
Transcriptome Analysis Reveals the Profile of Long Non-Coding RNAs during Myogenic Differentiation in Goats
Abstract
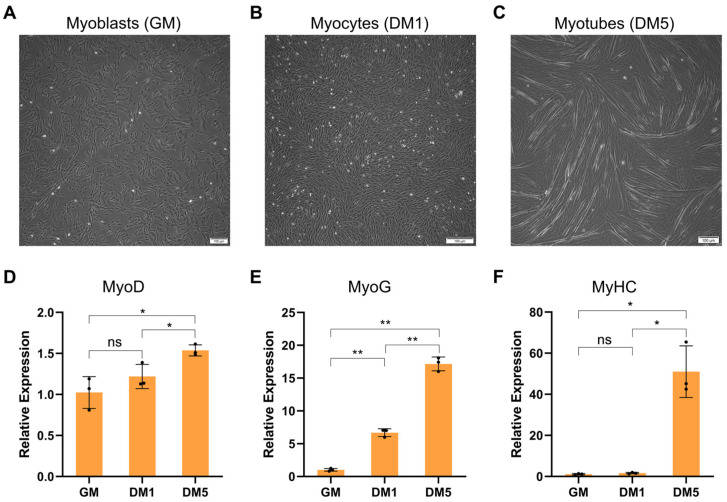
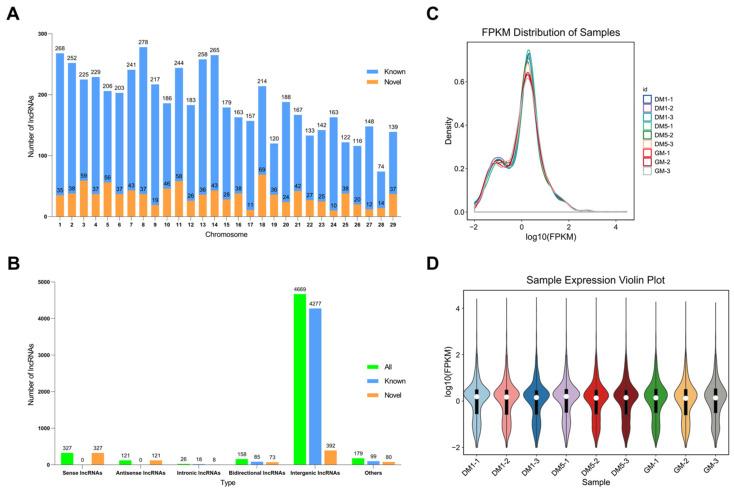
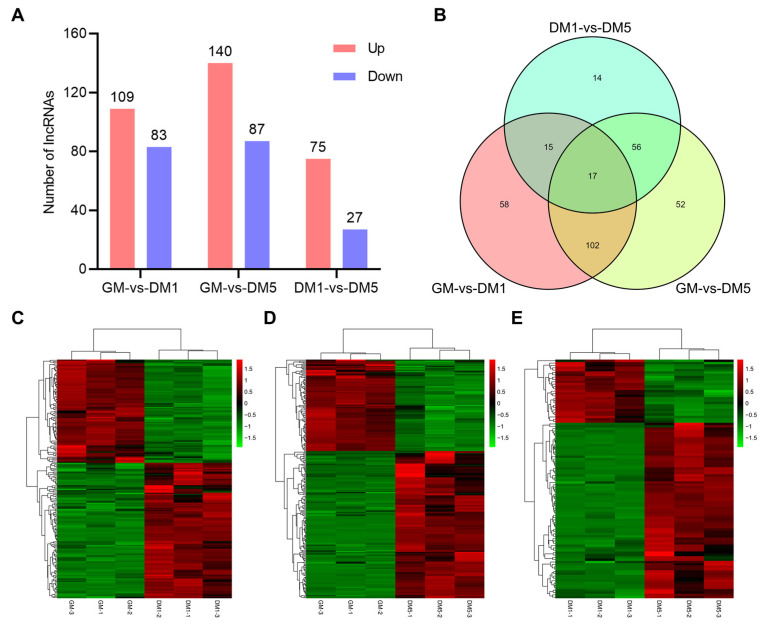
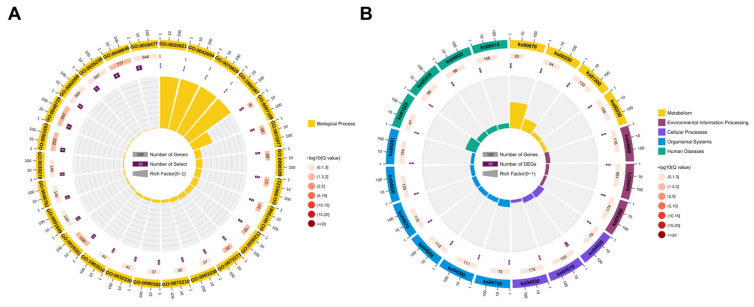
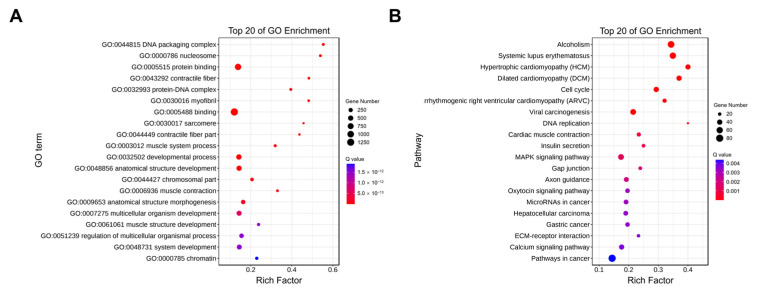
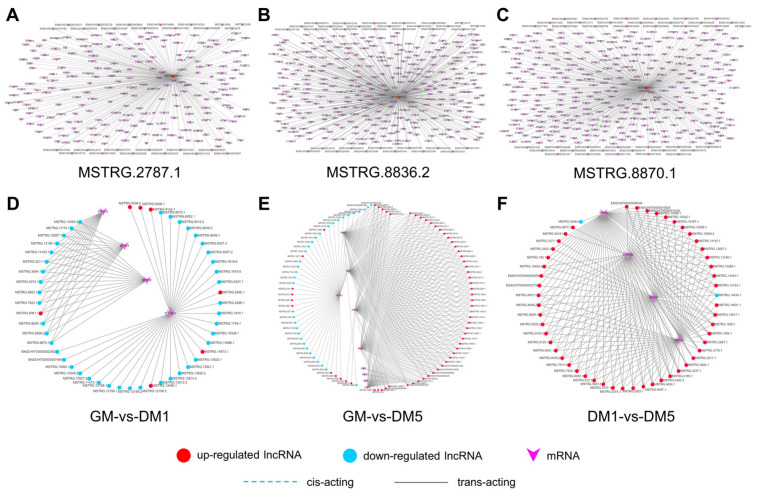
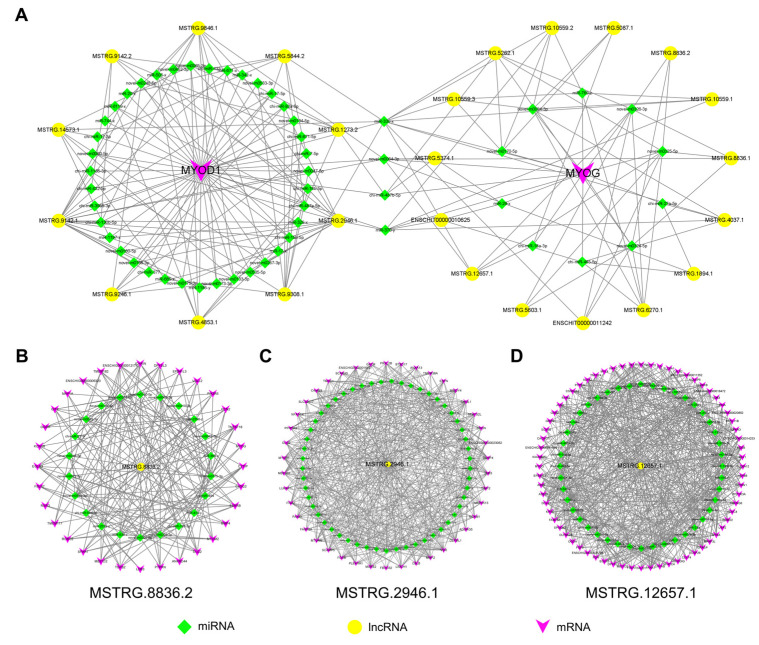
The long non-coding RNAs (lncRNAs) are emerging as essential regulators of the growth and development of skeletal muscles. However, little is known about the expression profiles of lncRNAs during the proliferation and differentiation of skeletal muscle satellite cells (MuSCs) in goats. In this study, we investigate potential regulatory lncRNAs that govern muscle development by performing lncRNA expression profiling analysis during the proliferation (cultured in the growth medium, GM) and differentiation (cultured in the differentiation medium, DM1/DM5) of MuSCs. In total, 1001 lncRNAs were identified in MuSC samples, and 314 differentially expressed (DE) (FDR < 0.05, |log2FC| > 1) lncRNAs were screened by pairwise comparisons from three comparison groups (GM-vs-DM1, GM-vs-DM5, DM1-vs-DM5). Moreover, we identified the cis-, trans-, and antisense-regulatory target genes of DE lncRNAs. Gene Ontology (GO) and Kyoto Encyclopedia of Genes and Genomes (KEGG) enrichment analyses showed that these target genes were significantly enriched in muscle development-related GO terms and KEGG pathways. In addition, the network of interactions between DE lncRNAs and their target genes was identified, which included well-known myogenesis regulators such as Myogenic differentiation 1 (MyoD), Myogenin (MyoG), and Myosin heavy chain (MyHC). Meanwhile, competing endogenous RNA (ceRNA) network analysis showed that 237 DE lncRNAs could bind to 329 microRNAs (miRNAs), while miRNAs could target 564 mRNAs. Together, our results provide a genome-wide resource of lncRNAs that may contribute to myogenic differentiation in goats and lay the groundwork for future investigation into their functions during skeletal muscle development.
Keywords: differential expression; goats; lncRNAs; myogenic differentiation; transcriptome.
Conflict of interest statement
The authors declare no conflict of interest.
Figures
Similar articles
-
CircRNA profiling of skeletal muscle satellite cells in goats reveals circTGFβ2 promotes myoblast differentiation.BMC Genomics. 2024 Nov 12;25(1):1075. doi: 10.1186/s12864-024-11008-4. BMC Genomics. 2024. PMID: 39533172 Free PMC article.
-
Whole-Transcriptome RNA Sequencing Uncovers the Global Expression Changes and RNA Regulatory Networks in Duck Embryonic Myogenesis.Int J Mol Sci. 2023 Nov 16;24(22):16387. doi: 10.3390/ijms242216387. Int J Mol Sci. 2023. PMID: 38003577 Free PMC article.
-
Integrated transcriptome analysis reveals roles of long non-coding RNAs (lncRNAs) in caprine skeletal muscle mass and meat quality.Funct Integr Genomics. 2023 Feb 22;23(1):63. doi: 10.1007/s10142-023-00987-4. Funct Integr Genomics. 2023. PMID: 36810929
-
microRNAs in skeletal muscle development.Semin Cell Dev Biol. 2017 Dec;72:67-76. doi: 10.1016/j.semcdb.2017.10.032. Epub 2017 Nov 4. Semin Cell Dev Biol. 2017. PMID: 29102719 Review.
-
Non-coding RNAs in muscle differentiation and musculoskeletal disease.J Clin Invest. 2016 Jun 1;126(6):2021-30. doi: 10.1172/JCI84419. Epub 2016 Jun 1. J Clin Invest. 2016. PMID: 27249675 Free PMC article. Review.
Cited by
-
Exploring Gene Expression and Alternative Splicing in Duck Embryonic Myoblasts via Full-Length Transcriptome Sequencing.Vet Sci. 2024 Nov 27;11(12):601. doi: 10.3390/vetsci11120601. Vet Sci. 2024. PMID: 39728941 Free PMC article.
-
P-hydroxybenzaldehyde protects Caenorhabditis elegans from oxidative stress and β-amyloid toxicity.Front Aging Neurosci. 2024 May 22;16:1414956. doi: 10.3389/fnagi.2024.1414956. eCollection 2024. Front Aging Neurosci. 2024. PMID: 38841104 Free PMC article.
References
MeSH terms
Substances
Grants and funding
LinkOut - more resources
Full Text Sources
