Review
. 2023 Mar 28;24(7):6375.
doi: 10.3390/ijms24076375.

Recapitulating the Key Advances in the Diagnosis and Prognosis of High-Grade Gliomas: Second Half of 2021 Update

Affiliations
Review

Recapitulating the Key Advances in the Diagnosis and Prognosis of High-Grade Gliomas: Second Half of 2021 Update

Guido Frosina. Int J Mol Sci. .

Abstract

High-grade gliomas (World Health Organization grades III and IV) are the most frequent and fatal brain tumors, with median overall survivals of 24-72 and 14-16 months, respectively. We reviewed the progress in the diagnosis and prognosis of high-grade gliomas published in the second half of 2021. A literature search was performed in PubMed using the general terms "radio* and gliom*" and a time limit from 1 July 2021 to 31 December 2021. Important advances were provided in both imaging and non-imaging diagnoses of these hard-to-treat cancers. Our prognostic capacity also increased during the second half of 2021. This review article demonstrates slow, but steady improvements, both scientifically and technically, which express an increased chance that patients with high-grade gliomas may be correctly diagnosed without invasive procedures. The prognosis of those patients strictly depends on the final results of that complex diagnostic process, with widely varying survival rates.

Keywords: CNS; MRI; diagnosis; glioma; neuroradiology; non-imaging diagnosis; nuclear medicine; prognosis; tumor.


Conflict of interest statement

The author declares no conflict of interest.

Figures

Figure 1
Figure 1
Flow diagram for reported studies (modified from [7] with permission).
Figure 2
Figure 2
Advances in imaging diagnosis of HGG. PCNSL. (a). Axial T-2. (b). DWI. (c). Postcontrast studies demonstrate an intensely enhancing mass in the left frontal lobe with a mild T-2 dark signal and T-2 shortening, demonstrating DWI restriction and marked contrast enhancement. (d,e). Co-registered perfusion with postcontrast T1 volumetric and perfusion curves demonstrate low blood volume relative to white matter in spite of significant enhancement in the postcontrast studies and a significantly higher percentage signal recovery than that of normal white matter (pink region of interest (ROI) representing tumor and blue ROI normal white matter). Percentage signal recovery curve showing that is characteristically higher than base line recovery is. (f). Magnified version of perfusion graph, highlighting the difference in percentage signal recovery values between PCNSL and normal white matter (pink = tumor; yellow = white matter; red = mean of entire slice). GB. (g). Axial T2. (h). DWI (i). Apparent diffusion coefficient (ADC): there is a mass of T2 heterogenous intensity within the right basal ganglia, with DWI restriction and low ADC, closely resembling lymphoma. (jl). Perfusion study demonstrating high blood volume and low PSR. In contrast to PCNSL, GB demonstrates significantly lower percentage signal recovery than normal white matter does. (m). Magnified version of PSR (blue arrows), showing the difference of signal recovery values between the tumor and white matter (pink = tumor; white = white matter; yellow = mean of tissue slice) (reproduced from [15] with permission). Typical localizations of pDMG in the pons (n,o) and thalamus (p,q) in axial MR images. Different H3K27 genetic subgroups may show very similar MRI phenotypes with hyperintense, heterogeneous T2 signal (nq). However, T2 signal may also appear to be very different even within the same genetic group (r,s) (reproduced from [16] with permission). MRI and histopathological staining of brain tumor tissues. (t). Sagittal T1-weighted contrast-enhanced MRI imaging of initial and recurrent tumors. (u,v). Representative images of u. primary GB and (v). secondary gliosarcoma (SGS) tissues stained using hematoxylin and eosin (HE), and immunolabeled using antibodies to glial fibrillary acidic protein (GFAP) and reticulin (reproduced from [17] with permission).
Figure 2
Figure 2
Advances in imaging diagnosis of HGG. PCNSL. (a). Axial T-2. (b). DWI. (c). Postcontrast studies demonstrate an intensely enhancing mass in the left frontal lobe with a mild T-2 dark signal and T-2 shortening, demonstrating DWI restriction and marked contrast enhancement. (d,e). Co-registered perfusion with postcontrast T1 volumetric and perfusion curves demonstrate low blood volume relative to white matter in spite of significant enhancement in the postcontrast studies and a significantly higher percentage signal recovery than that of normal white matter (pink region of interest (ROI) representing tumor and blue ROI normal white matter). Percentage signal recovery curve showing that is characteristically higher than base line recovery is. (f). Magnified version of perfusion graph, highlighting the difference in percentage signal recovery values between PCNSL and normal white matter (pink = tumor; yellow = white matter; red = mean of entire slice). GB. (g). Axial T2. (h). DWI (i). Apparent diffusion coefficient (ADC): there is a mass of T2 heterogenous intensity within the right basal ganglia, with DWI restriction and low ADC, closely resembling lymphoma. (jl). Perfusion study demonstrating high blood volume and low PSR. In contrast to PCNSL, GB demonstrates significantly lower percentage signal recovery than normal white matter does. (m). Magnified version of PSR (blue arrows), showing the difference of signal recovery values between the tumor and white matter (pink = tumor; white = white matter; yellow = mean of tissue slice) (reproduced from [15] with permission). Typical localizations of pDMG in the pons (n,o) and thalamus (p,q) in axial MR images. Different H3K27 genetic subgroups may show very similar MRI phenotypes with hyperintense, heterogeneous T2 signal (nq). However, T2 signal may also appear to be very different even within the same genetic group (r,s) (reproduced from [16] with permission). MRI and histopathological staining of brain tumor tissues. (t). Sagittal T1-weighted contrast-enhanced MRI imaging of initial and recurrent tumors. (u,v). Representative images of u. primary GB and (v). secondary gliosarcoma (SGS) tissues stained using hematoxylin and eosin (HE), and immunolabeled using antibodies to glial fibrillary acidic protein (GFAP) and reticulin (reproduced from [17] with permission).
Figure 3
Figure 3
Advances in non-imaging diagnosis of HGG. (a). Column chart demonstrating significantly over-expressed genes in the plasma samples of glioma patients relative to those of healthy control. (b). Column chart demonstrating significantly under-expressed genes in the plasma samples of glioma patients relative to those of healthy control (reproduced from [36] with permission). (ce). Brain activity of peritumoral and homologue contralateral areas. Peritumoral brain activity level was significantly higher compared to the level in the homologue contralateral areas. p < 0.001 after correction for three comparisons (c: broadband power; d: offset; e: slope). A.U. = arbitrary units (reproduced from [37] with permission). (f). The box plot of the number of nonsense mutation of HGG with/without mismatch repair deficiency (MMRD). MMRD HGG had a higher number of nonsense mutation than non-MMRD HGG did. The average numbers of mutations in astrocytoma idh mutant with MMRD and without MMRD were 23.0 and 5.8, respectively. The average numbers of mutations in IDH wild-type GB with MMRD and without MMRD were 23.6 and 4.7, respectively (reproduced from [39] with permission). (gi). The histology of radiation-induced organizing hematoma (RIOH) and ex novo cavernous hemangioma (CH). Microscopically, RIOH shows a hematoma-like area composed of hyalinized vessels with fibrin and infiltrating foamy macrophages (g,h) and ex novo CH consists of clusters of well-formed vascular lumens (i). (j,k). Gamma knife surgery-induced RIOH shows relatively thicker tumor walls (j) compared with those of conventional RT-induced RIOH (k) (Masson’s trichrome) (reproduced from [41] with permission). Asterisks indicate the level of statistical significance.
Figure 3
Figure 3
Advances in non-imaging diagnosis of HGG. (a). Column chart demonstrating significantly over-expressed genes in the plasma samples of glioma patients relative to those of healthy control. (b). Column chart demonstrating significantly under-expressed genes in the plasma samples of glioma patients relative to those of healthy control (reproduced from [36] with permission). (ce). Brain activity of peritumoral and homologue contralateral areas. Peritumoral brain activity level was significantly higher compared to the level in the homologue contralateral areas. p < 0.001 after correction for three comparisons (c: broadband power; d: offset; e: slope). A.U. = arbitrary units (reproduced from [37] with permission). (f). The box plot of the number of nonsense mutation of HGG with/without mismatch repair deficiency (MMRD). MMRD HGG had a higher number of nonsense mutation than non-MMRD HGG did. The average numbers of mutations in astrocytoma idh mutant with MMRD and without MMRD were 23.0 and 5.8, respectively. The average numbers of mutations in IDH wild-type GB with MMRD and without MMRD were 23.6 and 4.7, respectively (reproduced from [39] with permission). (gi). The histology of radiation-induced organizing hematoma (RIOH) and ex novo cavernous hemangioma (CH). Microscopically, RIOH shows a hematoma-like area composed of hyalinized vessels with fibrin and infiltrating foamy macrophages (g,h) and ex novo CH consists of clusters of well-formed vascular lumens (i). (j,k). Gamma knife surgery-induced RIOH shows relatively thicker tumor walls (j) compared with those of conventional RT-induced RIOH (k) (Masson’s trichrome) (reproduced from [41] with permission). Asterisks indicate the level of statistical significance.
Figure 4
Figure 4
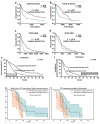
Advances in prognosis of HGG. Kaplan–Meier analysis of OS based on STOX1 expression levels in glioma patients. (ad). Glioma patients with high-level STOX1 expression had longer OS than those with low-level STOX1 expression did among the whole glioma cohort (a,b) or GB cohort alone (c,d) in both CGGA and TCGA datasets (reproduced from [52] with permission). (e,f). MGMT is a marker for survival and disease progression in GB. (e,f). The extent, pattern, and prognostic value of MGMT promotor methylation. (e). Kaplan–Meier estimates of OS in GB treated with any form of radio-/chemotherapy. Curves are displayed for patients with >18 methylated CpG sites (straight lines) and ≤18 methylated CpG sites (dotted lines). (f). Kaplan–Meier estimates of radiographic progression-free survival in GB treated with any form of radio-/chemotherapy. Curves are displayed of patients with >18 methylated CpG sites (straight lines) and ≤18 methylated CpG sites (dotted lines) (reproduced from [54] with permission). (g,h). In HGG patients, 18F-FET-PET-guided gross total resection (GTR) improves OS. (g). PET GTR results in longer OS (19.3 months) compared to that of patients with PET residual (13.7 months). (h). Patients with FET-PET examination before initial resection showing a significant effect of PET GTR (reproduced from [55] with permission). (i,j). HGG with deep supratentorial extension (DSE) is associated with a worse OS. (i). Kaplan–Meier curves reveal that GBs with DSE are associated with significantly worse OS compared to those without DSE. (j). Involvement of a greater number of deep-seated brain structures is associated with progressively worsening OS by pooled log-rank analysis (reproduced from [57] with permission). (k,l). Clinical profile, treatment, and outcome of pediatric brain tumors in Serbia over a 10-year period. (k). Cumulative survival of children with brain tumors. (l). Cumulative survival of children with brain tumors according to tumor histopathological type. ET—embryonal tumors; HGG—high-grade glioma; LGG—low-grade glioma; EP—ependymoma; UH—unknown histopathological type (reproduced from [62] with permission).
Figure 4
Figure 4
Advances in prognosis of HGG. Kaplan–Meier analysis of OS based on STOX1 expression levels in glioma patients. (ad). Glioma patients with high-level STOX1 expression had longer OS than those with low-level STOX1 expression did among the whole glioma cohort (a,b) or GB cohort alone (c,d) in both CGGA and TCGA datasets (reproduced from [52] with permission). (e,f). MGMT is a marker for survival and disease progression in GB. (e,f). The extent, pattern, and prognostic value of MGMT promotor methylation. (e). Kaplan–Meier estimates of OS in GB treated with any form of radio-/chemotherapy. Curves are displayed for patients with >18 methylated CpG sites (straight lines) and ≤18 methylated CpG sites (dotted lines). (f). Kaplan–Meier estimates of radiographic progression-free survival in GB treated with any form of radio-/chemotherapy. Curves are displayed of patients with >18 methylated CpG sites (straight lines) and ≤18 methylated CpG sites (dotted lines) (reproduced from [54] with permission). (g,h). In HGG patients, 18F-FET-PET-guided gross total resection (GTR) improves OS. (g). PET GTR results in longer OS (19.3 months) compared to that of patients with PET residual (13.7 months). (h). Patients with FET-PET examination before initial resection showing a significant effect of PET GTR (reproduced from [55] with permission). (i,j). HGG with deep supratentorial extension (DSE) is associated with a worse OS. (i). Kaplan–Meier curves reveal that GBs with DSE are associated with significantly worse OS compared to those without DSE. (j). Involvement of a greater number of deep-seated brain structures is associated with progressively worsening OS by pooled log-rank analysis (reproduced from [57] with permission). (k,l). Clinical profile, treatment, and outcome of pediatric brain tumors in Serbia over a 10-year period. (k). Cumulative survival of children with brain tumors. (l). Cumulative survival of children with brain tumors according to tumor histopathological type. ET—embryonal tumors; HGG—high-grade glioma; LGG—low-grade glioma; EP—ependymoma; UH—unknown histopathological type (reproduced from [62] with permission).

Similar articles

Cited by

References

    1. Crocetti E., Trama A., Stiller C., Caldarella A., Soffietti R., Jaal J., Weber D.C., Ricardi U., Slowinski J., Brandes A. Epidemiology of glial and non-glial brain tumours in Europe. Eur. J. Cancer. 2012;48:1532–1542. doi: 10.1016/j.ejca.2011.12.013. - DOI - PubMed
    1. Sandler A., Reilly K., Widemann B. Editorial: Special issue on rare cancers. Curr. Probl. Cancer. 2021;45:100774. doi: 10.1016/j.currproblcancer.2021.100774. - DOI - PMC - PubMed
    1. Global Burden of Disease Cancer Collaboration. Fitzmaurice C., Abate D., Abbasi N., Abbastabar H., Abd-Allah F., Abdel-Rahman O., Abdelalim A., Abdoli A., Abdollahpour I., et al. Global, Regional, and National Cancer Incidence, Mortality, Years of Life Lost, Years Lived with Disability, and Disability-Adjusted Life-Years for 29 Cancer Groups, 1990 to 2017: A Systematic Analysis for the Global Burden of Disease Study. JAMA Oncol. 2019;5:1749–1768. - PMC - PubMed
    1. Stupp R., Mason W.P., van den Bent M.J., Weller M., Fisher B., Taphoorn M.J.B., Belanger K., Brandes A.A., Marosi C., Bogdahn U., et al. Radiotherapy plus Concomitant and Adjuvant Temozolomide for Glioblastoma. N. Engl. J. Med. 2005;352:987–996. doi: 10.1056/NEJMoa043330. - DOI - PubMed
    1. Omuro A., DeAngelis L.M. Glioblastoma and Other Malignant Gliomas: A Clinical Review. JAMA. 2013;310:1842–1850. doi: 10.1001/jama.2013.280319. - DOI - PubMed