

Iron(III) Complexes with Non-Steroidal Anti-Inflammatory Drugs: Structure, Antioxidant and Anticholinergic Activity, and Interaction with Biomolecules
- PMID: 37047364
- PMCID: PMC10094617
- DOI: 10.3390/ijms24076391
Iron(III) Complexes with Non-Steroidal Anti-Inflammatory Drugs: Structure, Antioxidant and Anticholinergic Activity, and Interaction with Biomolecules
Abstract
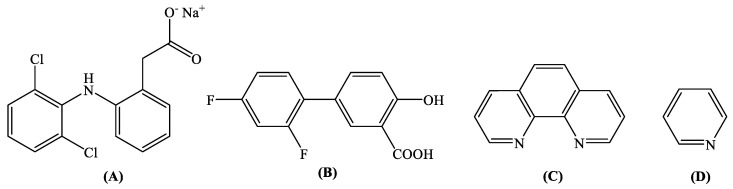
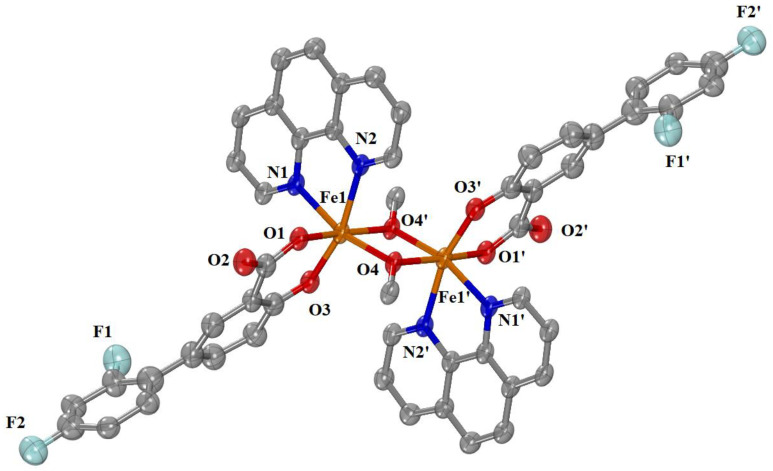
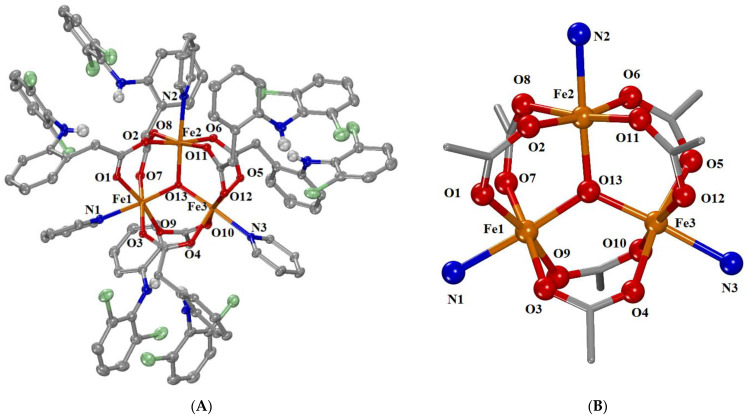
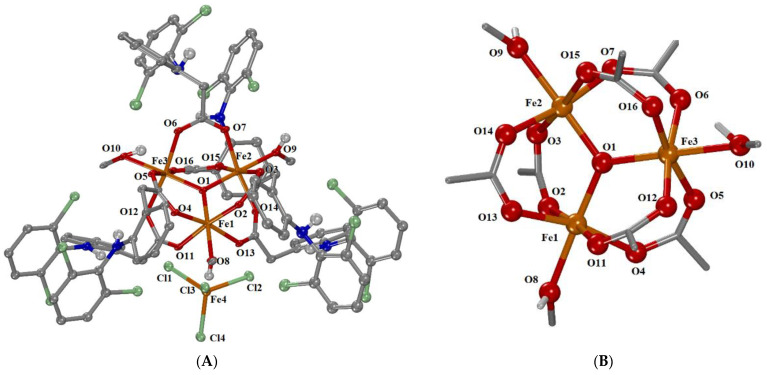
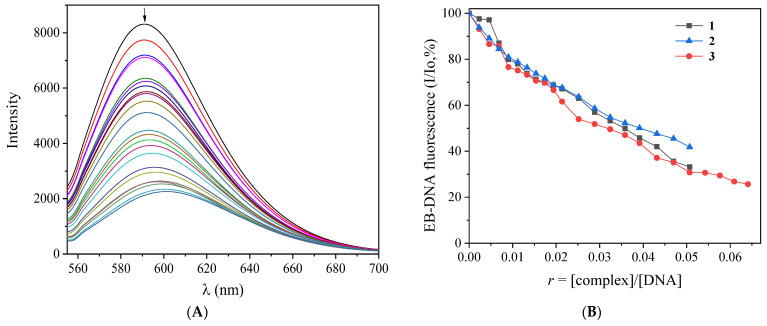
One the main research goals of bioinorganic chemists is the synthesis of novel coordination compounds possessing biological potency. Within this context, three novel iron(III) complexes with the non-steroidal anti-inflammatory drugs diflunisal and diclofenac in the presence or absence of the nitrogen donors 1,10-phenanthroline or pyridine were isolated and characterized by diverse techniques. The complexes were evaluated for their ability to scavenge in vitro free radicals such as hydroxyl, 1,1-diphenyl-2-picrylhydrazyl and 2,2'-azino-bis(3-ethylbenzothiazoline-6-sulfonic acid) radicals, revealing their selective potency towards hydroxyl radicals. The in vitro inhibitory activity of the complexes towards the enzymes acetylcholinesterase and butyrylcholinesterase was evaluated, and their potential to achieve neuroprotection appeared promising. The interaction of the complexes with calf-thymus DNA was examined in vitro, revealing their ability to intercalate in-between DNA nucleobases. The affinity of the complexes for serum albumins was evaluated in vitro and revealed their tight and reversible binding.
Keywords: anticholinergic activity; antioxidant activity; interaction with DNA; interaction with albumins; iron(III) complexes; non-steroidal anti-inflammatory drugs.
Conflict of interest statement
The authors declare no conflict of interest.
Figures
Similar articles
-
Manganese(II) Complexes with Non-Steroidal Anti-Inflammatory Drugs: Structure and Biological Activity.Int J Mol Sci. 2024 Dec 16;25(24):13457. doi: 10.3390/ijms252413457. Int J Mol Sci. 2024. PMID: 39769224 Free PMC article.
-
Coordination compounds of cobalt(II) with carboxylate non-steroidal anti-inflammatory drugs: structure and biological profile.Dalton Trans. 2024 Sep 18;53(36):15215-15235. doi: 10.1039/d4dt01846j. Dalton Trans. 2024. PMID: 39221624
-
Nickel(II)-meclofenamate complexes: Structure, in vitro and in silico DNA- and albumin-binding studies, antioxidant and anticholinergic activity.J Inorg Biochem. 2021 Sep;222:111507. doi: 10.1016/j.jinorgbio.2021.111507. Epub 2021 Jun 2. J Inorg Biochem. 2021. PMID: 34139455
-
Quinolones and non-steroidal anti-inflammatory drugs interacting with copper(II), nickel(II), cobalt(II) and zinc(II): structural features, biological evaluation and perspectives.Dalton Trans. 2013 May 14;42(18):6252-76. doi: 10.1039/c3dt50268f. Dalton Trans. 2013. PMID: 23529676 Review.
-
A Review on Coordination Properties of Al(III) and Fe(III) toward Natural Antioxidant Molecules: Experimental and Theoretical Insights.Molecules. 2021 Apr 29;26(9):2603. doi: 10.3390/molecules26092603. Molecules. 2021. PMID: 33946938 Free PMC article. Review.
Cited by
-
Synthesis, characterization and evaluation of new anti-inflammatory iron charge transfer complexes.Heliyon. 2024 Jun 8;10(12):e32448. doi: 10.1016/j.heliyon.2024.e32448. eCollection 2024 Jun 30. Heliyon. 2024. PMID: 38975223 Free PMC article.
-
Manganese(II) Complexes with Non-Steroidal Anti-Inflammatory Drugs: Structure and Biological Activity.Int J Mol Sci. 2024 Dec 16;25(24):13457. doi: 10.3390/ijms252413457. Int J Mol Sci. 2024. PMID: 39769224 Free PMC article.
-
Iron(III) Complexes with Substituted Salicylaldehydes: Synthesis, Interaction with DNA and Serum Albumins, and Antioxidant Activity.Molecules. 2025 May 29;30(11):2383. doi: 10.3390/molecules30112383. Molecules. 2025. PMID: 40509273 Free PMC article.
-
Cobalt(II) Complexes of 4'-Nitro-Fenamic Acid: Characterization and Biological Evaluation.Molecules. 2025 Jun 17;30(12):2621. doi: 10.3390/molecules30122621. Molecules. 2025. PMID: 40572584 Free PMC article.
References
MeSH terms
Substances
LinkOut - more resources
Full Text Sources
Medical
Miscellaneous
