. 2023 Mar 29;24(7):6398.
doi: 10.3390/ijms24076398.

Generating Functional and Highly Proliferative Melanocytes Derived from Human Pluripotent Stem Cells: A Promising Tool for Biotherapeutic Approaches to Treat Skin Pigmentation Disorders

Affiliations

Generating Functional and Highly Proliferative Melanocytes Derived from Human Pluripotent Stem Cells: A Promising Tool for Biotherapeutic Approaches to Treat Skin Pigmentation Disorders

Manoubia Saidani et al. Int J Mol Sci. .

Abstract

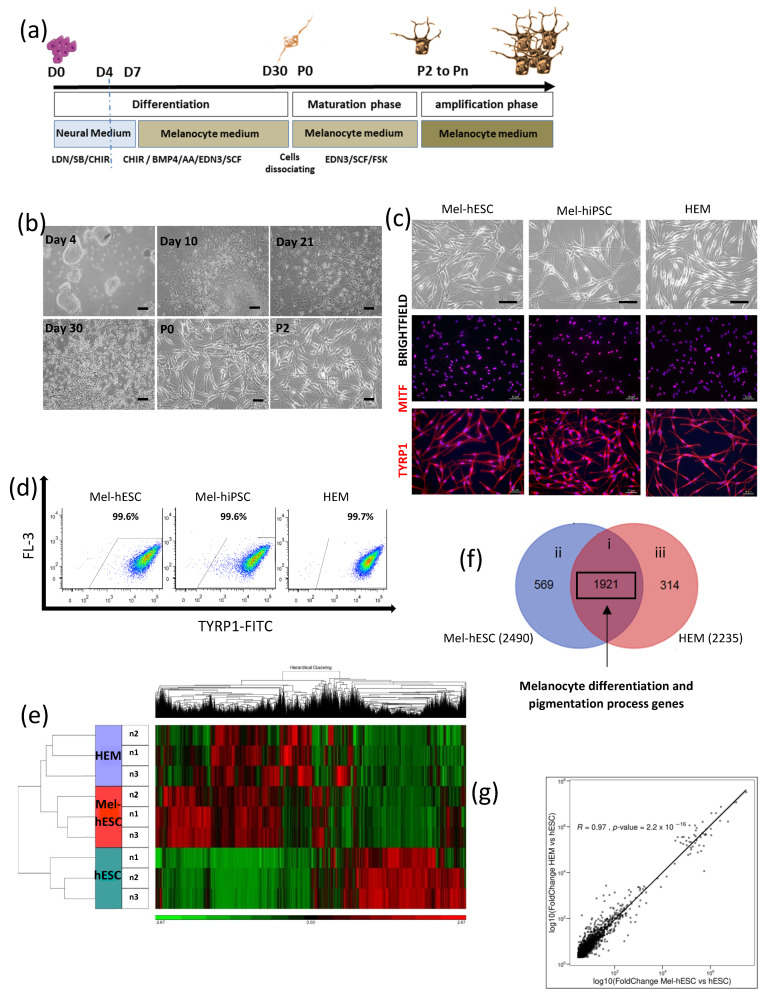
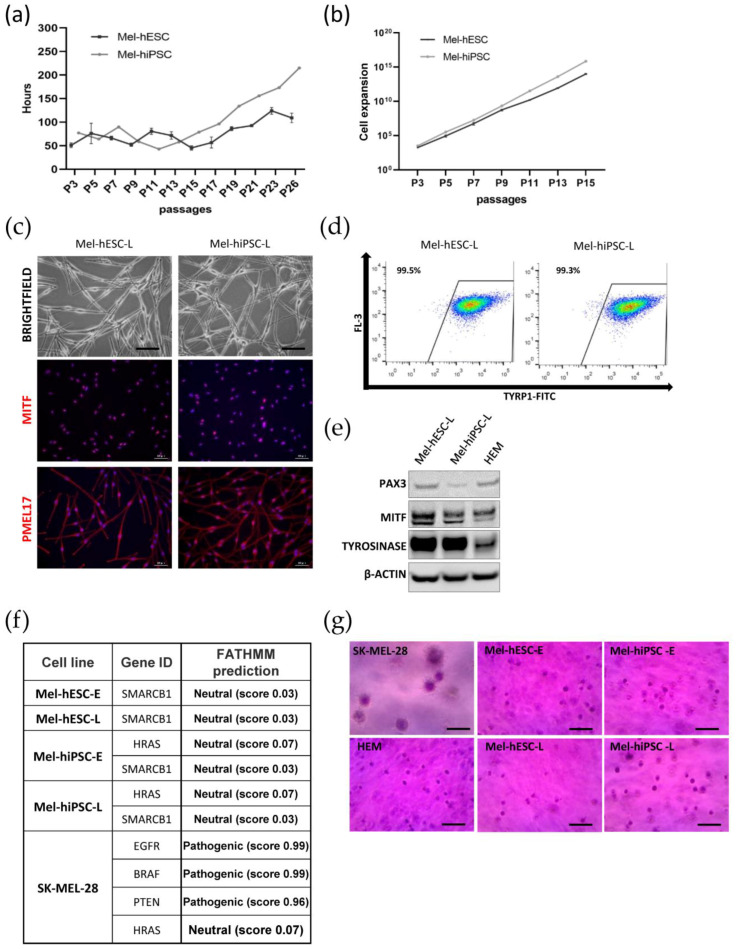
Melanocytes are essential for skin homeostasis and protection, and their loss or misfunction leads to a wide spectrum of diseases. Cell therapy utilizing autologous melanocytes has been used for years as an adjunct treatment for hypopigmentary disorders such as vitiligo. However, these approaches are hindered by the poor proliferative capacity of melanocytes obtained from skin biopsies. Recent advances in the field of human pluripotent stem cells have fueled the prospect of generating melanocytes. Here, we have developed a well-characterized method to produce a pure and homogenous population of functional and proliferative melanocytes. The genetic stability and potential transformation of melanocytes from pluripotent stem cells have been evaluated over time during the in vitro culture process. Thanks to transcriptomic analysis, the molecular signatures all along the differentiation protocol have been characterized, providing a solid basis for standardizing the protocol. Altogether, our results promise meaningful, broadly applicable, and longer-lasting advances for pigmentation disorders and open perspectives for innovative biotherapies for pigment disorders.

Keywords: human pluripotent stem cell; pigmentation-related skin disorders; skin regeneration.


Conflict of interest statement

The authors declare no conflict of interest.

Figures

Figure 1
Figure 1
Characterization of hPSC-derived melanocytes. (a) Diagram of the melanocytic differentiation from hPSCs. Illustrated using Servier Medical Arts-SMART image bank. (b) Microscopy images at different stages of melanocytic differentiation from hPSCs (scale bar: 50 µm). (c) Microscopy images of Mel-hESC and Mel-hiPSC at passage 6 (P6) compared to HEMs (P6). Immunofluorescence staining of MITF and TYRP1 in Mel-hPSC (scale bar: 50 µm). (d) Flow cytometry analysis of TYRP1 in Mel-hESC (P7), Mel-hiPSC (P6), and HEMs (P6). The Mel-hESC value represents the mean of six independent experiments with an SD ± 0.4. The HEM value represents the mean of three independent experiments with an SD ± 0.1. (e) Hierarchical clustering of gene expression. Comparison between HEMs (P6), Mel-hESC (P4), and hESC (n = 3). (f) Venn diagram showing comparative gene expression profiles of Mel-hESC (P4) and HEMs (P6). Gene lists are defined as genes upregulated in the two cell lines greater than 2-fold and with an FDR < 0.001 compared to hESCs. i represents common list between Mel-hESC and HEMs, ii as the 569 uregulated genes specific to Mel-hESC and iii as the 314 genes specific to HEMs. (g) Scatterplot showing a high correlation of 1921 gene expression levels in HEMs and Mel-hESC (R = 0.967) from indicated regions (i) of Venn diagram defined in (f).
Figure 2
Figure 2
Functionality of hPSC-derived melanocytes. (a) (left) Cell pellet pictures of Mel-hESC, Mel-hiPSC at passage 7, and HEMs. (right) Melanin content measurement in Mel-hESC, Mel-hiPSC, and HEMs. Each value represents the mean of three independent experiments. (b) Representative electronic microscopy images of melanosome stages in Mel-hESC, Mel-hiPSC, and HEMs. Characteristic immature unpigmented (stages I/II) and mature pigmented (stages III/IV) melanosomes are observed in the soma of melanocytes (scale bar: 10 μm). (c) Experimental diagram of in vitro pigmented epidermis reconstruction and in vivo grafting. Illustrated using Servier Medical Arts-SMART image bank. (d) Analysis of the in vitro pigmented reconstructed epidermis. (Upper) Inset pictures containing pigmented reconstructed epidermis without melanocytes (K), containing HEMs (K + HEMs), Mel-hESC (K + Mel-hESC), or Mel-hiPSC (K + Mel-hiPSC). (Lower) Immunofluorescence staining of Involucrin (IVL) and TYRP1 on sections of the reconstructed epidermis containing HEMs, Mel-hESC, or Mel-hiPSC (scale bar: 50 μm). (e) Fontana–Masson (left) stain and Involucrin (IVL) and TYRP1 immunofluorescence staining (right) on regenerated skin sections containing HEMs, Mel-hESC, or Mel-hiPSC. Black arrows show melanin staining in HEMs, Mel-hESC, or Mel-hiPSC integrated into the basal layer of regenerated skin (scale bar: for Fontana Masson (FM), 100 μm; for Immunofluorescence (IF), 50 μm). The Mel-hPSC used for the evaluation of functionality is at passage 6. Red color is Involucrin stain and green color represent TYRP1 stain.
Figure 3
Figure 3
Long-term proliferation of hPSC-derived melanocytes. (a) Doubling time measurements during the growing phase of the Mel-hESC and Mel-hiPSC, from passage 3 (P3) to passage 26 (P26). (b) Cumulated cell expansion calculated from passage 3 (P3) to passage 15 (P15). For the next parts of the figure, Mel-hPSC early passages (Mel-hPSC-E) are defined from P3 to P15 and Mel-hPSC late passages (Mel-hPSC-L) are defined from P15 to P26. (c) Microscopy analysis and immunofluorescence analysis of MITF, TYRP1, and PMEL17 in Mel-hESC-L and Mel-hiPSC-L. Scale bar is 50 µm. (d) Flow cytometry analysis of TYRP1 in Mel-hESC-L and Mel-hiPSC-L. Mel-hESC-L value represents the mean ± SD 0.05 of three independent experiments. (e) Expression of PAX3, MITF, and TYROSINASE proteins by Western blot in Mel-hESC-L and Mel-hiPSC-L compared to HEMs. Band intensities are normalized to β-actin. (f) AmpliSeq Cancer Hotspot Panel Library v2 in Mel-hESC and Mel-hiPSC at early and late passages. Samples tested included melanoma cell line (SK-MEL-28) as a positive control. The SNPs detected are compared to the database FATHMM (http://fathmm.biocompute.org.uk, accessed on 6 March 2017). (g) Soft agar assay for colony formation on early and late passages of Mel-hESC and Mel-hiPSC. SK-MEL-28 is used as a control for the melanoma cell line. HEMs are used as a control for adult melanocytes (scale bar is 50 µm).
Figure 4
Figure 4
Transcriptional analysis of Mel-hESC during the differentiation process in a time-dependent manner. (a) Principal components analysis (PCA) of each differentiation time point (day 0: D0, day 7: D7, day 14: D14, day 21: D21, and day 30: D30). (b) Hierarchical clustering of gene expression at D0, D7, D14, D21, and D30 (n = 3). (c) Graphics of 5 clusters. Clustering of genes statistically differentially expressed during differentiation and regrouped with the same expression profile. (d) (Upper) Gene network linked to MITF. The 328 genes contained in cluster 5 are analyzed in STRINGdb (with medium confidence 0.4). The global network obtained is sent to Cytoscape to identify a gene sub-network directly linked to MITF. A score is attributed to edges in terms of connectivity with MITF [13]. The size of gene circles is correlated with these scores. Genes circles colored in yellow are members of the “developmental pigmentation” gene ontology biological process term. (Lower) Top gene ontology biological process terms from enrichment analysis of the global STRINGdb network. Quantitative PCR of SOX10, MITF, DCT, TYR, and RAB27A during hESC differentiation from D0 to D30. The data are normalized to 18S and expressed as relative expressions of undifferentiated hESCs at D0. (e) Cluster 5 validation. Quantitative PCR of SOX10, TYR, MITF, DCT and RAB27 for Mel-hESC from D0 to D30. The data are normalized to 18S and expressed as relative expressions of D0. ** p < 0.01.
Figure 5
Figure 5
Maturation phase of hPSC-derived melanocytes. (a) Hierarchical clustering of gene expression. Comparison of Mel-hESC at passage 0 (P0) and Mel-hESC at passage 4 (P4) (n = 3). P0 is the first passage after the dissociating stage after 30 days of differentiation. (b) Gene ontology enrichment analysis of 1309 upregulated DEGs. Comparison of gene expression of Mel-hESC at P4 to P0 via ENRICH’R tool. (c) Quantitative PCR of MITF, TYR, TRP1, and PMEL17 for Mel-hESC from P0 to P6. The data are normalized to 18S and expressed as relative expressions of Mel-hESC at P0. (d) TYRP1 expression by flow cytometry analysis of Mel-hESC at P0, P1, P2, and P6. Each value represents the mean of three independent experiments with SD. The dotted line represents a TYRP1 intensity threshold established on cells at P6. (e) Expression analysis of tyrosinase (TYR) by Western blot in Mel-hESC P0, P1, P2, P3, and P6. Band intensities were normalized by β-actin. (f) Melanin content measurement in Mel-hESC P0, P1, P2, P3, and P6. Each value represents the mean ± SD from three independent experiments. For statistical significance, n.s. denotes nonsignificant, * p < 0.05 and ** p < 0.01.

Similar articles

Cited by

References

    1. Mort R.L., Jackson I.J., Patton E.E. The melanocyte lineage in development and disease. Development. 2015;142:620–632. doi: 10.1242/dev.106567. - DOI - PMC - PubMed
    1. Feng Y., Lu Y. Advances in vitiligo: Update on therapeutic targets. Front. Immunol. 2022;13:986918. doi: 10.3389/fimmu.2022.986918. - DOI - PMC - PubMed
    1. Kawakami T. Surgical procedures and innovative approaches for vitiligo regenerative treatment and melanocytorrhagy. J. Dermatol. 2022;49:391–401. doi: 10.1111/1346-8138.16316. - DOI - PubMed
    1. Tang J., Li Q., Cheng B., Jing L. Primary culture of human face skin melanocytes for the study of hyperpigmentation. Cytotechnology. 2014;66:891–898. doi: 10.1007/s10616-013-9643-6. - DOI - PMC - PubMed
    1. Sułkowski M., Kot M., Badyra B., Paluszkiewicz A., Płonka P.M., Sarna M., Michalczyk-Wetula D., Zucca F.A., Zecca L., Majka M. Highly Effective Protocol for Differentiation of Induced Pluripotent Stem Cells (iPS) into Melanin-Producing Cells. Int. J. Mol. Sci. 2021;22:12787. doi: 10.3390/ijms222312787. - DOI - PMC - PubMed