. 2023 Mar 29;24(7):6420.
doi: 10.3390/ijms24076420.

PD-1 Independent Role of PD-L1 in Triple-Negative Breast Cancer Progression

Affiliations

PD-1 Independent Role of PD-L1 in Triple-Negative Breast Cancer Progression

Duaa Alkaabi et al. Int J Mol Sci. .

Abstract

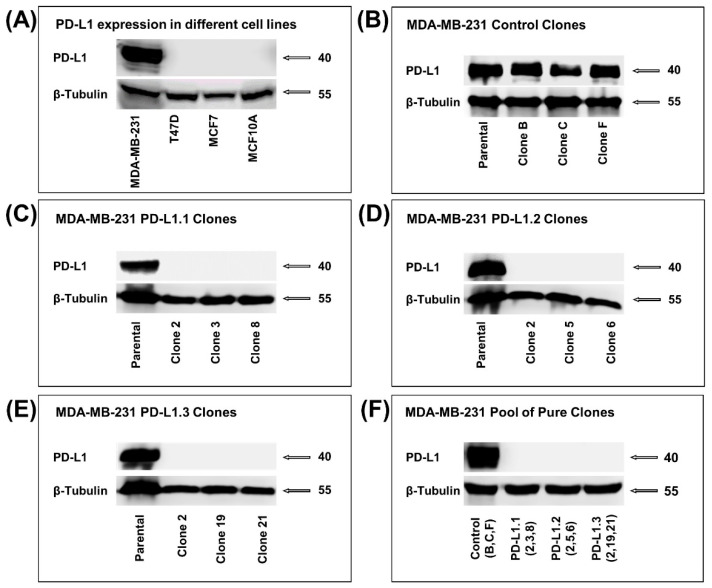
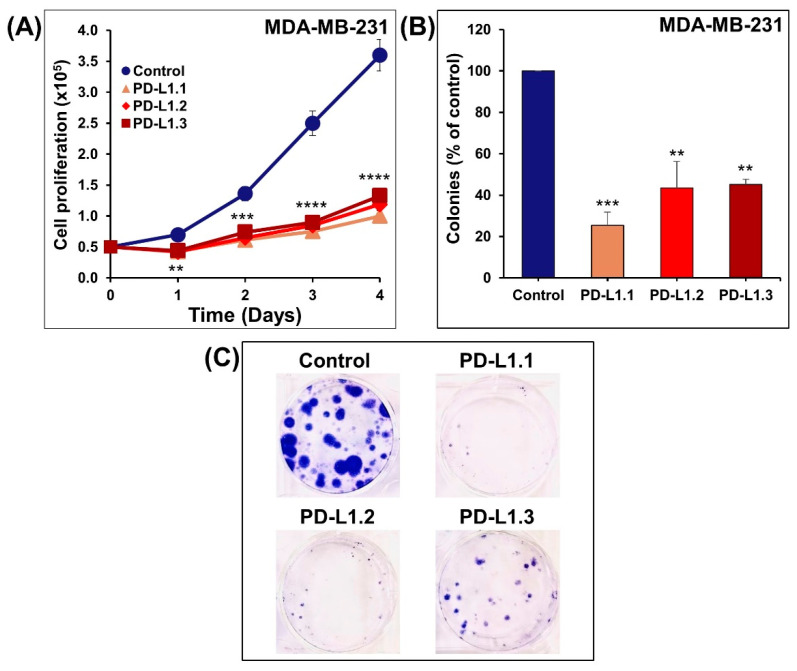
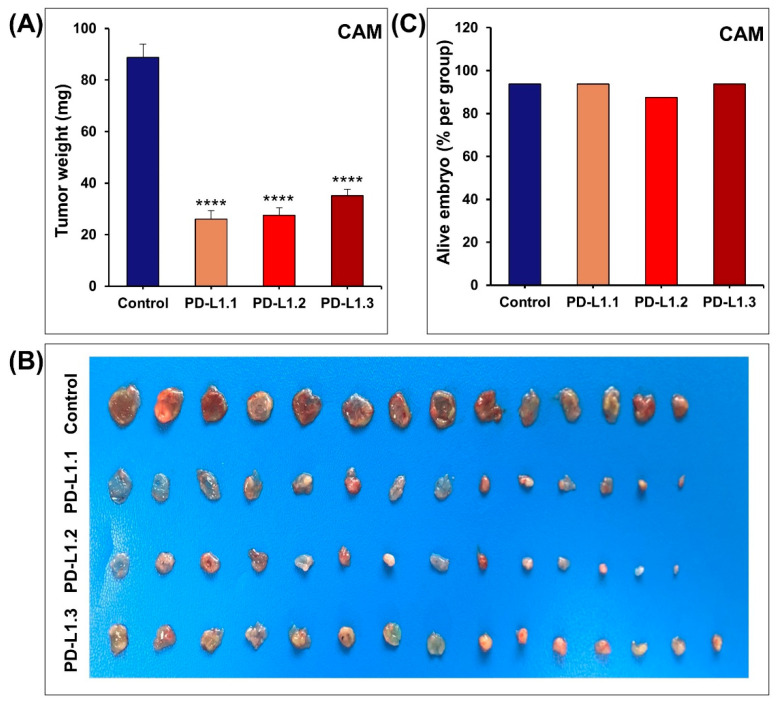
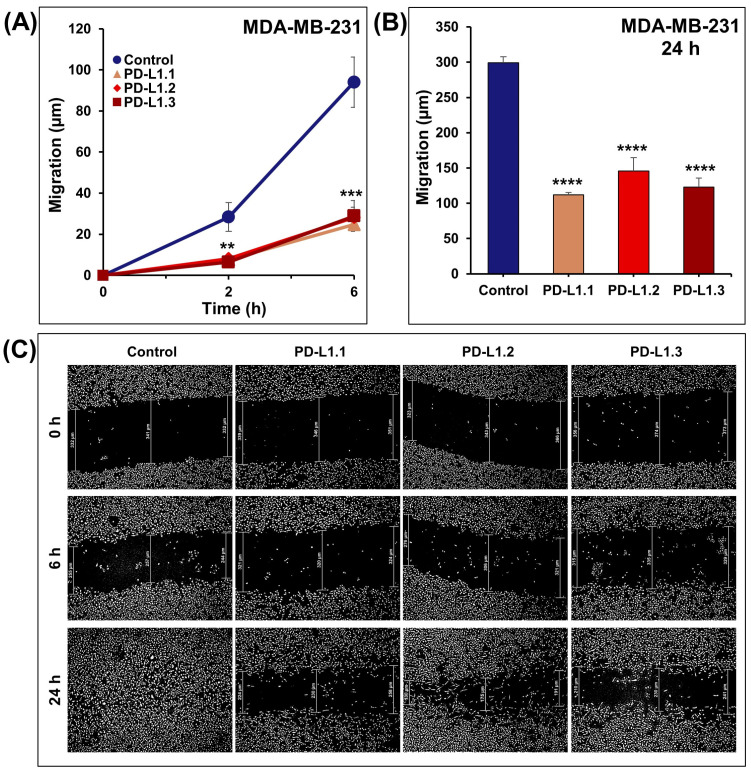
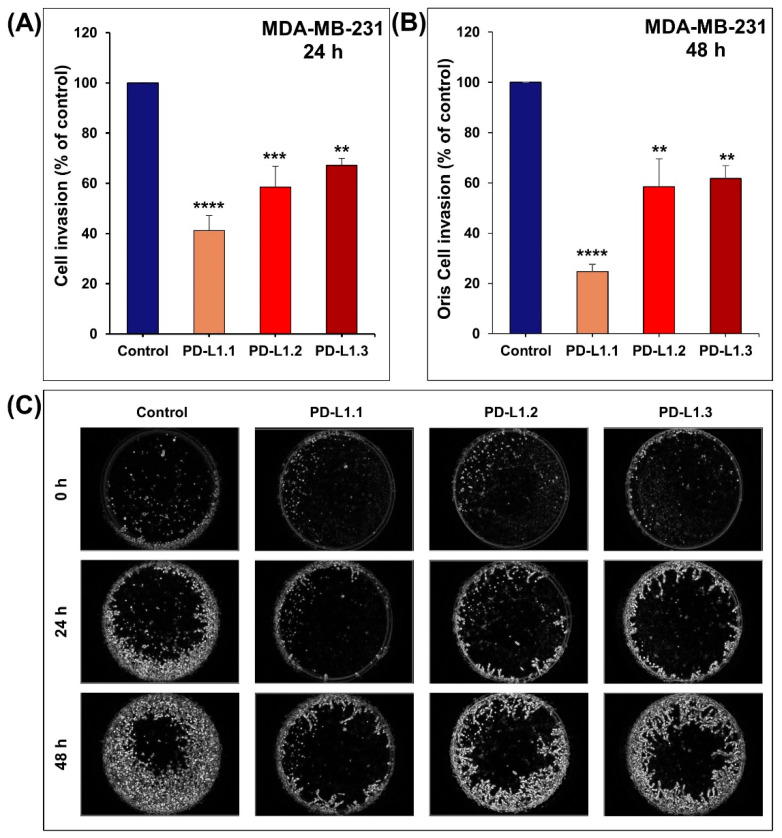
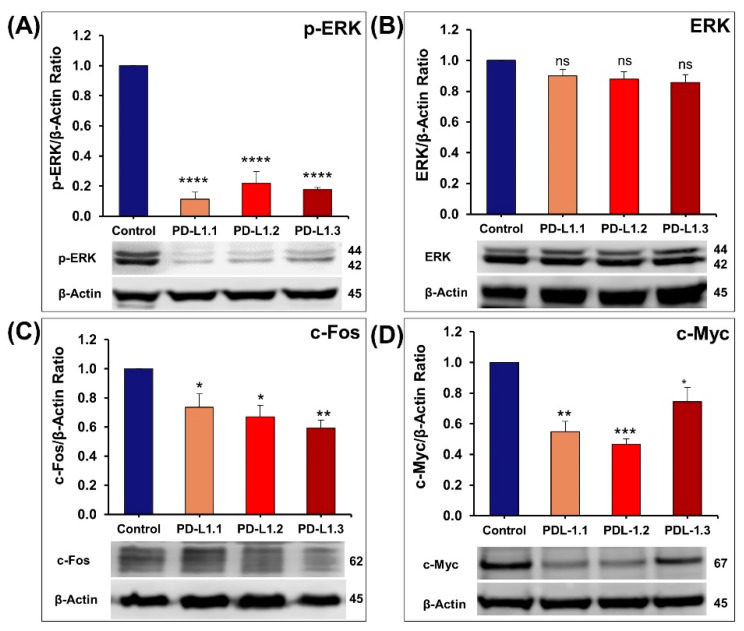
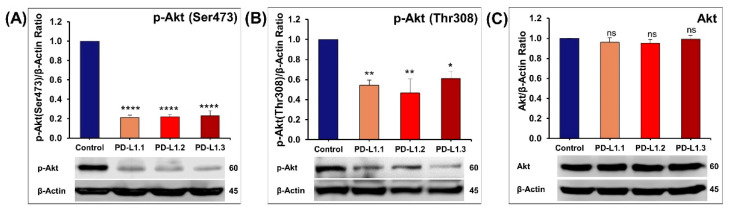
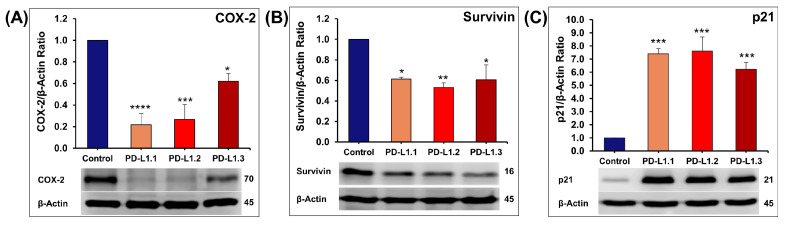
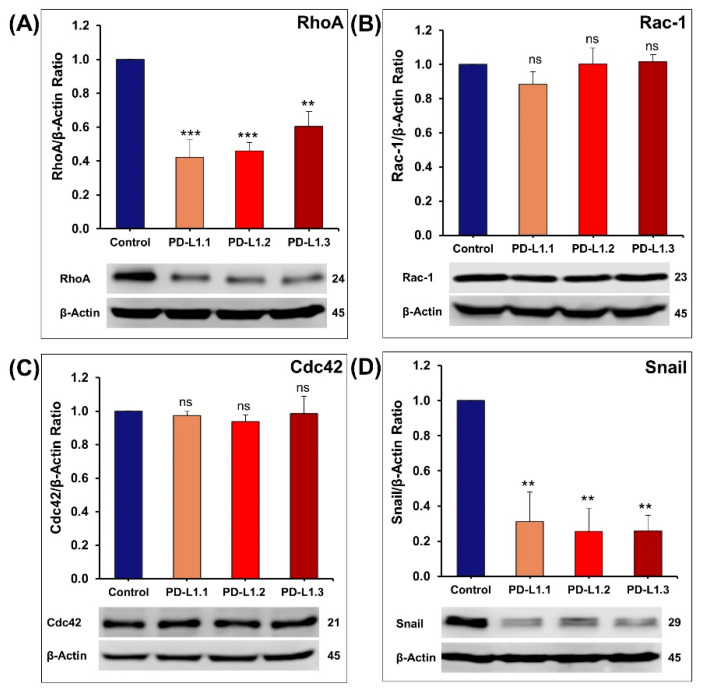
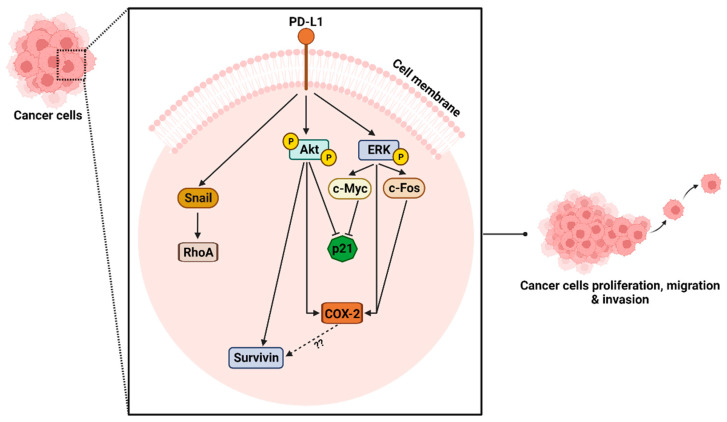
Triple-negative breast cancer (TNBC) is a type of breast malignancy characterized by a high proliferative rate and metastatic potential leading to treatment failure, relapse, and poor prognosis. Therefore, efforts are continuously being devoted to understanding its biology and identifying new potential targets. Programmed death-ligand 1 (PD-L1) is an immunosuppressive protein that inactivates T cells by binding to the inhibitory receptor programmed death-1 (PD-1). PD-L1 overexpression in cancer cells contributes to immune evasion and, subsequently, poor survival and prognosis in several cancers, including breast cancer. Apart from its inhibitory impact on T cells, this ligand is believed to have an intrinsic role in cancer cells. This study was performed to clarify the PD-1 independent role of PD-L1 in TNBC MDA-MB-231 cells by knocking out the PD-L1 using three designs of CRISPR-Cas9 lentiviral particles. Our study revealed that PD-L1 knockout significantly inhibited MDA-MB-231 cell proliferation and colony formation in vitro and tumor growth in the chick embryo chorioallantoic membrane (CAM) model in vivo. PD-L1 knockout also decreased the migration and invasion of MDA-MB-231 cells in vitro. We have shown that PD-L1 knockout MDA-MB-231 cells have low levels of p-Akt and p-ERK in addition to some of their downstream proteins, c-Fos, c-Myc, p21, survivin, and COX-2. Furthermore, PD-L1 knockout significantly decreased the expression of Snail and RhoA. This study shows the intrinsic role of PD-L1 in TNBC independently of its binding to PD-1 receptors on T cells. It may pave the way for developing novel therapeutic strategies using PD-L1 inhibitors alone and in combination to treat TNBC more effectively.

Keywords: Akt; CAM; ERK; PD-L1; TNBC; invasion; migration; proliferation.


Conflict of interest statement

The authors declare no conflict of interest. The funders had no role in the design of the study; in the collection, analyses, or interpretation of data; in the writing of the manuscript, or in the decision to publish the results.

Figures

Figure 1
Figure 1
PD-L1 knockout in MDA-MB-231 cell line using CRISPR/Cas9. (A) Western blot showing the level of PD-L1 in different breast cell lines. (BE) Western blot showing the level of PD-L1 in the pure clones of the control, PD-L1.1, PD-L1.2, and PD-L1.3. (F) Western blot showing PD-L1 level in the pool of the three selected pure clones from the control and each design of sgRNA targeting PD-L1.
Figure 2
Figure 2
Impact of PD-L1 knockout on proliferation rate and colony growth of MDA-MB-231. (A) Control- and PD-L1 knockout cells were seeded into six-well plates for 1, 2, 3, and 4 days. The cells proliferation was determined using a cell counter as described in the Materials and Methods. (B,C) The control and knockout cells were seeded and kept to form colonies for 3 weeks after which the colonies were fixed, stained, and counted, as described in the Materials and Methods. Experiments were repeated three times. Shapes/Columns represent mean; bars represent S.E.M. ** p < 0.01, *** p < 0.001, **** p < 0.0001.
Figure 3
Figure 3
Impact of PD-L1 knockout on tumor growth in chick embryo CAM. (A) Tumor weight of the control and PD-L1 knockout cells. The cells were inoculated and allowed to grow on chick embryo CAM for 8 days. (B) Pictures of the tumors after extraction on Day 17. (C) Percentage of alive embryos in each group. Columns are means; bars are S.E.M. **** p < 0.0001.
Figure 4
Figure 4
PD-L1 knockout significantly decreases MDA-MB-231 cell migration in vitro. Using wound healing assay, scratches were introduced to the adherent monolayer of control and PD-L1 knockout cells. (A,B) Migration distance was determined after 2, 6, and 24 h. (C) Representative pictures of the healing progress of the induced wounds at the indicated time points. Experiments were repeated at least three times. Columns or shapes are means; bars are S.E.M. ** p < 0.01. *** p < 0.001. **** p < 0.0001.
Figure 5
Figure 5
PD-L1 knockout significantly decreases MDA-MB-231 invasion in vitro. (A) Using Boyden Matrigel invasion chamber assay, control and PD-L1 knockout cells were seeded in the upper chamber for 24 h. The invading cells into the lower chamber were determined using CellTiter-Glo Luminescent. (B,C) Using Oris Matrigel invasion assay, invasion of the control and PD-L1 knockout cells into the detection zone was monitored for 24 and 48 h. Experiments were repeated at least 3 times. Columns are means; bars are S.E.M. ** p < 0.01. *** p < 0.001. **** p < 0.0001.
Figure 6
Figure 6
Quantification of the western blot showing the impact of PD-L1 knockout on the expression of p-ERK and total ERK (A,B), c-Fos (C), and c-Myc (D). Columns represent mean of at least three independent experiments; bars represent S.E.M. * p < 0.05. ** p < 0.01. *** p < 0.001. **** p < 0.0001. ns—non-significant.
Figure 7
Figure 7
Quantification of the western blot showing the impact of PD-L1 knockout on the expression of p-Akt (Ser473) (A), p-Akt (Thr308) (B), and total Akt (C). Columns represent mean of at least three independent experiments; bars represent S.E.M. * p < 0.05. ** p < 0.01. **** p < 0.0001. ns—non-significant.
Figure 8
Figure 8
Quantification of the western blot showing the impact of PD-L1 knockout on the expression of COX-2 (A), Survivin (B), and p21 (C). Columns represent mean of at least three independent experiments; bars represent S.E.M. * p < 0.05. ** p < 0.01. *** p < 0.001. **** p < 0.0001.
Figure 9
Figure 9
Quantification of western blot showing the effect of PD-L1 knockout on the expression of RhoA (A), Rac-1 (B), Cdc42 (C), and Snail (D). Experiments were repeated at least three times. Results are expressed as means ± S.E.M. ** p < 0.01. *** p < 0.001. ns—non-significant.
Figure 10
Figure 10
Diagram highlighting the potential downstream signaling of PD-L1 in TNBC. Created with BioRender.com.

References

    1. Sung H., Ferlay J., Siegel R.L., Laversanne M., Soerjomataram I., Jemal A., Bray F. Global Cancer Statistics 2020: GLOBOCAN Estimates of Incidence and Mortality Worldwide for 36 Cancers in 185 Countries. CA Cancer J. Clin. 2021;71:209–249. doi: 10.3322/caac.21660. - DOI - PubMed
    1. Yin L., Duan J.-J., Bian X.-W., Yu S.-C. Triple-negative breast cancer molecular subtyping and treatment progress. Breast Cancer Res. 2020;22:61. doi: 10.1186/s13058-020-01296-5. - DOI - PMC - PubMed
    1. Ensenyat-Mendez M., Llinàs-Arias P., Orozco J.I.J., Íñiguez-Muñoz S., Salomon M.P., Sesé B., DiNome M.L., Marzese D.M. Current Triple-Negative Breast Cancer Subtypes: Dissecting the Most Aggressive Form of Breast Cancer. Front. Oncol. 2021;11:681476. doi: 10.3389/fonc.2021.681476. - DOI - PMC - PubMed
    1. Cirqueira M.B., Mendonça C.R., Noll M., Soares L.R., de Paula Carneiro Cysneiros M.A., Paulinelli R.R., Moreira M.A.R., Freitas-Junior R. Prognostic Role of PD-L1 Expression in Invasive Breast Cancer: A Systematic Review and Meta-Analysis. Cancers. 2021;13:6090. doi: 10.3390/cancers13236090. - DOI - PMC - PubMed
    1. Wu Y., Chen W., Xu Z.P., Gu W. PD-L1 Distribution and Perspective for Cancer Immunotherapy—Blockade, Knockdown, or Inhibition. Front. Immunol. 2019;10:2022. doi: 10.3389/fimmu.2019.02022. - DOI - PMC - PubMed