

Transcriptomic Analysis of Heat Stress Response in Brassica rapa L. ssp. pekinensis with Improved Thermotolerance through Exogenous Glycine Betaine
- PMID: 37047402
- PMCID: PMC10094913
- DOI: 10.3390/ijms24076429
Transcriptomic Analysis of Heat Stress Response in Brassica rapa L. ssp. pekinensis with Improved Thermotolerance through Exogenous Glycine Betaine
Abstract
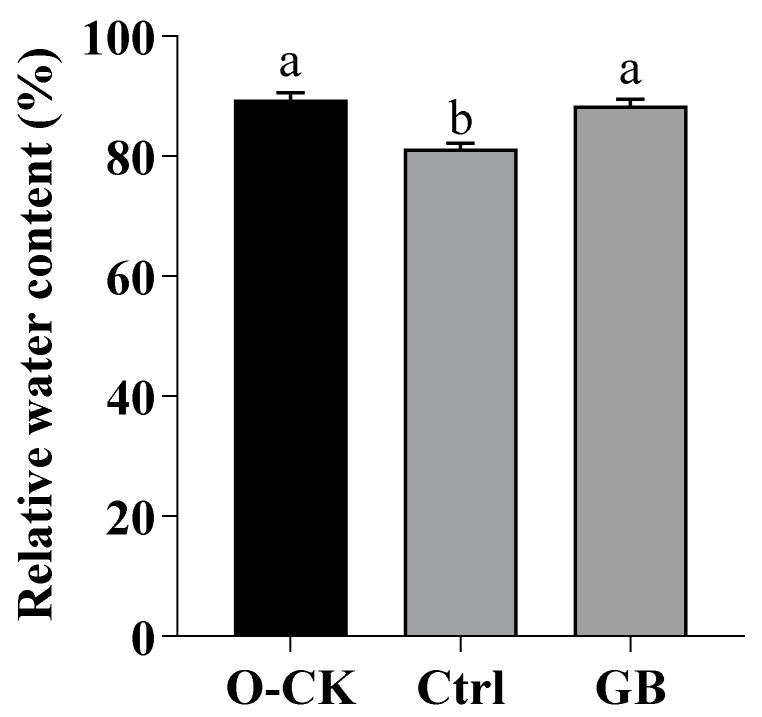
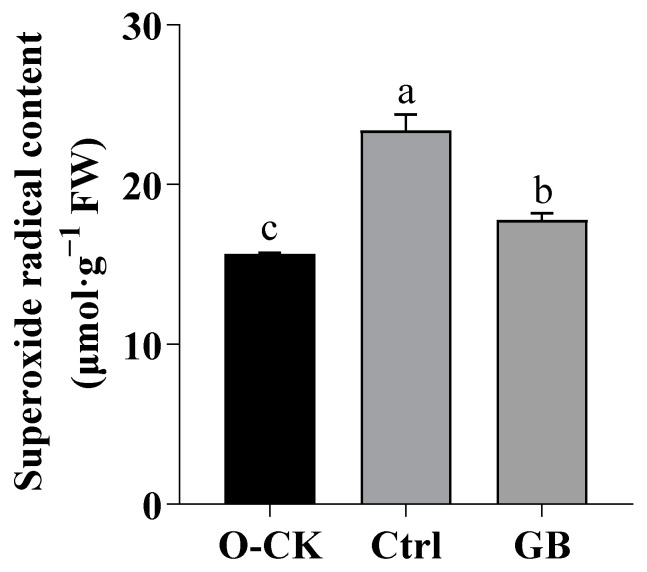
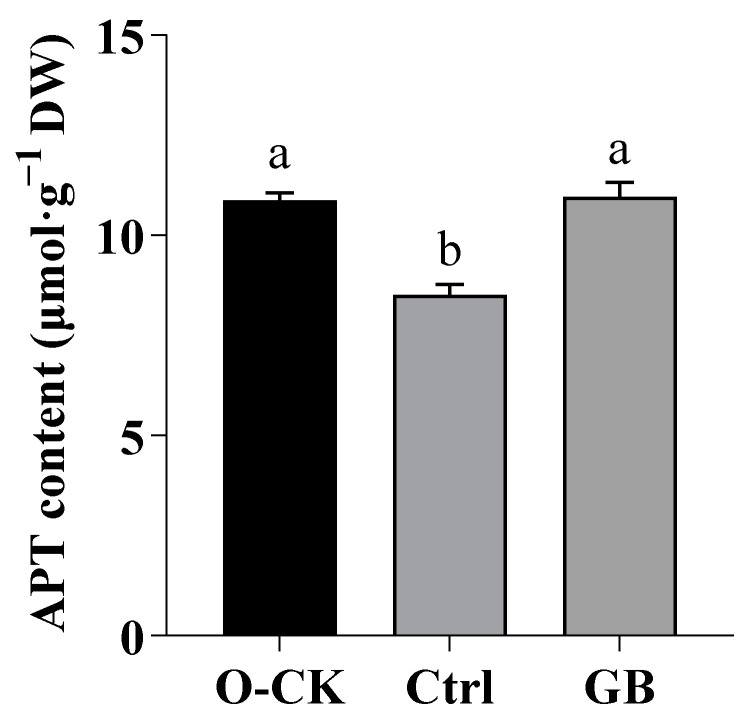
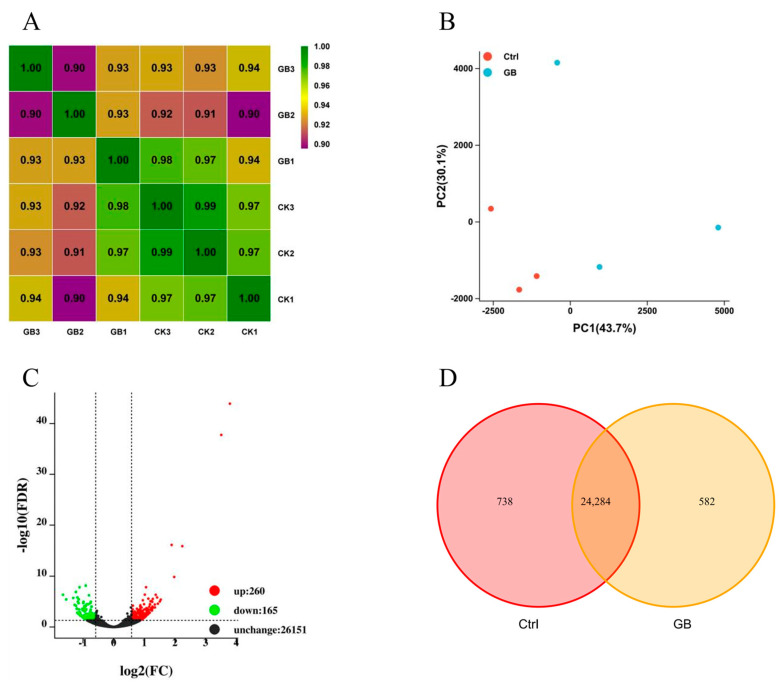
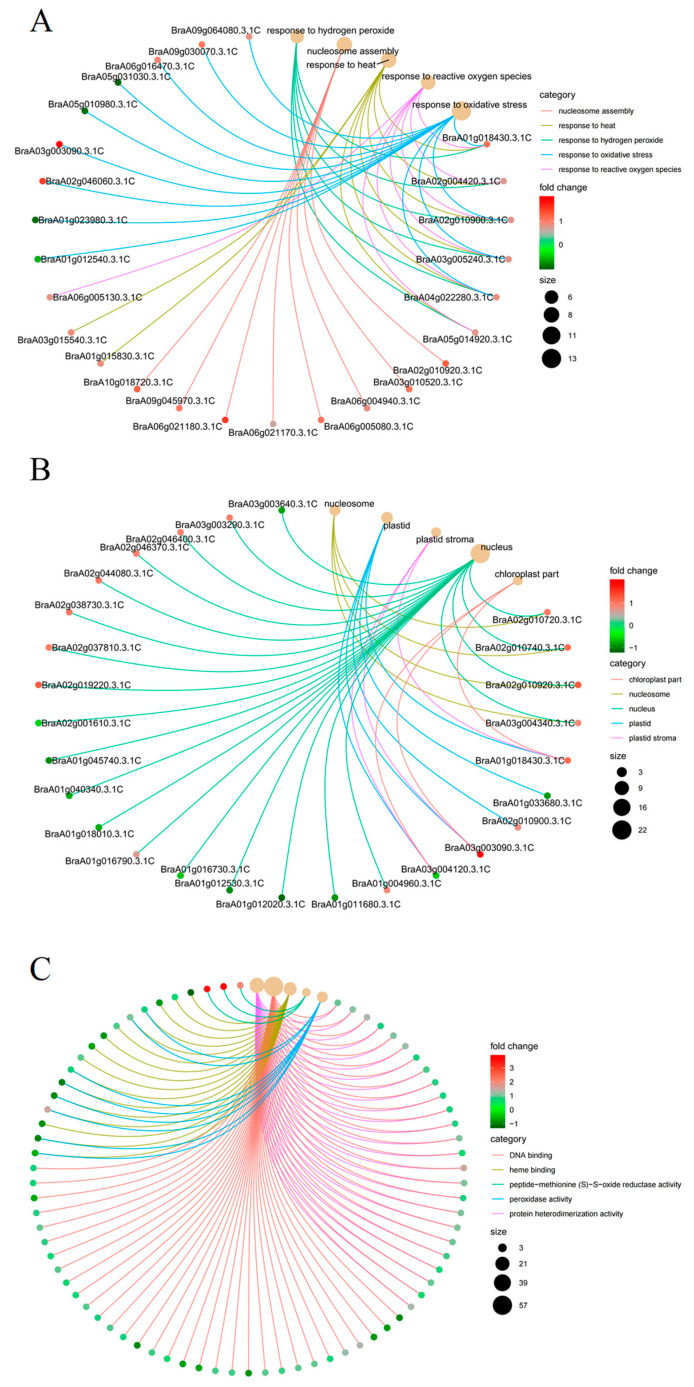
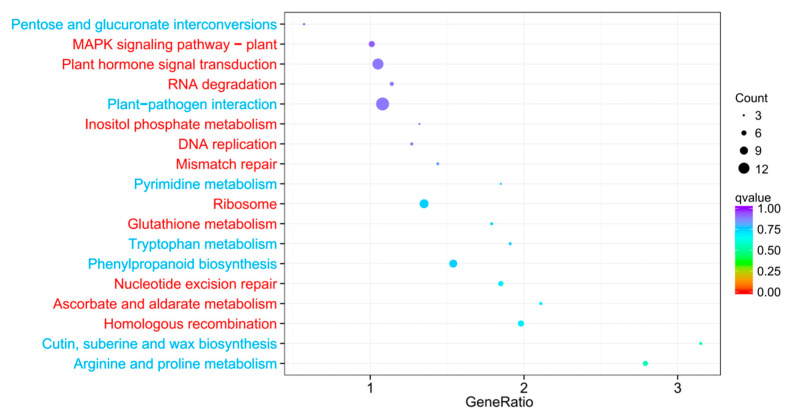
Chinese cabbage (Brassica rapa L. ssp. pekinensis) is sensitive to high temperature, which will cause the B. rapa to remain in a semi-dormancy state. Foliar spray of GB prior to heat stress was proven to enhance B. rapa thermotolerance. In order to understand the molecular mechanisms of GB-primed resistance or adaptation towards heat stress, we investigated the transcriptomes of GB-primed and non-primed heat-sensitive B. rapa 'Beijing No. 3' variety by RNA-Seq analysis. A total of 582 differentially expressed genes (DEGs) were identified from GB-primed plants exposed to heat stress relative to non-primed plants under heat stress and were assigned to 350 gene ontology (GO) pathways and 69 KEGG (Kyoto Encyclopedia of Genes and Genomes) pathways. The analysis of the KEGG enrichment pathways revealed that the most abundantly up-regulated pathways were protein processing in endoplasmic reticulum (14 genes), followed by plant hormone signal transduction (12 genes), ribosome (8 genes), MAPK signaling pathway (8 genes), homologous recombination (7 genes), nucleotide excision repair metabolism (5 genes), glutathione metabolism (4 genes), and ascorbate and aldarate metabolism (4 genes). The most abundantly down-regulated pathways were plant-pathogen interaction (14 genes), followed by phenylpropanoid biosynthesis (7 genes); arginine and proline metabolism (6 genes); cutin, suberine, and wax biosynthesis (4 genes); and tryptophan metabolism (4 genes). Several calcium sensing/transducing proteins, as well as transcription factors associated with abscisic acid (ABA), salicylic acid (SA), auxin, and cytokinin hormones were either up- or down-regulated in GB-primed B. rapa plants under heat stress. In particular, expression of the genes for antioxidant defense, heat shock response, and DNA damage repair systems were highly increased by GB priming. On the other hand, many of the genes involved in the calcium sensors and cell surface receptors involved in plant innate immunity and the biosynthesis of secondary metabolites were down-regulated in the absence of pathogen elicitors in GB-primed B. rapa seedlings. Overall GB priming activated ABA and SA signaling pathways but deactivated auxin and cytokinin signaling pathways while suppressing the innate immunity in B. rapa seedlings exposed to heat stress. The present study provides a preliminary understanding of the thermotolerance mechanisms in GB-primed plants and is of great importance in developing thermotolerant B. rapa cultivars by using the identified DEGs through genetic modification.
Keywords: B. rapa; HSP; glycine betaine; heat stress; protein processing in endoplasmic reticulum; thermotolerance.
Conflict of interest statement
The authors declare no conflict of interest.
Figures
Similar articles
-
Glutamic Acid and Poly-γ-glutamic Acid Enhanced the Heat Resistance of Chinese Cabbage (Brassica rapa L. ssp. pekinensis) by Improving Carotenoid Biosynthesis, Photosynthesis, and ROS Signaling.Int J Mol Sci. 2022 Oct 1;23(19):11671. doi: 10.3390/ijms231911671. Int J Mol Sci. 2022. PMID: 36232971 Free PMC article.
-
Glycine Betaine and β-Aminobutyric Acid Mitigate the Detrimental Effects of Heat Stress on Chinese Cabbage (Brassica rapa L. ssp. pekinensis) Seedlings with Improved Photosynthetic Performance and Antioxidant System.Plants (Basel). 2022 Apr 29;11(9):1213. doi: 10.3390/plants11091213. Plants (Basel). 2022. PMID: 35567214 Free PMC article.
-
Enhanced Resistance to Sclerotinia sclerotiorum in Brassica rapa by Activating Host Immunity through Exogenous Verticillium dahliae Aspf2-like Protein (VDAL) Treatment.Int J Mol Sci. 2022 Nov 12;23(22):13958. doi: 10.3390/ijms232213958. Int J Mol Sci. 2022. PMID: 36430439 Free PMC article.
-
Gene co-expression network analysis reveals key pathways and hub genes in Chinese cabbage (Brassica rapa L.) during vernalization.BMC Genomics. 2021 Apr 6;22(1):236. doi: 10.1186/s12864-021-07510-8. BMC Genomics. 2021. PMID: 33823810 Free PMC article. Review.
-
Impact of High-Temperature Stress on Maize Seed Setting: Cellular and Molecular Insights of Thermotolerance.Int J Mol Sci. 2025 Feb 2;26(3):1283. doi: 10.3390/ijms26031283. Int J Mol Sci. 2025. PMID: 39941051 Free PMC article. Review.
Cited by
-
Integrated Analysis of the Transcriptome and Metabolome of Brassica rapa Revealed Regulatory Mechanism under Heat Stress.Int J Mol Sci. 2023 Sep 12;24(18):13993. doi: 10.3390/ijms241813993. Int J Mol Sci. 2023. PMID: 37762295 Free PMC article.
-
Exogenous betaine enhances salt tolerance of Glycyrrhiza uralensis through multiple pathways.BMC Plant Biol. 2024 Mar 2;24(1):165. doi: 10.1186/s12870-024-04851-w. BMC Plant Biol. 2024. PMID: 38431542 Free PMC article.
-
Comparative physiological and transcriptomic analyses identify computationally predicted key genes and regulatory pathways in non-heading Chinese cabbage under heat stress.BMC Plant Biol. 2025 Aug 8;25(1):1042. doi: 10.1186/s12870-025-07120-6. BMC Plant Biol. 2025. PMID: 40781588 Free PMC article.
-
Transcriptomic Analysis of the CAM Species Kalanchoë fedtschenkoi Under Low- and High-Temperature Regimes.Plants (Basel). 2024 Dec 8;13(23):3444. doi: 10.3390/plants13233444. Plants (Basel). 2024. PMID: 39683237 Free PMC article.
References
-
- Parankusam S., Bhatnagar-Mathur P., Sharma K.K. Heat responsive proteome changes reveal molecular mechanisms underlying heat tolerance in chickpea. Environ. Exp. Bot. 2017;141:132–144. doi: 10.1016/j.envexpbot.2017.07.007. - DOI
-
- Karkute S.G., Ansari W.A., Singh A.K., Singh P.M., Rai N., Bahoadur A., Singh J. Characterization of high-temperature stress-tolerant tomato (Solanum lycopersicum L.) genotypes by biochemical analysis and expression profiling of heat-responsive genes. 3 Biotech. 2021;11:45. doi: 10.1007/s13205-020-02587-6. - DOI - PMC - PubMed
MeSH terms
Substances
Grants and funding
LinkOut - more resources
Full Text Sources
