. 2023 Mar 30;24(7):6473.
doi: 10.3390/ijms24076473.

Triple Negative Breast Cancer Preclinical Therapeutic Management by a Cationic Ruthenium-Based Nucleolipid Nanosystem

Affiliations

Triple Negative Breast Cancer Preclinical Therapeutic Management by a Cationic Ruthenium-Based Nucleolipid Nanosystem

Maria Grazia Ferraro et al. Int J Mol Sci. .

Abstract

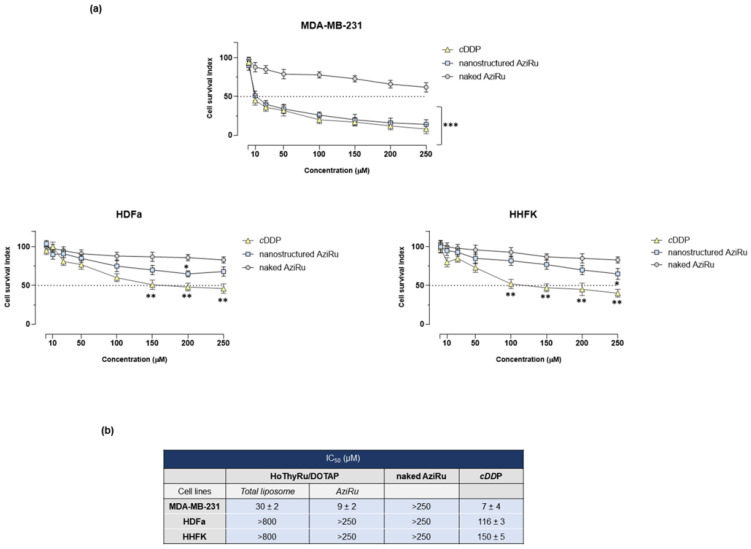
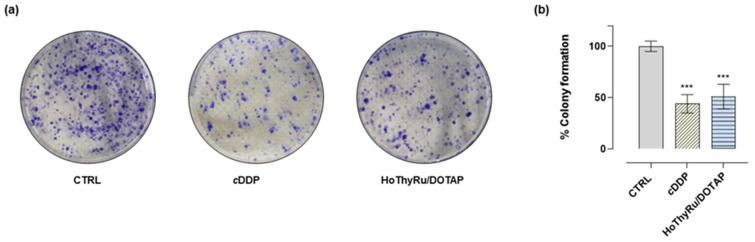
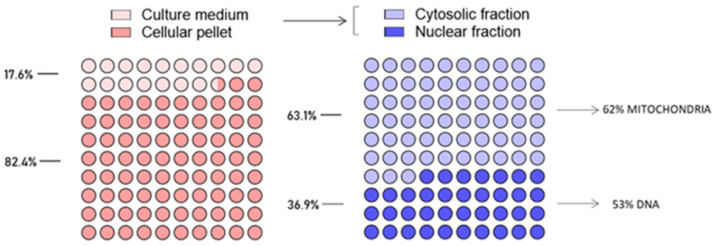
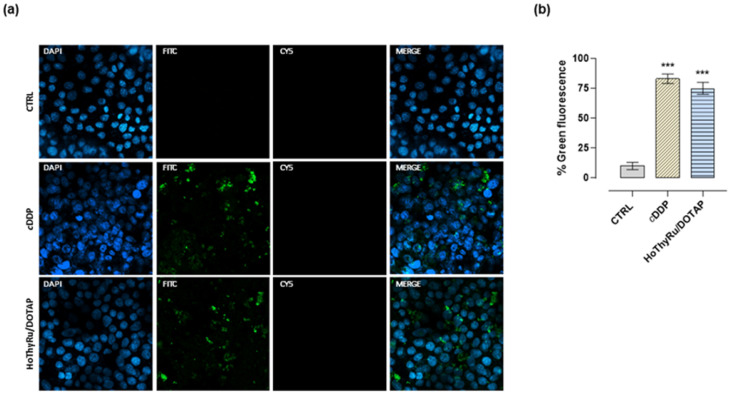
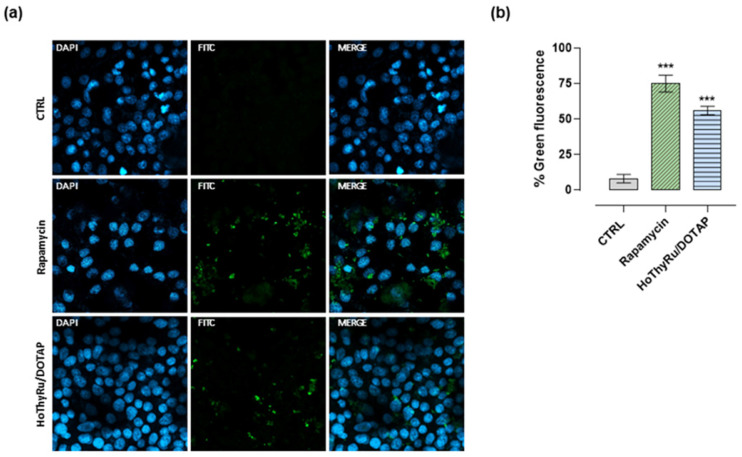
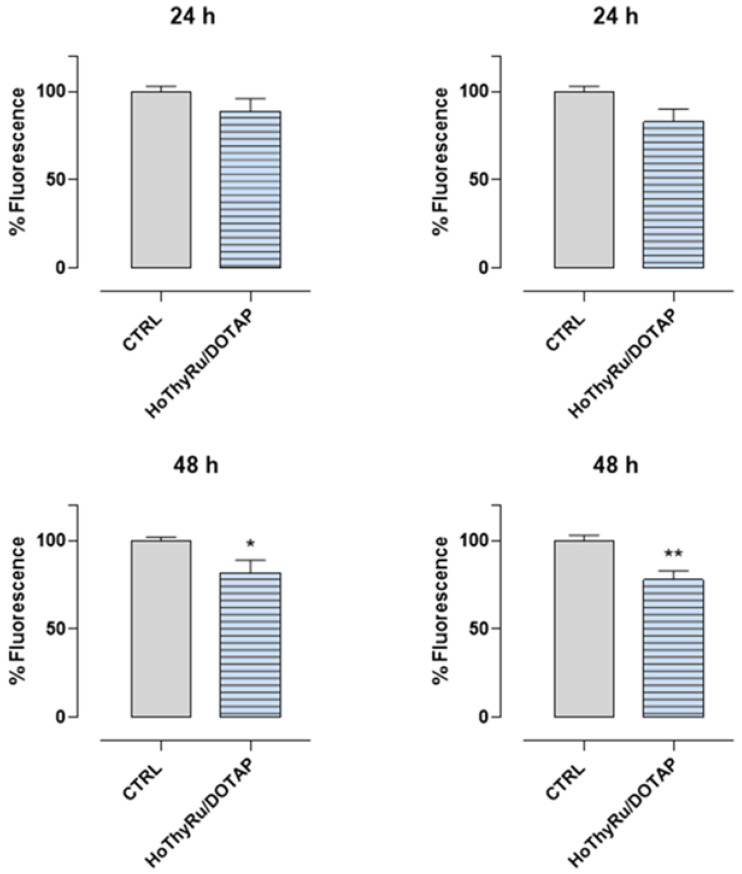
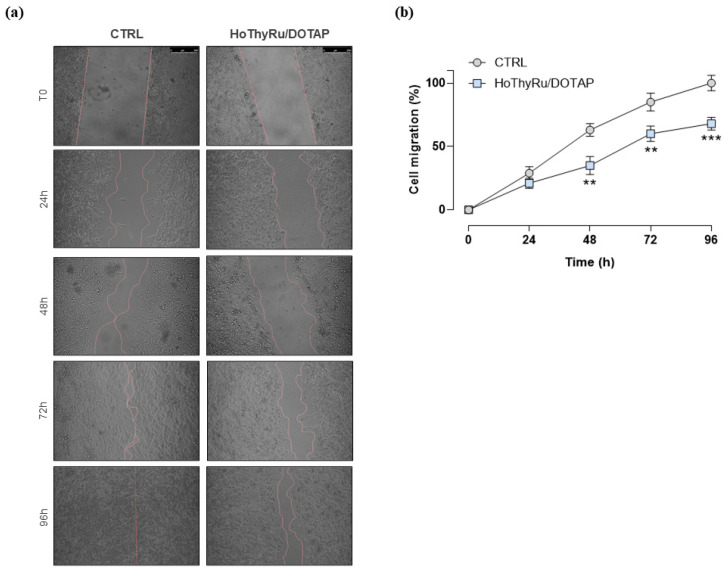
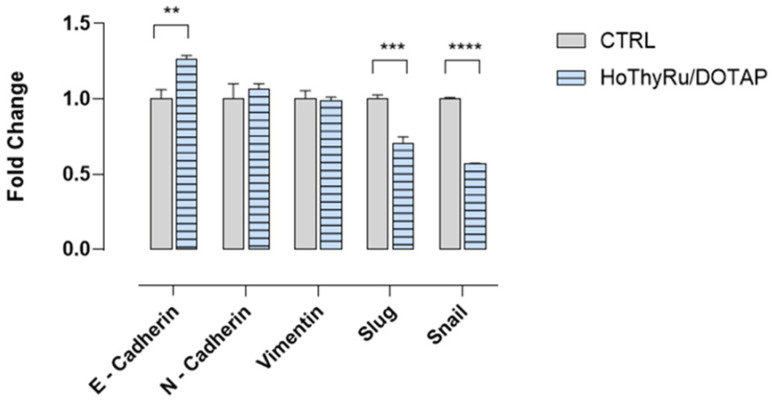
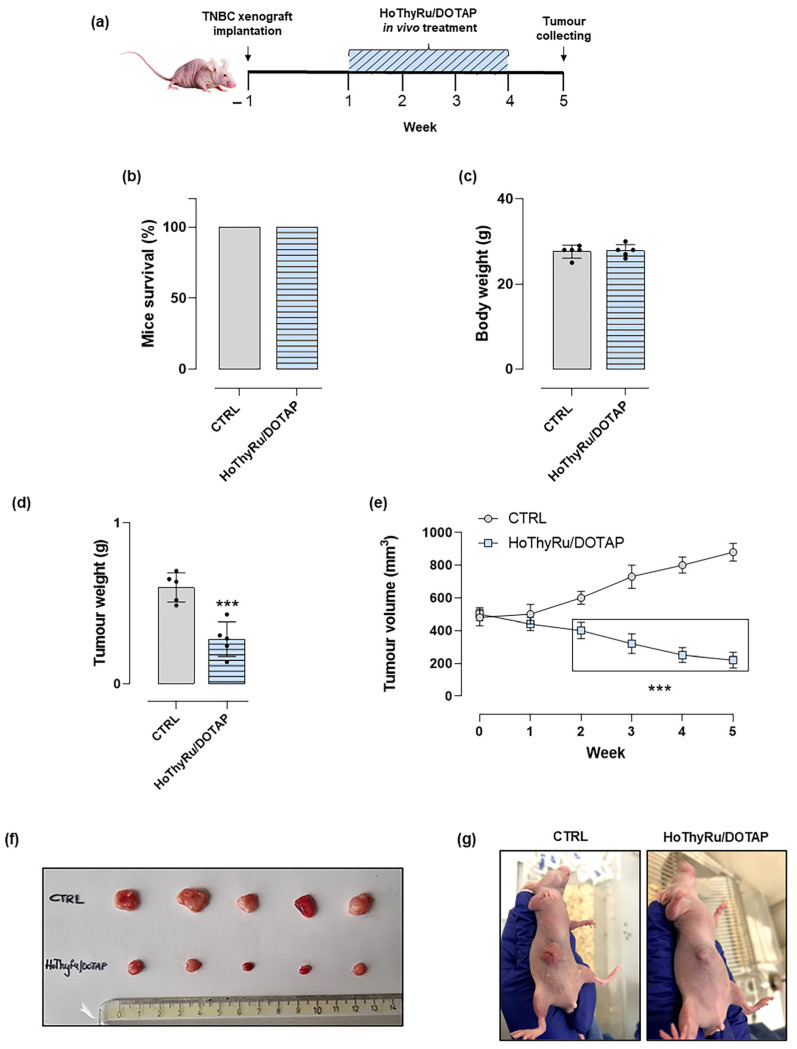
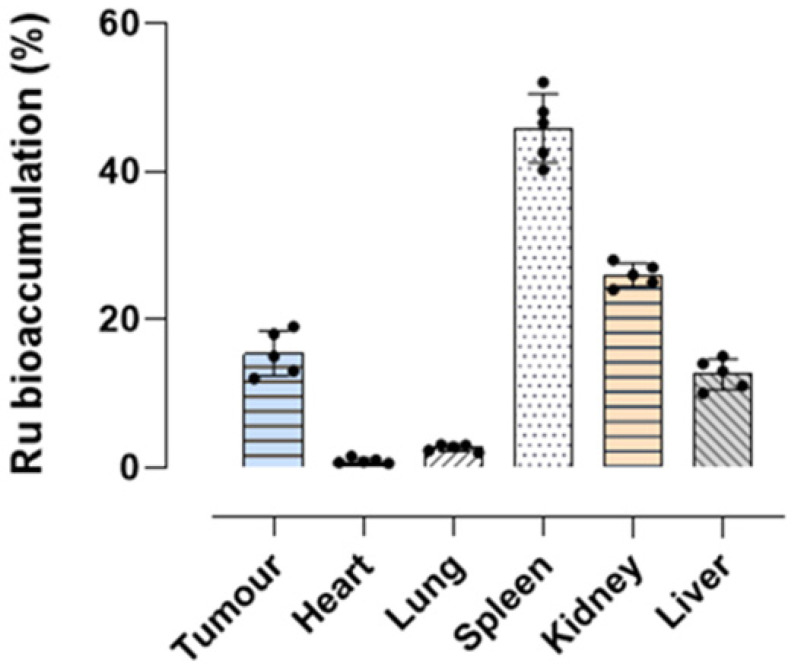
Based on compelling preclinical evidence concerning the progress of our novel ruthenium-based metallotherapeutics, we are focusing research efforts on challenging indications for the treatment of invasive neoplasms such as the triple-negative breast cancer (TNBC). This malignancy mainly afflicts younger women, who are black, or who have a BRCA1 mutation. Because of faster growing and spreading, TNBC differs from other invasive breast cancers having fewer treatment options and worse prognosis, where existing therapies are mostly ineffective, resulting in a large unmet biomedical need. In this context, we benefited from an experimental model of TNBC both in vitro and in vivo to explore the effects of a biocompatible cationic liposomal nanoformulation, named HoThyRu/DOTAP, able to effectively deliver the antiproliferative ruthenium(III) complex AziRu, thus resulting in a prospective candidate drug. As part of the multitargeting mechanisms featuring metal-based therapeutics other than platinum-containing agents, we herein validate the potential of HoThyRu/DOTAP liposomes to act as a multimodal anticancer agent through inhibition of TNBC cell growth and proliferation, as well as migration and invasion. The here-obtained preclinical findings suggest a potential targeting of the complex pathways network controlling invasive and migratory cancer phenotypes. Overall, in the field of alternative chemotherapy to platinum-based drugs, these outcomes suggest prospective brand-new settings for the nanostructured AziRu complex to get promising goals for the treatment of metastatic TNBC.

Keywords: DOTAP liposome; anticancer activity; cell migration and invasion; nucleolipid nanosystem; preclinical investigations; ruthenium(III) complex; triple-negative breast cancer (TNBC).


Conflict of interest statement

The authors declare no conflict of interest.

Figures

Figure 1
Figure 1
Biological effects of the HoThyRu/DOTAP nanosystem in TNBC cells and in healthy cultures. (a) Cell survival index, evaluated by the MTT assay and live/dead cell ratio analysis, for TNBC MDA-MB-231 cells and for healthy primary dermal fibroblasts (HDFa) and primary epidermal follicular keratinocytes (HHFKs) following 48 h of incubation with the indicated concentration (range 1→250 µM) of AziRu loaded in the HoThyRu/DOTAP nanosystem (nanostructured AziRu) and the naked AziRu. In the same experimental conditions, cisplatin (cDPP) is used as the reference drug. Data in line graphs are expressed as percentages of untreated control cells and are reported as mean of five independent experiments ± SEM (n = 30). * p ˂ 0.05 vs. control cells; ** p < 0.01 vs. control cells; *** p < 0.001 vs. control cells. (b) IC50 values (µM) of the HoThyRu/DOTAP liposomal formulation, the actual Ru(III) complex (AziRu) in the nanosystem, the naked AziRu complex, and cisplatin (cDDP) in the tested cell lines after 48 h of incubation in vitro. The AziRu IC50 value corresponds to the effective ruthenium complex concentration (30% mol/mol) carried by the HoThyRu/DOTAP nanoformulation. IC50 values are reported as mean ± SEM (n = 30).
Figure 2
Figure 2
Colony formation assay in the experimental model of TNBC. (a) Representative images of MDA-MB-231 cells stained with 0.5% crystal violet at the experiment endpoint. Cells were treated or not (Ctrl) with IC50 concentrations of HoThyRu/DOTAP and cisplatin (cDDP), as indicated in the experimental section. cDDP is used as a cytotoxic reference drug. (b) Quantification by bar graphs of the cell colonies formation after the indicated treatments. *** p < 0.001 vs. untreated cells (Ctrl).
Figure 3
Figure 3
Intracellular ruthenium(III) complex bioaccumulation after HoThyRu/DOTAP application to MDA-MB-231 cells. Inductively coupled plasma-mass spectrometry (ICP-MS) for the analysis of ruthenium distribution between MDA-MB-231 cells and culture media after incubation for 24 h with the IC50 concentration of HoThyRu/DOTAP, as well as intracellular ruthenium accumulation following cellular uptake and subcellular fractionation. In the reported fractions, ruthenium content is expressed as percentage of the total ruthenium administered during incubations in vitro. Results were derived from the average values of three independent experiments.
Figure 4
Figure 4
Apoptosis activation in MDA-MB-231 cells by confocal microscopy in response to HoThyRu/DOTAP treatment. (a) Apoptotic, necrotic, and healthy cells have been monitored by confocal microscopy after incubation for 48 h with IC50 concentrations of HoThyRu/DOTAP and cisplatin (cytotoxic positive control). Nuclei emit blue fluorescence (blue nuclear stain, DAPI filter, Ex/Em = 350/470 nm). Apoptotic cells have green fluorescence (FITC filter, Ex/Em = 490/525 nm) upon binding to membrane PS (phosphatidylserine). Necrotic cells are associated with nuclear red fluorescence (Cy5 filter, Ex/Em = 546/647 nm). In merged images (Merge), the fluorescent patterns from cell monolayers are overlapped. Fluorescent microphotographs (40× oil immersion objective lens) are representative of three independent experiments. (b) Percentage of Green Detection Reagent-positive MDA-MB-231 cells following the indicated treatments in vitro with respect to untreated control cells. *** p < 0.001 vs. control cells.
Figure 5
Figure 5
Autophagy fluorescent detection in MDA-MB-231 cells treated with HoThyRu/DOTAP. (a) Autophagy detection by confocal microscopy showing nuclei (blue nuclear stain, DAPI filter, Ex/Em = 350/470 nm) and autophagic vesicles (green fluorescence signal, FITC filter, Ex/Em = 490/525 nm) in control MDA-MB-231 cells (Ctrl), or in cells treated with 10 µM Rapamycin for 48 h, and with IC50 of HoThyRu/DOTAP for 48 h. In merged images (Merge), the fluorescent patterns from cell monolayers are overlapped. The shown microphotographs (40× oil immersion objective lens) are representative of three independent experiments. (b) Percentage of Green Detection Reagent-positive MDA-MB-231 cells following the indicated treatments in vitro with respect to untreated control cells. *** p < 0.001 vs. control cells.
Figure 6
Figure 6
Invasion and migration ability of MDA-MB-231 cells in response to HoThyRu/DOTAP treatment. MDA-MB-231 cells were starved and treated or not with a sub-IC50 concentration of HoThyRu/DOTAP (24 μM, i.e., 7.2 µM of AziRu) for the indicated times (24 and 48 h). The ability of cells to invade the matrix and then migrate through a semipermeable membrane in the Boyden chamber in response to HoThyRu/DOTAP application in vitro was analysed directly in fluorescence according to the manufacturer’s recommendations and reported in bar graphs. Data originate from the average ± SEM values of three independent experiments. * p ˂ 0.05 vs. control cells; ** p < 0.01 vs. control cells.
Figure 7
Figure 7
Wound healing assay showed inhibitory effects of HoThyRu/DOTAP on cell migration. (a) Representative images by light microscopy showing MDA-MB-231 cell migration for the indicated times (0, 24, 48, 72, and 96 h), previously treated or not for 48 h with HoThyRu/DOTAP at the sub-IC50 concentration of 24 µM. The scale bar represents 250 µM. (b) At the endpoints, migration was monitored under a phase contrast microscope (10× objective), and the percentage of wound closure depending on cell migration ability was determined by ImageJ FIJI software and reported in a line graph as the average ± SEM values of three independent experiments. ** p < 0.01 vs. control cells; *** p < 0.001 vs. control cells.
Figure 8
Figure 8
Expression analysis of a limited panel of EMT genes by RT-qPCR following HoThyRu/DOTAP application in vitro. RT-qPCR analysis of the EMT pathway genes E-cadherin, N-cadherin, vimentin, Slug, and Snail, performed on MDA-MB-231 cells treated or not with HoThyRu/DOTAP for 48 h. The mRNA expression levels of each gene were normalized using the GAPDH as a housekeeping gene and are indicated as the fold change with respect to untreated control cultures. Values represent the mean ± SEM of three independent experiments, each performed in duplicate. ** p < 0.01 vs. control cells; *** p < 0.001 vs. control cells; **** p < 0.0001 vs. control cells. The report of RT-qPCR analysis is shown in Figure S4.
Figure 9
Figure 9
Animal biological responses to HoThyRu/DOTAP administration in vivo. (a) Experimental protocol and therapeutic scheme based on intraperitoneal (i.p.) administrations of HoThyRu/DOTAP (15 mg/kg) once a week for 28 days. (b) Overall mice survival and (c) body weights at the end of the study (5 weeks from the start of treatments). Control group (untreated xenotransplanted, n = 5 animals); xenotransplanted treated group (HoThyRu/DOTAP, n = 5 animals). (d) Weight analysis of the explanted tumor masses at the end of the study and (e) tumour volumes evaluation over time throughout in vivo experiments. Control group (untreated xenotransplanted, n = 5 animals); xenotransplanted treated group (HoThyRu/DOTAP, n = 5 animals). (f) Explanted tumor masses at the end point of the study from untreated (Control) and treated (HoThyRu/DOTAP) xenotransplanted animal groups. (g) Representative animal photographs at the end of the preclinical study relating to untreated xenotransplanted mice (Control) and treated xenotransplanted mice (HoThyRu/DOTAP) showing tumour inhibition by HoThyRu/DOTAP administration. Statistical analysis was conducted by one-way ANOVA followed by Bonferroni’s for multiple comparisons. *** p ˂ 0.001 vs. control animal group.
Figure 10
Figure 10
Ruthenium bioaccumulation in mice after HoThyRu/DOTAP regimen in vivo. Percentage of ruthenium amounts revealed by ICP-MS analyses and plotted in bar graph for the indicated body districts (heart, lung, spleen, kidney, and liver), including tumour lesions, at the endpoint (4 weeks) of the preclinical study. After weekly administrations of HoThyRu/DOTAP (15 mg/kg, i.p., once a week for 4 weeks), the mice were sacrificed, and organs and tissues were appropriately collected to analyze the ruthenium content (n = 5 animals).

Similar articles

Cited by

References

    1. Lu Y., Zhu D., Le Q., Wang Y., Wang W. Ruthenium-based antitumor drugs and delivery systems from monotherapy to combination therapy. Nanoscale. 2022;14:16339–16375. doi: 10.1039/D2NR02994D. - DOI - PubMed
    1. Ferraro M.G., Piccolo M., Misso G., Santamaria R., Irace C. Bioactivity and development of small non-platinum metal-based chemotherapeutics. Pharmaceutics. 2022;14:954. doi: 10.3390/pharmaceutics14050954. - DOI - PMC - PubMed
    1. Lee S.Y., Kim C.Y., Nam T.G. Ruthenium complexes as anticancer agents: A brief history and perspectives. Drug Des. Dev. Ther. 2020;14:5375–5392. doi: 10.2147/DDDT.S275007. - DOI - PMC - PubMed
    1. Liu J., Lai H., Xiong Z., Chen B., Chen T. Functionalization and cancer-targeting design of ruthenium complexes for precise cancer therapy. Chem. Commun. 2019;55:9904–9914. doi: 10.1039/C9CC04098F. - DOI - PubMed
    1. Pal M., Nandi U., Mukherjee D. Detailed account on activation mechanisms of ruthenium coordination complexes and their role as antineoplastic agents. Eur. J. Med. Chem. 2018;150:419–445. doi: 10.1016/j.ejmech.2018.03.015. - DOI - PubMed

MeSH terms