. 2023 Mar 30;24(7):6475.
doi: 10.3390/ijms24076475.

Molecular and Functional Characteristics of Airway Epithelium under Chronic Hypoxia

Affiliations

Molecular and Functional Characteristics of Airway Epithelium under Chronic Hypoxia

Sharon L Wong et al. Int J Mol Sci. .

Abstract

Localized and chronic hypoxia of airway mucosa is a common feature of progressive respiratory diseases, including cystic fibrosis (CF). However, the impact of prolonged hypoxia on airway stem cell function and differentiated epithelium is not well elucidated. Acute hypoxia alters the transcription and translation of many genes, including the CF transmembrane conductance regulator (CFTR). CFTR-targeted therapies (modulators) have not been investigated in vitro under chronic hypoxic conditions found in CF airways in vivo. Nasal epithelial cells (hNECs) derived from eight CF and three non-CF participants were expanded and differentiated at the air-liquid interface (26-30 days) at ambient and 2% oxygen tension (hypoxia). Morphology, global proteomics (LC-MS/MS) and function (barrier integrity, cilia motility and ion transport) of basal stem cells and differentiated cultures were assessed. hNECs expanded at chronic hypoxia, demonstrating epithelial cobblestone morphology and a similar proliferation rate to hNECs expanded at normoxia. Hypoxia-inducible proteins and pathways in stem cells and differentiated cultures were identified. Despite the stem cells' plasticity and adaptation to chronic hypoxia, the differentiated epithelium was significantly thinner with reduced barrier integrity. Stem cell lineage commitment shifted to a more secretory epithelial phenotype. Motile cilia abundance, length, beat frequency and coordination were significantly negatively modulated. Chronic hypoxia reduces the activity of epithelial sodium and CFTR ion channels. CFTR modulator drug response was diminished. Our findings shed light on the molecular pathophysiology of hypoxia and its implications in CF. Targeting hypoxia can be a strategy to augment mucosal function and may provide a means to enhance the efficacy of CFTR modulators.

Keywords: CFTR; airway stem cell; cystic fibrosis; hypoxia.


Conflict of interest statement

SAW is the recipient of a Vertex Innovation Grant (2018) and a TSANZ/Vertex Research Award (2020). Both are unrelated and outside of the submitted manuscript. AJ has received consulting fees from Vertex on projects unrelated to this study. All other authors declare no conflict of interest.

Figures
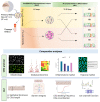
Figure 1
Figure 1
Schematic of study design. Passage 1 primary human nasal epithelial cells (hNECs) from 3 non-CF and 8 CF participants were expanded under normoxic (21% O2) and chronic hypoxic (2% O2) conditions (5–7 days). The normoxic and hypoxic derived basal stem hNECs were crossover and differentiated at air–liquid interface (ALI) at normoxia and chronic hypoxia to mature airway epithelium (21–25 days). Morphology, global proteomics, and function (inflammatory marker, barrier integrity, cilia motility and coordination, and ion transport) were compared.
Figure 2
Figure 2
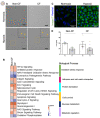
Effect of chronic hypoxia on the expansion of primary human nasal epithelial cells (hNECs). (A) Representative brightfield images of hNECs cultured at normoxia and hypoxia for 5–7 days. Magnified inset with yellow arrows shows granulation. Scale bars = 50 μm. (B) Heatmap of enriched canonical pathways of differentially expressed proteins determined by IPA. Color indicates the z-score for each pathway, with red (positive) indicating predicted activation, blue (negative) indicating predicted inhibition, and grey indicating no enrichment. Data were derived from 3 non–CF and 8 CF participants. (C) Representative intracellular hypoxia imaging using Image–iT green hypoxia reagent, 63×/1.4 oil immersion objective. Scale bars = 50 μm. (D) IL–8 ELISA measurement in culture supernatants of confluent normoxic and hypoxic hNECs. Each colored circle represents cultures of an individual participant. Data are presented as bar plots with mean ± standard error of the mean (SEM). One-way ANOVA was used to determine statistical significance.
Figure 3
Figure 3
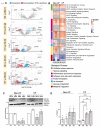
Effect of chronic hypoxia on the global proteome of differentiated human nasal epithelial cells (hNECs). (A) Volcano plots of differentially expressed proteins in each oxygen condition in differentiated ALI cultures from eight CF participants. Dotted lines indicate significance cut-off (p–value ≤ 0.05, |fold change| ≥ 1.2). The count of significantly upregulated proteins, significantly downregulated proteins and total proteins are shown in top right, top left, and bottom right, respectively. The top 5 to 10 upregulated and downregulated proteins (determined based on logFC) are labelled. Comparisons are in pairs, [1] HN compared to NN; [2] HH compared to NH; [3] HH compared to HN; [4] NH compared to NN, and [5] HH compared to NN. (B) Heatmap of enriched canonical pathways of differentially expressed proteins determined by IPA. Color indicates the z-score for each pathway, with red (positive) indicating predicted activation, blue (negative) indicating predicted inhibition, and grey indicating no enrichment. The columns indicate comparison 3–5 as shown in (A). Comparisons 1 and 2 did not result in significantly enriched pathways. Data in (A) and (B) were derived from 3 non–CF and 8 CF participants. (C) Western blot of hypoxia–inducible factor 2 alpha (HIF–2α) from 2 non–CF and 2 CF participants. (D) IL–8 ELISA of the culture supernatants of ALI cultures at days 21–25. Each colored circle represents cultures of an individual participant. Data are presented as bar plots with mean ± standard error of the mean (SEM). One-way ANOVA was used to determine statistical significance. * p < 0.05, ** p < 0.01, *** p < 0.001.
Figure 4
Figure 4
Effect of chronic hypoxia on the structure and barrier integrity of differentiated human nasal epithelial cells (hNECs). (A) Representative H&E stain of primary hNECS differentiated at ALI in normoxia (NN and HN) and chronic hypoxia (NH and HH) for 21–25 days. Refer to Figure S3 for complete set. Red rectangle shows squamous cells or cells transitioning towards squamous morphology. 40×/0.8 objective. Scale bars = 100 μm. (B) ALI culture thickness measured from five sections per membrane (>20 random fields of view) per condition. Each colored circle represents an individual participant. (C) Transepithelial electrical resistance (TEER) of ALI cultures. Each individual participant’s data is presented with a different color. Three independent transwells were analyzed per participant. Data are presented as bar plots with mean ± standard error of the mean (SEM). One-way ANOVA was used to determine statistical significance. * p < 0.05, ** p < 0.01, *** p < 0.001, and **** p < 0.0001.
Figure 5
Figure 5
Effect of chronic hypoxia on the epithelial phenotype and cilia function in differentiated human nasal epithelial cells (hNECs). (A) Representative immunofluorescence staining of acetylated tubulin (green), MUC5AC (magenta) and E-cadherin (red). 63×/1.4 oil immersion objective. Scale bars = 50 μm. (B) Boxplots depicting the variation of log LFQ intensity in proteins found in different cell types compared across the different oxygen levels. Boxplots extend from first quartile to the third quartile, with middle line indicating the median. Upper and lower whiskers extend to the largest and smallest values within 1.5 times the interquartile range. Statistical significance of the difference in median log LFQ intensity across oxygen levels is performed using Wilcoxon Rank Sum test with Benjamini–Hochberg correction for p-value. * adjusted p-value < 0.05, ** adjusted p-value < 0.01, *** adjusted p-value < 0.001, **** adjusted p-value < 0.0001. Data were derived from 3 non-CF and 8 CF participants. (C) Western blotting of cilia marker acetylated tubulin from 2 non-CF and 2 CF participants. (D) Cilia length (left), cilia beating frequency (middle) and coordination (right) of mature ALI cultures differentiated at normoxia and hypoxia for 21–25 days. For cilia length, each colored circle represents an individual participant. For cilia beating frequency and coordination, each individual participant’s data is presented with a different color. Three independent transwells were analyzed per participant. Data are presented as bar plots with mean ± standard error of the mean (SEM). One-way ANOVA was used to determine statistical significance. * p < 0.05, ** p < 0.01, *** p < 0.001, and **** p < 0.0001.
Figure 6
Figure 6
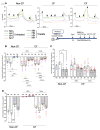
Effect of chronic hypoxia on ion transport function in differentiated human nasal epithelial cells (hNECs). (A) Representative Ussing chamber recordings of short circuit current (Isc) in hNECs from a non-CF and a CF participant. The protocol used to measure functional CFTR expression in hNECs in 0.01% DMSO vehicle (untreated) or pretreated with correctors (3 μM VX–445 and 18 μM VX–661 for 48 h) followed by sequential addition of 100 μM apical amiloride (1. Amil), apical addition of either vehicle control 0.01% DMSO or 10 μM VX–770 (2. DMSO or VX–770), 10 μM basal forskolin (3. Fsk), 30 μM apical CFTR inhibitor (4. CFTRinh–172), and 100 μM apical ATP (5. ATP). A basolateral-to-apical chloride gradient was used. Black line denotes NN, green line denotes HN, orange line denotes NH, and purple line denotes HH. Box plots of (B) amiloride-inhibited epithelial sodium channel (ENaC) currents, (C) ATP–activated calcium-activated chloride channel (CaCC) currents, (D) Inh172–inhibited CFTR current (bottom) in hNECs untreated or pretreated with VX–445 and VX–661. Each individual participant’s data is presented with a different color. Three independent transwells were analyzed per participant. Data are presented as bar plots with mean ± standard error of the mean (SEM). One-way ANOVA was used to determine statistical significance. * p < 0.05, ** p < 0.01, *** p < 0.001, and **** p < 0.0001.

Similar articles

Cited by

References

    1. Awatade N.T., Wong S.L., Hewson C.K., Fawcett L.K., Kicic A., Jaffe A., Waters S.A. Human Primary Epithelial Cell Models: Promising Tools in the Era of Cystic Fibrosis Personalized Medicine. Front. Pharm. 2018;9:1429. doi: 10.3389/fphar.2018.01429. - DOI - PMC - PubMed
    1. Ast T., Mootha V.K. Oxygen and mammalian cell culture: Are we repeating the experiment of Dr. Ox? Nat. Metab. 2019;1:858–860. doi: 10.1038/s42255-019-0105-0. - DOI - PubMed
    1. Montgomery S.T., Mall M.A., Kicic A., Stick S.M. Hypoxia and sterile inflammation in cystic fibrosis airways: Mechanisms and potential therapies. Eur. Respir. J. 2017;49:1600903. doi: 10.1183/13993003.00903-2016. - DOI - PubMed
    1. Enocson A., Jordan R., Adab P., Dickens A., Fitzmaurice D. Prevalence and characteristics of low oxygen saturation (SpO2) in a primary care COPD cohort. Eur. Respir. J. 2016;48:PA3937. doi: 10.1183/13993003.congress-2016.PA3937. - DOI
    1. Carruthers D.M., Harrison B.D. Arterial blood gas analysis or oxygen saturation in the assessment of acute asthma? Thorax. 1995;50:186–188. doi: 10.1136/thx.50.2.186. - DOI - PMC - PubMed

MeSH terms

Substances