. 2023 Mar 31;24(7):6577.
doi: 10.3390/ijms24076577.

Signatures of Co-Deregulated Genes and Their Transcriptional Regulators in Kidney Cancers

Affiliations

Signatures of Co-Deregulated Genes and Their Transcriptional Regulators in Kidney Cancers

Ioanna Ioannou et al. Int J Mol Sci. .

Abstract

There are several studies on the deregulated gene expression profiles in kidney cancer, with varying results depending on the tumor histology and other parameters. None of these, however, have identified the networks that the co-deregulated genes (co-DEGs), across different studies, create. Here, we reanalyzed 10 Gene Expression Omnibus (GEO) studies to detect and annotate co-deregulated signatures across different subtypes of kidney cancer or in single-gene perturbation experiments in kidney cancer cells and/or tissue. Using a systems biology approach, we aimed to decipher the networks they form along with their upstream regulators. Differential expression and upstream regulators, including transcription factors [MYC proto-oncogene (MYC), CCAAT enhancer binding protein delta (CEBPD), RELA proto-oncogene, NF-kB subunit (RELA), zinc finger MIZ-type containing 1 (ZMIZ1), negative elongation factor complex member E (NELFE) and Kruppel-like factor 4 (KLF4)] and protein kinases [Casein kinase 2 alpha 1 (CSNK2A1), mitogen-activated protein kinases 1 (MAPK1) and 14 (MAPK14), Sirtuin 1 (SIRT1), Cyclin dependent kinases 1 (CDK1) and 4 (CDK4), Homeodomain interacting protein kinase 2 (HIPK2) and Extracellular signal-regulated kinases 1 and 2 (ERK1/2)], were computed using the Characteristic Direction, as well as GEO2Enrichr and X2K, respectively, and further subjected to GO and KEGG pathways enrichment analyses. Furthermore, using CMap, DrugMatrix and the LINCS L1000 chemical perturbation databases, we highlight putative repurposing drugs, including Etoposide, Haloperidol, BW-B70C, Triamterene, Chlorphenesin, BRD-K79459005 and β-Estradiol 3-benzoate, among others, that may reverse the expression of the identified co-DEGs in kidney cancers. Of these, the cytotoxic effects of Etoposide, Catecholamine, Cyclosporin A, BW-B70C and Lasalocid sodium were validated in vitro. Overall, we identified critical co-DEGs across different subtypes in kidney cancer, and our results provide an innovative framework for their potential use in the future.

Keywords: Characteristic Direction; GEO2Enrichr; KICH; KIRC; KIRP; X2K; co-deregulated genes; drug repurposing; kidney cancer; single-drug perturbation; single-gene perturbation; tumor heterogeneity.


Conflict of interest statement

The authors declare no conflict of interest.

Figures
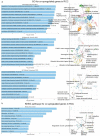
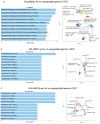
Figure 1
Figure 1
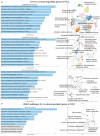
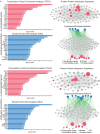
The bar charts (left) depict the top 10 enriched Gene Ontology (GO) terms (a) and KEGG pathways (b) in which the top 250 co-upregulated genes in RCC participate, along with their corresponding p-values. Asterisks (*) indicate the terms with significant adjusted p-values (<0.05). The scatterplots (right) were created using UMAP and depict clusters of similar gene sets. The significantly enriched terms of the associated gene sets are denoted.
Figure 2
Figure 2
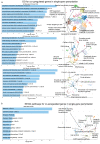
The bar charts (left) depict the top 10 enriched Gene Ontology (GO) terms (a) and KEGG pathways (b) in which the top 250 co-downregulated genes in RCC participate, along with their corresponding p-values. Asterisks (*) indicate the terms with significant adjusted p-values (<0.05). The scatterplots (right) were created using UMAP and depict clusters of similar gene sets. The significantly enriched terms of the associated gene sets (also highlighted in blue color in the bar charts) are denoted. The GO and KEGG terms appearing in grey color in the bar charts, are non-significant.
Figure 3
Figure 3
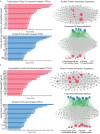
Upstream regulatory networks for co-upregulated (a) and co-downregulated (b) gene signatures in kidney cancers vs. the normal tissue. The networks depict transcription factors (TFs, red nodes), intermediate proteins (grey nodes) and kinases (blue nodes). Grey edges indicate PPI interactions and green edges depict kinase-driven phosphorylation events. Node size is relative to the levels of expression degree. Upstream regulatory networks were constructed using the eXpression2Kinases (X2K) algorithm.
Figure 4
Figure 4
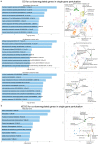
The bar charts (left) depict the top 10 enriched Gene Ontology (GO) terms (a) and the KEGG pathways (b) for the top 250 co-upregulated genes in kidney cancer cells with a single-gene perturbation, along with their corresponding p-values. Asterisks (*) indicate the terms with significant adjusted p-values (<0.05). The scatterplots (right) were created using UMAP and depict clusters of similar gene sets. The significantly enriched terms of the associated gene sets are denoted.
Figure 5
Figure 5
The bar charts (left) depict the top 10 enriched Gene Ontology (GO) terms (a) and the KEGG pathways (b) for the top 250 co-downregulated genes in RCC with a single-gene perturbation, along with their corresponding p-values. Asterisks (*) indicate the terms with significant adjusted p-values (<0.05). The scatterplots (right) were created using UMAP and depict clusters of similar gene sets. The significantly enriched terms of the associated gene sets are denoted.
Figure 6
Figure 6
Upstream regulatory networks for co-upregulated (a) and co-downregulated (b) gene signatures in single-gene perturbation experiments in kidney cancers vs. the normal tissue. The networks depict transcription factors (TFs, red nodes), intermediate proteins (grey nodes) and kinases (blue nodes). Grey edges indicate PPI interactions and green edges depict kinase-driven phosphorylation events. Node size is relative to expression. Upstream regulatory networks were constructed using the eXpression2Kinases (X2K) algorithm.
Figure 7
Figure 7
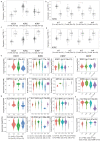
Validation of the co-UP (a) and co-DOWN (c) gene signatures in the TCGA-KICH, TCGA-KIRC and TCGA-KIRP datasets, as well as in four mRNA clusters in KIRC (b,d). Results with a |log2FC ≥ 1| and p-value < 0.01 were considered statistically significant (*). The expression of KSR1 and MPEG1, two genes within the co-UP signature, were validated across different immune (e) and molecular (f) subtypes in kidney cancer. The expression of SLC16A9 and CLDN2, two genes within the co-DOWN signature, were also validated across different immune (g) and molecular (h) subtypes in kidney cancer.
Figure 8
Figure 8
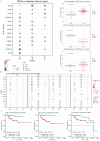
(a) Analysis of the differential expression between different kidney tumors in the TCGA dataset (KIRP, KIRC and KICH) and their adjacent normal samples. The bubble colors from purple to red represent the fold change between kidney tumor and normal samples. The size of each dot correlates the significance of FDR. The dots were filtered by the fold change (FC > 2) and statistical significance (FDR ≤ 0.05). Detailed expression of MYC, MAPK14 and CDK4 in KIRC, KICH and KIRP, respectively, are shown to the right. (b) Estimation of patient survival differences (OS, PFS, DSS and DFI) between high and low gene expression groups. The colors from blue to red represent the hazard ratio (HR) and size represents statistical significance in the bubble plot. The black outline border indicates Cox p ≤ 0.05. (c) Exemplary associations of high CDK4 and CDK1 with worse prognosis in KIRP are depicted in the Kaplan–Meier curves.
Figure 9
Figure 9
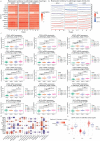
The heatmap (a) and trend plot (b) present the gene mRNA expression profile from stage I to stage IV of kidney cancers (KICH, KIRC and KIRP) in the TCGA database. The trend line colors from blue to red represents the tendency from fall to rise. The p-values were calculated using the Mann–Kendall test for trend analysis. p-values < 0.05 (*), <0.01 (**), <0.001 (***) or <0.0001 (****) were considered statistically significant, else if p-values were >0.05, were considered non-significant (NS). (c) Examples of the increased or decreased mRNA expression of various genes in pathologic and clinical stages of KICH, KIRC and KIRP. The Wilcoxon or ANOVA tests were used to assess statistical significance between 2 or >2 stage groups, respectively. p-values < 0.05 were considered statistically significant. NS, non-significant. (d) The percentage of cancers in which the mRNA expression of the genes of interest has a potential effect on pathway activity. Red color, activatory (A) effect; blue color, inhibitory (I) effect. The number in each cell indicates the percentage of cancer types in which each gene shows significant association with a specific pathway, among the three kidney tumor subtypes. (e) The box plots compare the GSVA scores between kidney cancer (KIRCH, KIRC and KIRP) and normal samples. GSVA scores represent the variation of gene set activity over a specific cancer sample population in an unsupervised manner, which was calculated through the GSVA R package. Briefly, the GSVA score represents the integrated level of the expression of the gene set, which is positively correlated with gene expression.
Figure 10
Figure 10
Top 10 enriched compounds that can be used as repurposing drugs against the top 250 co-upregulated genes in RCC according to DrugMatrix (a) and cMap (b,c) databases. The repurposed drugs upregulating or downregulating the co-upregulated genes in RCC, according to Old cMAP analysis are depicted in (b,c), respectively. Asterisks (*) indicate the terms with significant adjusted p-values (<0.05). The scatterplots (right) were created using UMAP and depict clusters of similar compounds. The significantly enriched terms of the associated gene sets are denoted.
Figure 11
Figure 11
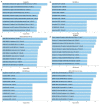
Top 10 enriched compounds that can be used as repurposing drugs against the top 250 co-upregulated (ac) or down-regulated (df) genes in RCC according to DrugMatrix (a,d), cMap (b,e) and LINCS L1000 (c,f) databases. The significantly enriched terms of the associated compounds (p < 0.001) are denoted with an asterisk (*).
Figure 12
Figure 12
Curve fitting analysis to determine the effective inhibitory concentrations of BW-B70C, Lasalocid sodium, Ifosfamide, Catecholamine, Cyclosporin A and Etoposide on HEK-293 cells. The cytotoxicity effects of the drugs were measured using MTT assays (n = 3). To obtain IC50s of the drugs, an exponential two-phase decay model (marked as red line) was fitted to the dose-response curves (solid black lines) of single treatment of each drug on HEK-293 cells.

Similar articles

Cited by

References

    1. Safiri S., Kolahi A.-A., Mansournia M.A., Almasi-Hashiani A., Ashrafi-Asgarabad A., Sullman M.J.M., Bettampadi D., Qorbani M., Moradi-Lakeh M., Ardalan M., et al. The Burden of Kidney Cancer and Its Attributable Risk Factors in 195 Countries and Territories, 1990–2017. Sci. Rep. 2020;10:13862. doi: 10.1038/s41598-020-70840-2. - DOI - PMC - PubMed
    1. Moch H. An Overview of Renal Cell Cancer: Pathology and Genetics. Semin. Cancer Biol. 2013;23:3–9. doi: 10.1016/j.semcancer.2012.06.006. - DOI - PubMed
    1. Luu V.-D., Boysen G., Struckmann K., Casagrande S., von Teichman A., Wild P.J., Sulser T., Schraml P., Moch H. Loss of VHL and Hypoxia Provokes PAX2 Up-Regulation in Clear Cell Renal Cell Carcinoma. Clin. Cancer Res. 2009;15:3297–3304. doi: 10.1158/1078-0432.CCR-08-2779. - DOI - PubMed
    1. Gatto F., Nookaew I., Nielsen J. Chromosome 3p Loss of Heterozygosity Is Associated with a Unique Metabolic Network in Clear Cell Renal Carcinoma. Proc. Natl. Acad. Sci. USA. 2014;111:E866–E875. doi: 10.1073/pnas.1319196111. - DOI - PMC - PubMed
    1. Scelo G., Hofmann J.N., Banks R.E., Bigot P., Bhatt R.S., Cancel-Tassin G., Chew S.K., Creighton C.J., Cussenot O., Davis I.J., et al. International Cancer Seminars: A Focus on Kidney Cancer. Ann. Oncol. 2016;27:1382–1385. doi: 10.1093/annonc/mdw186. - DOI - PMC - PubMed