. 2023 Apr 1;24(7):6599.
doi: 10.3390/ijms24076599.

Delineation of G Protein-Coupled Receptor Kinase Phosphorylation Sites within the D1 Dopamine Receptor and Their Roles in Modulating β-Arrestin Binding and Activation

Affiliations

Delineation of G Protein-Coupled Receptor Kinase Phosphorylation Sites within the D1 Dopamine Receptor and Their Roles in Modulating β-Arrestin Binding and Activation

Amy E Moritz et al. Int J Mol Sci. .

Abstract

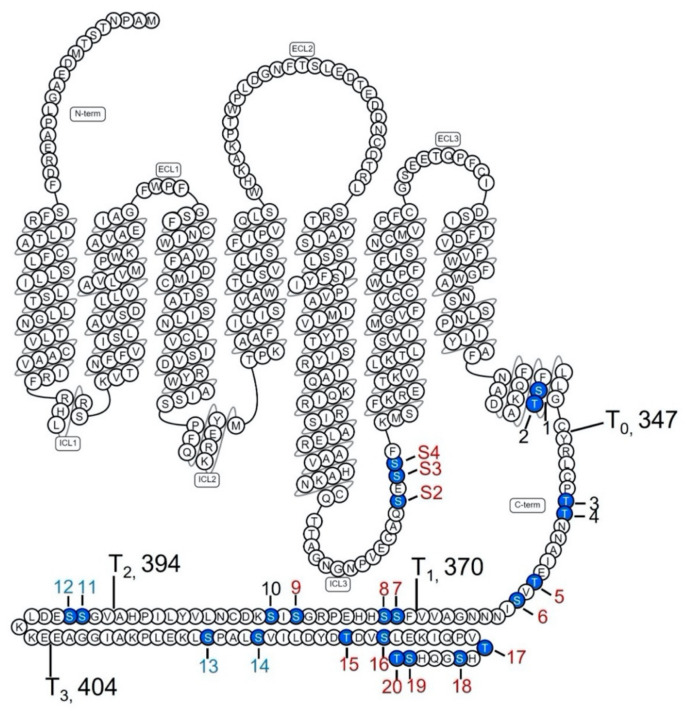
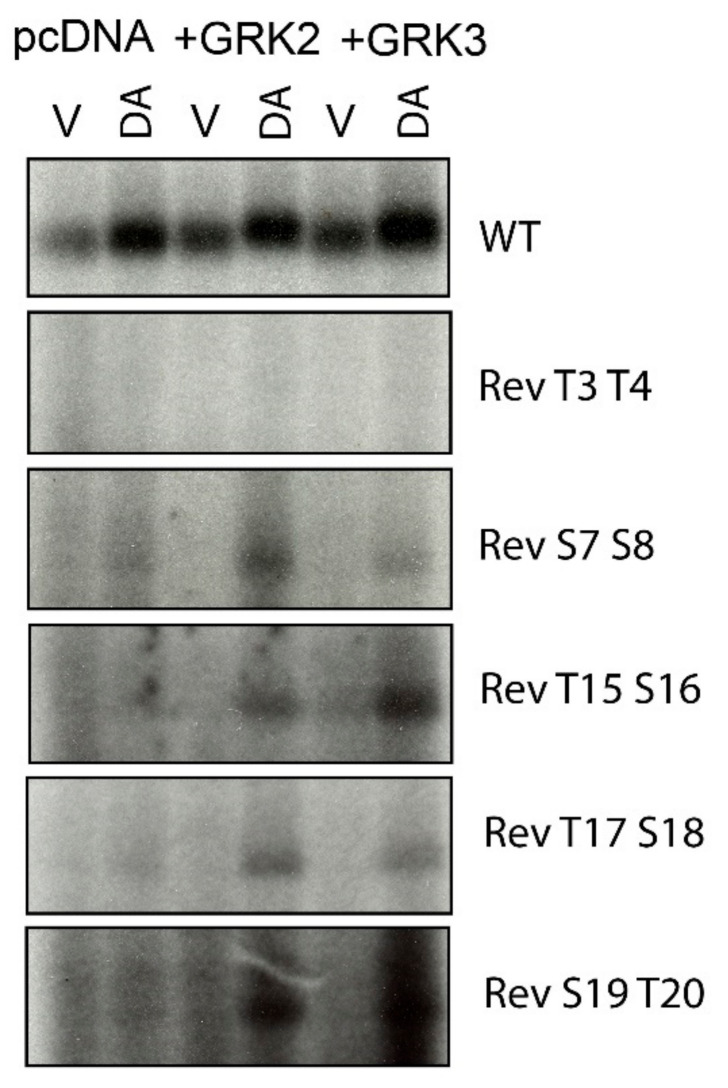
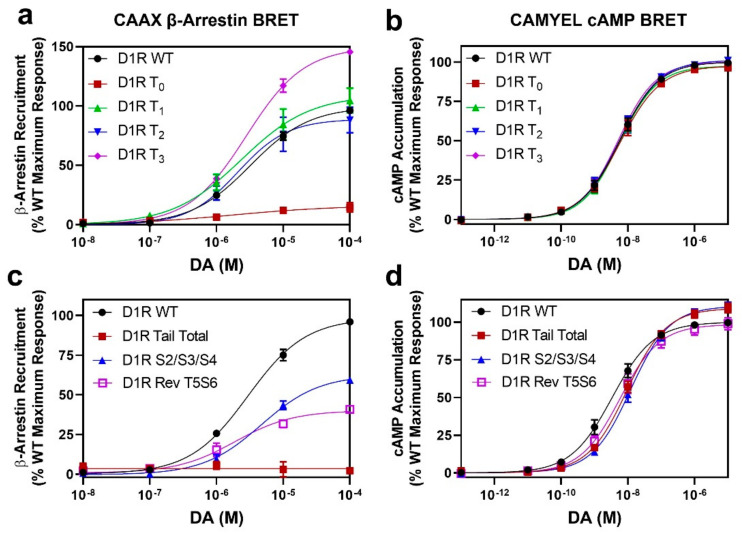
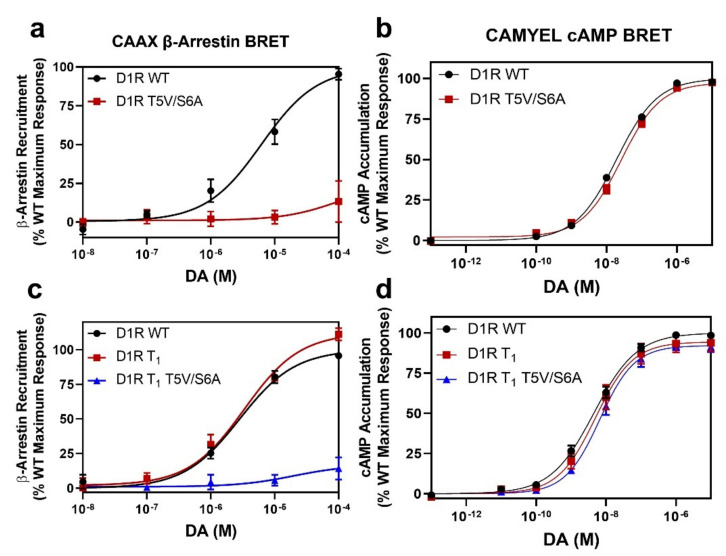
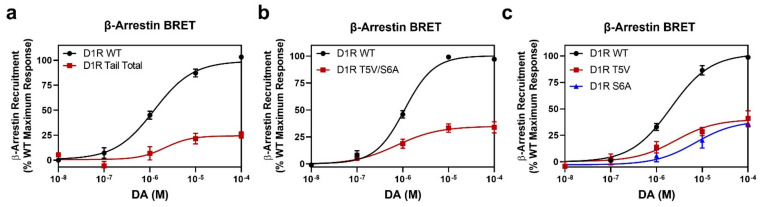
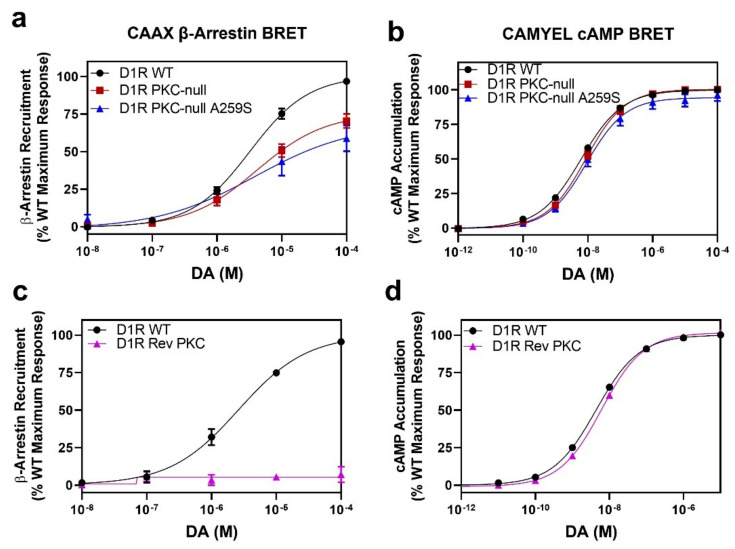
The D1 dopamine receptor (D1R) is a G protein-coupled receptor that signals through activating adenylyl cyclase and raising intracellular cAMP levels. When activated, the D1R also recruits the scaffolding protein β-arrestin, which promotes receptor desensitization and internalization, as well as additional downstream signaling pathways. These processes are triggered through receptor phosphorylation by G protein-coupled receptor kinases (GRKs), although the precise phosphorylation sites and their role in recruiting β-arrestin to the D1R remains incompletely described. In this study, we have used detailed mutational and in situ phosphorylation analyses to completely identify the GRK-mediated phosphorylation sites on the D1R. Our results indicate that GRKs can phosphorylate 14 serine and threonine residues within the C-terminus and the third intracellular loop (ICL3) of the receptor, and that this occurs in a hierarchical fashion, where phosphorylation of the C-terminus precedes that of the ICL3. Using β-arrestin recruitment assays, we identified a cluster of phosphorylation sites in the proximal region of the C-terminus that drive β-arrestin binding to the D1R. We further provide evidence that phosphorylation sites in the ICL3 are responsible for β-arrestin activation, leading to receptor internalization. Our results suggest that distinct D1R GRK phosphorylation sites are involved in β-arrestin binding and activation.

Keywords: D1 receptor; dopamine; phosphorylation; β-arrestin.


Conflict of interest statement

The authors declare no conflict of interest.

Figures

Figure 1
Figure 1
Diagram of the rat D1R illustrating the receptor mutants used in this study. Blue filled circles indicate serine and threonine residues that were mutated in the ICL3 and C-terminal tail. Four carboxyl terminal truncation mutants were also generated by inserting stop codons after amino acids 347 (T0), 370 (T1), 394 (T2), or 404 (T3). The T0 truncation site was based on the observation that Cys-347 in the rat D1R is palmitoylated. The twenty serine and threonine residues in the C-terminus are numbered 1–20. Simultaneous mutation of these 20 residues refers to the “Tail Total” mutant. Simultaneous mutation of the eight serine and threonine residues in the distal C-terminus refers to the “S13–20” mutant. Simultaneous mutation of just the three Ser residues (S256, S258, and S259) in the ICL3 refers to the “S2/S3/S4” mutant. The GRK-mediated D1R phosphorylation sites determined in this study, as well as in Rankin et al. (2006) [28] are delineated using red numbering and lettering on the receptor diagram. Simultaneous mutation of these residues refers to the “GRK-null” mutant. The sites that are constitutively phosphorylated by GRK4α are: T15, S16, S18, S19 and T20 [28]. PKC-mediated phosphorylation sites that were determined in Rankin and Sibley, 2010 are shown in blue numbering (11–14) on the receptor diagram. Note that residue S4 (S259) in the ICL3 has been identified as being phosphorylated by both GRKs and PKCs [14,27]. The D1R snake diagram was modified from GPCRdb.org [33].
Figure 2
Figure 2
Mutational analyses reveal dopamine-stimulated (GRK-mediated) D1R phosphorylation sites. In situ phosphorylation assays were performed as described in Section 4. Briefly, wild-type (WT), site-specific, reverse (Rev), or C-terminal truncation mutants of the D1R were treated with either vehicle (labeled “V”) or 10 µM dopamine (labeled “DA”) for 15 min prior to cell lysis, immunoprecipitation, resolution by SDS-PAGE, and autoradiography. Within each panel, equal amounts of D1R protein, as quantified by radioligand binding, were loaded into each lane of the gels. Representative experiments are shown, which were performed at least twice with similar results. Numbering scheme for the site-specific, reverse (Rev), and truncation mutants are shown in the receptor diagram in Figure 1. (a) The D1R WT and C-terminal truncation mutants T0, T1, T2 and T3 are shown. (b) The D1R WT, triple ICL3 mutant S2/S3/S4, and mutant Tail Total (in which all 20 C-terminal serines and threonines are mutated) are shown. (c) The D1R WT and reverse mutants Rev S1T2, Rev T3T4, and Rev T5T6 are shown. (d) The D1R WT and reverse mutant Rev S7S8 are shown. (e) The D1R WT and reverse mutants Rev S9S10, Rev 10, and Rev S7–S10 are shown.
Figure 3
Figure 3
Overexpression of GRK2 or GRK3 can enhance dopamine-induced phosphorylation of specific D1R residues. In situ phosphorylation assays were performed as described in Section 4. Cells were transfected with either empty vector, GRK2, or GRK3 along with the D1R WT and site-specific reverse mutants of the C-terminus. Cells were treated with either vehicle (labeled “V”) or 10 µM dopamine (labeled “DA”) for 15 min prior to lysis, immunoprecipitation, resolution by SDS-PAGE, and autoradiography. Equal amounts of D1R protein, as quantified by radioligand binding, were loaded into each lane of the gel. Representative experiments are shown, which were performed at least twice with similar results. Numbering scheme for the site-specific reverse (Rev) mutants are shown in Figure 1.
Figure 4
Figure 4
β-arrestin recruitment is impaired by specific D1R mutations while G protein signaling is unaffected. CAAX β-arrestin recruitment and CAMYEL cAMP accumulation assays were performed as described in Section 4. Data are expressed as a percentage of the maximum D1R WT DA response in each experiment and are displayed as the mean ± SEM of at least three experiments, performed in triplicate. Statistical comparisons between the following D1R WT and mutant curve parameters were made using a one-way ANOVA with Dunnett’s post hoc comparison: * p < 0.05, ** p < 0.01, *** p < 0.001, and **** p < 0.0001. (a) The four D1R truncation mutants are compared to the WT receptor for DA-induced β-arrestin recruitment yielding the following curve parameters: D1R WT EC50 = 3.3 ± 0.3 µM, Emax = 100%; D1R T0 EC50 = 2.8 ± 2.6 µM, Emax = 16 ± 4.4% ****; D1R T1 EC50 = 2.8 ± 0.7 µM, Emax = 110 ± 9.3%; D1R T2 EC50 = 2.4 ± 0.5 µM, Emax = 90 ± 10%; D1R T3 EC50 = 2.9 ± 0.4 µM, Emax = 150 ± 0.6% ***. (b) None of the C-terminal truncation mutants affect the ability of the receptor to signal via G proteins (cAMP accumulation): D1R WT EC50 = 6.1 ± 1.5 nM, Emax = 100%; D1R T0 EC50 = 6.5 ± 2.4 nM, Emax = 97 ± 2.3%; D1R T1 EC50 = 6.0 ± 1.6 nM, Emax = 97 ± 1.4%; D1R T2 EC50 = 6.2 ± 2.0 nM, Emax = 101 ± 1.8%; D1R T3 EC50 = 5.3 ± 1.3 nM, Emax = 100 ± 1.9%. (c) Mutating specific serine and/or threonine residues in the ICL3 (D1R S2/S3/S4) or C-terminus (D1R Tail Total or Rev T5S6) variably affects β-arrestin recruitment: D1R WT EC50 = 3.3 ± 0.5 µM, Emax = 100%; D1R Tail Total EC50 = undefined, Emax = no response ****; D1R S2/S3/S4 EC50 = 4.7 ± 0.9 µM, Emax = 61 ± 0.8% ****; D1R Rev T5S6 EC50 = 3.0 ± 0.2 µM, Emax = 46 ± 4.4% ****. (d) The D1R Tail Total, S2/S3/S4, and Rev T5S6 mutations have minimal effects on the G protein interactions: D1R WT EC50 = 4.3 ± 1.1 nM, Emax = 100 ± 0.1%; D1R Tail Total EC50 = 9.8 ± 1.7 nM, Emax = 109 ± 3.1% *; D1R S2/S3/S4 EC50 = 13 ± 2.8 nM **, Emax = 110 ± 2.5% **; D1R Rev T5S6 EC50 = 6.5 ± 2.1 nM, Emax = 98 ± 3.9%.
Figure 5
Figure 5
The T5S6 C-terminal phosphorylation sites are major drivers of β-arrestin recruitment to the D1R. CAAX β-arrestin recruitment and CAMYEL cAMP accumulation assays were performed as described in Section 4. Data are expressed as a percentage of the maximum D1R WT DA response in each experiment and are displayed as the mean ± SEM of at least three experiments, performed in triplicate. Statistical comparisons between the following D1R WT and mutant curve parameters were made using a one-way ANOVA with Dunnett’s post hoc comparison: * p < 0.05, *** p < 0.001, and **** p < 0.0001. (a) The T5V/S6A mutation of the full-length D1R also severely diminishes β-arrestin recruitment: D1R WT EC50 = 7.0 ± 2.5 µM, Emax = 100%; D1R T5V/S6A EC50 > 100 µM ****, Emax = 18 ± 8.8% ***. (b) The T5V/S6A mutation has no effect on the ability of the receptor to signal via G proteins: D1R WT EC50 = 20 ± 1.7 nM, Emax = 100%; D1R T5V/S6A EC50 = 27 ± 3.1 nM, Emax 98 ± 2.3%. (c) Mutation of both the T5 and S6 residues to valine or alanine, respectively, within the context of the D1R T1 C-terminal mutant, severely diminishes β-arrestin recruitment: D1R WT EC50 = 2.9 ± 0.2 µM, Emax = 100%; D1R T1 EC50 = 3.4 ± 0.8 µM, Emax = 112 ± 5.1%; D1R T1 + T5V/S6A EC50 > 100 µM *, Emax = 17 ± 10.5% ***. (d) The T5V/S6A mutations have no effect on the ability of the D1R T1 truncation mutant to signal via G proteins: D1R WT EC50 = 4.6 ± 0.8 nM, Emax = 100%; D1R T1 EC50 = 5.4 ± 1.3 nM, Emax = 94 ± 5.3%; D1R T1 + T5V/S6A EC50 = 7.1 ± 1.5 nM, Emax 92 ± 2.9%.
Figure 6
Figure 6
Orthogonal assays of β-arrestin recruitment confirm that mutation of all C-terminal phosphorylation sites, or T5 and/or S6, severely diminishes β-arrestin recruitment. Direct D1R-β-arrestin BRET assays were performed as described in Section 4. Data are expressed as a percentage of the maximum D1R WT response to DA stimulation in each experiment and are displayed as the mean ± SEM of at least three experiments, performed in triplicate. Statistical comparisons between the following D1R WT and mutant curve parameters were made using a one-way ANOVA with Dunnett’s post hoc comparison: ***** p < 0.0001. (a) In this direct β-arrestin recruitment assay, the D1R Tail Total mutant displays diminished DA-induced β-arrestin recruitment: D1R WT EC50 = 1.3 ± 0.3 µM, Emax = 100%; D1R Tail Total EC50 = 4.0 ± 2.5 µM, Emax = 25 ± 3.1% ****. (b) β-Arrestin recruitment is also diminished by simultaneous mutation of residues T5 and S6: D1R WT EC50 = 1.1 ± 0.1 µM, Emax = 100%; D1R T5V/S6A EC50 = 1.1 ± 0.6 µM, Emax 36 ± 4.1% ****. (c) Mutation of either T5 or S6 to valine or alanine, respectively, diminishes β-arrestin recruitment to the D1R: D1R WT EC50 = 1.7 ± 0.3 µM, Emax = 100%; D1R T5V EC50 = 2.8 ± 1.1 µM, Emax = 39 ± 5.4% ****; D1R S6A EC50 = 5.5 ± 1.7 µM, Emax = 39 ± 2.8% ****.
Figure 7
Figure 7
Creation of a “GRK-null” D1R through simultaneous mutation of the GRK-mediated phosphorylation sites ablates β-arrestin recruitment to the D1R. The GRK-null construct is delineated in Figure 1 with red lettering/numbering. CAAX β-arrestin recruitment, CAMYEL cAMP accumulation, and direct D1R-β-arrestin BRET assays were performed as described in Section 4. (a) CAAX β-arrestin recruitment assays: D1R WT EC50 = 2.4 ± 0.1 µM, Emax = 100%; D1R GRK-null EC50 = undefined, Emax = 4.4 ± 2.7% ****. (b) Direct D1R-β-arrestin recruitment BRET assays: D1R WT EC50 = 0.8 ± 0.07 µM, Emax = 100%; D1R GRK-null EC50 = undefined, Emax = 5.1 ± 3.0% ****. (c) CAMYEL cAMP accumulation assays: D1R WT EC50 = 7.4 ± 0.7 nM, Emax = 100%; D1R GRK-null EC50 = 45 ± 9.9 nM **, Emax = 101 ± 4.4%. Data are expressed as a percentage of the maximum D1R WT response to DA and are shown as the mean ± SEM of at least three experiments performed in triplicate. Statistical comparisons between the D1R WT and mutant curve parameters were made using a t-test: ** p < 0.01, and **** p < 0.0001.
Figure 8
Figure 8
D1R residues phosphorylated by PKC have small but significant effects on DA-induced β-arrestin recruitment. CAAX β-arrestin recruitment and CAMYEL cAMP accumulation assays were performed as described in Section 4. (a) A “PKC-null” D1R in which residues S11–14 in the C-terminus and S4 in the ICL3 were simultaneously mutated to alanines displays a significant decrease in DA-induced β-arrestin recruitment: D1R WT EC50 = 3.4 ± 0.5 µM, Emax = 100%; D1R PKC-null EC50 = 4.5 ± 1.5 µM, Emax = 71 ± 3.5% ***. Reintroduction of serine S4 (S259) in the PKC-null mutant does not change DA-induced β-arrestin recruitment: D1R PKC-null + A259S EC50 = 3.2 ± 1.7 µM, Emax 59 ± 9.4% ****. (b) The PKC-null and PKC-null + A259 constructs display normal G protein signaling: D1R WT EC50 = 5.9 ± 0.7 nM, Emax = 100%; D1R PKC-null EC50 = 9.9 ± 1.5 nM, Emax = 101 ± 1.6%; D1R PKC-null A259S EC50 = 10 ± 1.6 nM, Emax 94 ± 4.4%. (c) A “reverse PKC” D1R construct in which residues S11, S12, S13, and S14 in the C-terminus were reverted to serines within the D1R Tail Total mutant does not display DA-induced β-arrestin recruitment: D1R WT EC50 = 2.6 ± 0.4 µM, Emax = 100%; D1R Rev PKC EC50 = undefined ****, Emax = no recruitment ****. (d) The D1R Rev PKC exhibits normal G protein interactions: D1R WT EC50 = 4.4 ± 0.3 nM, Emax = 100%; D1R Rev PKC EC50 = 6.2 ± 0.5 nM *, Emax = 102 ± 1.7%. Data are expressed as a percentage of the maximum WT response to DA and are shown as the mean ± SEM values of at least three experiments performed in triplicate. Statistical comparisons between the D1R WT and mutant curve parameters and between the D1R PKC-null and D1R PKC-null + A259S curve parameters in (a,b) were made using a one-way ANOVA with Sidak’s multiple post hoc comparison: WT vs. each mutant *** p < 0.0005, and **** p < 0.0001; D1R PKC-null vs. D1R PKC-null + A259S p > 0.05 in both (a,b). Statistical comparisons between WT and D1R Rev PKC curve parameters in (c,d) were made using a t-test: * p < 0.05 and **** p < 0.0001.
Figure 9
Figure 9
BRET assays of dopamine-induced D1R internalization indicate that the S2/S3/S4 cluster of serine residues in the ICL3 is necessary for efficient receptor internalization. Lyn BRET internalization assays were performed as described in Section 4. Data are expressed as a percentage of the maximum D1R WT response to DA in each experiment and are displayed as the mean ± SEM values of at least three experiments, performed in triplicate. Statistical comparisons between the following D1R WT and mutant curve parameters were made using a one-way ANOVA with Dunnett’s post hoc comparison: * p < 0.05 and ** p < 0.01. The Tail Total, GRK-null, and S2/S3/S4 mutants display severely impaired DA-induced receptor internalization, while the T5V/S6A mutant internalizes nearly to the same degree as WT: D1R WT EC50 = 5.1 ± 1.6 µM, Emax = 102 ± 1.9%; D1R GRK-null EC50 = undefined, Emax = 29 ± 10% *; D1R T5V/S6A EC50 = 2.4 ± 0.6 µM, Emax = 76 ± 9.6%; D1R Tail Total EC50 = undefined, Emax = 24 ± 10% *. D1R S2/S3/S4 EC50 = undefined, Emax = 34 ± 4.0% **.

Similar articles

Cited by

References

    1. Sibley D.R., Monsma F.J., Jr. Molecular biology of dopamine receptors. Trends Pharmacol. Sci. 1992;13:61–69. doi: 10.1016/0165-6147(92)90025-2. - DOI - PubMed
    1. Beaulieu J.M., Gainetdinov R.R. The physiology, signaling, and pharmacology of dopamine receptors. Pharmacol. Rev. 2011;63:182–217. doi: 10.1124/pr.110.002642. - DOI - PubMed
    1. Beaulieu J.M., Espinoza S., Gainetdinov R.R. Dopamine receptors - IUPHAR Review 13. Br. J. Pharmacol. 2015;172:1–23. doi: 10.1111/bph.12906. - DOI - PMC - PubMed
    1. Chen Q., Iverson T.M., Gurevich V.V. Structural Basis of Arrestin-Dependent Signal Transduction. Trends Biochem. Sci. 2018;43:412–423. doi: 10.1016/j.tibs.2018.03.005. - DOI - PMC - PubMed
    1. Gurevich E.V., Gurevich V.V. GRKs as Modulators of Neurotransmitter Receptors. Cells. 2020;10:52. doi: 10.3390/cells10010052. - DOI - PMC - PubMed

MeSH terms

LinkOut - more resources