. 2023 Apr 1;24(7):6622.
doi: 10.3390/ijms24076622.

Enriched Graphene Oxide-Polypropylene Suture Threads Buttons Modulate the Inflammatory Pathway Induced by Escherichia coli Lipopolysaccharide

Affiliations

Enriched Graphene Oxide-Polypropylene Suture Threads Buttons Modulate the Inflammatory Pathway Induced by Escherichia coli Lipopolysaccharide

Luigia Fonticoli et al. Int J Mol Sci. .

Abstract

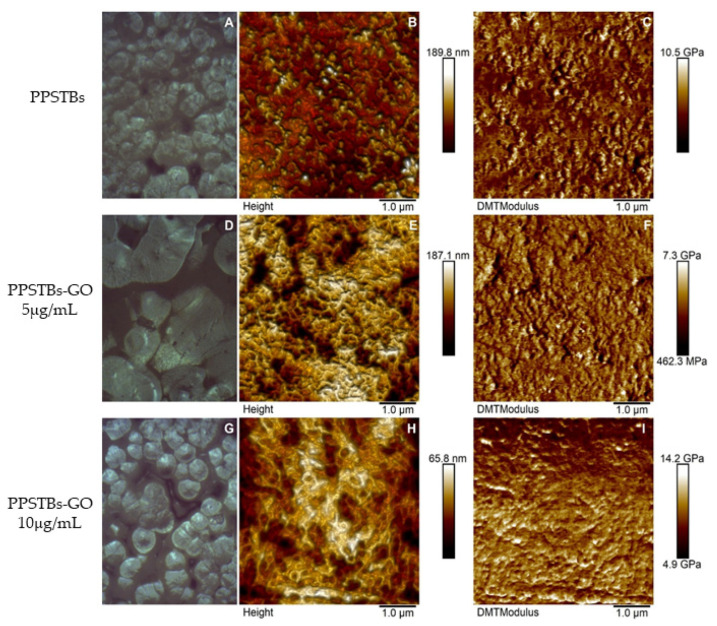
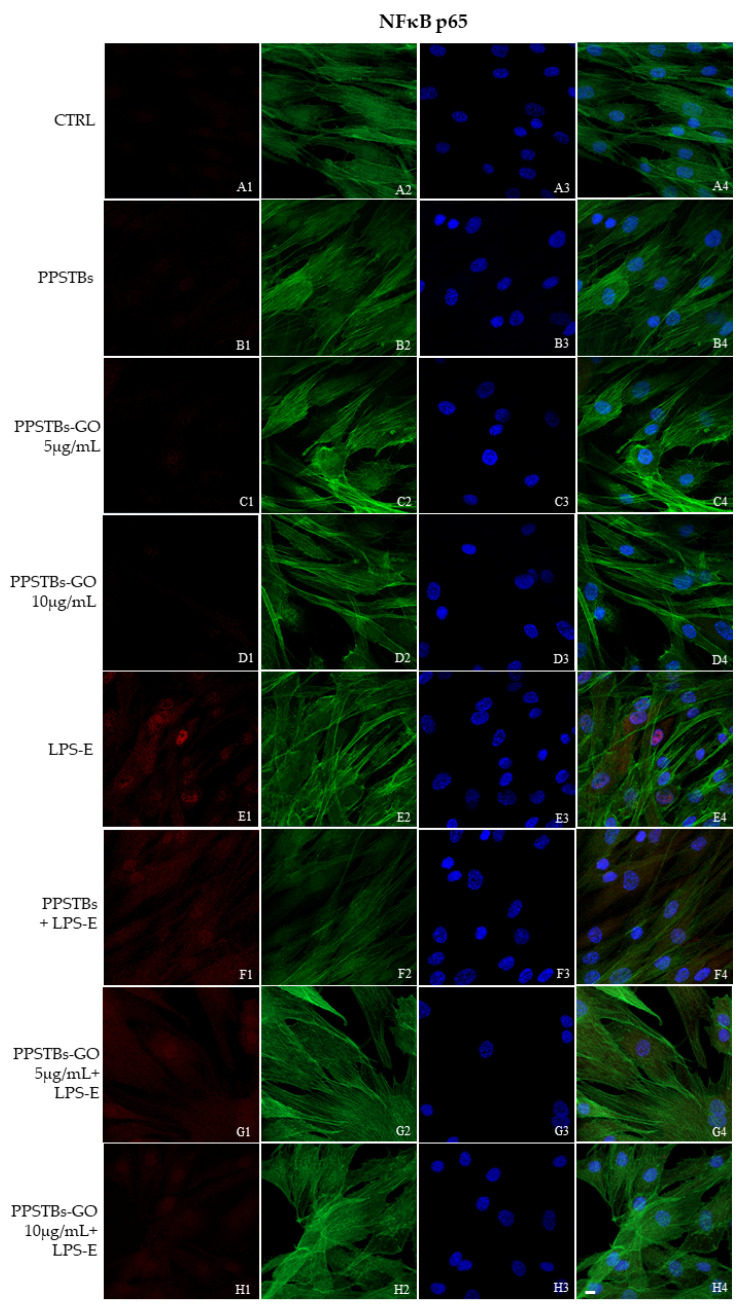
Graphene oxide (GO), derived from graphene, has remarkable chemical-physical properties such as stability, strength, and thermal or electric conductivity and additionally shows antibacterial and anti-inflammatory properties. The present study aimed to evaluate the anti-inflammatory effects of polypropylene suture threads buttons (PPSTBs), enriched with two different concentrations of GO, in the modulation of the inflammatory pathway TLR4/MyD 88/NFκB p65/NLRP3 induced by the Escherichia coli (E. coli) lipopolysaccharide (LPS-E). The gene and the protein expression of inflammatory markers were evaluated in an in vitro model of primary human gingival fibroblasts (hGFs) by real-time PCR, western blotting, and immunofluorescence analysis. Both GO concentrations used in the polypropylene suture threads buttons-GO constructs (PPSTBs-GO) decreased the expression of inflammatory markers in hGFs treated with LPS-E. The hGFs morphology and adhesion on the PPSTBs-GO constructs were also visualized by inverted light microscopy, scanning electron microscopy (SEM), and real-time PCR. Together, these results suggest that enriched PPSTBs-GO modulates the inflammatory process through TLR4/MyD 88/NFκB p65/NLRP3 pathway.

Keywords: graphene oxide; inflammasome; inflammation; polypropylene-GO composite; suture threads.


Conflict of interest statement

The authors declare no conflict of interest.

Figures

Figure 1
Figure 1
Optical images, AFM micrographs of 2D surface topography, and DMT Modulus channels of PPSTBs (AC), PPSTBs-GO 5 μg/mL (DF), and PPSTBs-GO 10 μg/mL (GI) samples.
Figure 2
Figure 2
The cell metabolic activity of hGFs with PPSTBs enriched with GO 5 μg/mL and GO 10 μg/mL at (a) 24 h, (b) 48 h, and (c) 72 h. * p < 0.05; ** p < 0.01; *** p < 0.001.
Figure 3
Figure 3
(A1D1) The morphology of hGFs alone or cultured with PPSTBs, PPSTBs-GO 5 μg/mL, and PPSTBs-GO 10 μg/mL were observed at the inverted light microscope. (A2D2) The morphology of hGFs alone or cultured with PPSTBs, PPSTBs-GO 5 μg/mL, and PPSTBs-GO 10 μg/mL and induced with LPS-E were observed at the inverted light microscope. Scale bar: 20 μm.
Figure 4
Figure 4
(A1C1) Representative SEM images of hGFs, cultured for 24 h on PPSTBs, PPSTBs-GO 5 μg/mL, and PPSTBs-GO 10 μg/mL in the absence of LPS-E treatment. (A2C2) hGFs, cultured for 24 h on PPSTBs, PPSTBs-GO 5 μg/mL, and PPSTBs-GO 10 μg/mL with LPS-E. hGFs developed abundant filopodia favoring attachment to the surface and revealing that cells grow in the presence of LPS-E and with different concentrations of GO. Scale bar 10 μm.
Figure 5
Figure 5
TLR4 signaling pathway in hGFs cell line. Expression of TLR4 analyzed by confocal microscopy (A1H4), TLR4 expression in untreated cells (CTRL), in hGFs cultured with PPSTBs, in hGFs cultured with PPSTBs enriched with GO at 5 μg/mL, in hGFs cultured with PPSTBs enriched with GO at 10 μg/mL, in hGFs stimulated with LPS-E, in hGFs cultured with PPSTBs and stimulated with LPS-E, in hGFs cultured with PPSTBs enriched with GO at 5 μg/mL and stimulated with LPS-E and in hGFs cultured with PPSTBs enriched with GO at 10 μg/mL and stimulated with LPS-E. Red fluorescence: TLR4 (A1H1); Green fluorescence: cytoskeleton actin (A2H2); Blue fluorescence: cell nuclei (A3H3) and Merge (A4H4). Scale bar: 20 μm.
Figure 6
Figure 6
MyD88 signaling pathway in hGFs cell line. Expression of MyD88 analyzed by confocal microscopy (A1H4), MyD88 expression untreated cells (CTRL), in hGFs cultured with PPSTBs, in hGFs cultured with PPSTBs enriched with GO at 5 μg/mL, in hGFs cultured with PPSTBs enriched with GO at 10 μg/mL, in hGFs stimulated with LPS-E, in hGFs cultured with PPSTBs and stimulated with LPS-E, in hGFs cultured with PPSTBs enriched with GO at 5 μg/mL and stimulated with LPS-E and in hGFs cultured with PPSTBs enriched with GO at 10 μg/mL and stimulated with LPS-E. Red fluorescence: Red fluorescence: MyD88 (A1H1); Green fluorescence: cytoskeleton actin (A2H2); Blue fluorescence: cell nuclei (A3H3) and Merge (A4H4). Scale bar: 20 μm.
Figure 7
Figure 7
NFκB p65 signaling pathway in hGFs cell line. Expression of NFκB analyzed by confocal microscopy (A1H4), NFκB p65 expression in untreated cells (CTRL), in hGFs cultured with PPSTBs, in hGFs cultured with PPSTBs enriched with GO at 5 μg/mL, in hGFs cultured with PPSTBs enriched with GO at 10 μg/mL, in hGFs stimulated with LPS-E, in hGFs cultured with PPSTBs and stimulated with LPS-E, in hGFs cultured with PPSTBs enriched with GO at 5 μg/mL and stimulated with LPS-E and in hGFs cultured with PPSTBs enriched with GO at 10 μg/mL and stimulated with LPS-E. Red fluorescence: Red fluorescence: NFκB p65 (A1H1); Green fluorescence: cytoskeleton actin (A2H2); Blue fluorescence: cell nuclei (A3H3) and Merge (A4H4). Scale bar: 20 μm.
Figure 8
Figure 8
NLRP3 signaling pathway in hGFs cell line. Expression of NLR3 analyzed by confocal microscopy (A1H4), NLRP3 expression untreated cells (CTRL), in hGFs cultured with PPSTBs, in hGFs cultured with PPSTBs enriched with GO at 5 μg/mL, in hGFs cultured with PPSTBs enriched with GO at 10 μg/mL, in hGFs stimulated with LPS-E, in hGFs cultured with PPSTBs and stimulated with LPS-E, in hGFs cultured with PPSTBs enriched with GO at 5 μg/mL and stimulated with LPS-E and in hGFs cultured with PPSTBs enriched with GO at 10 μg/mL and stimulated with LPS-E. Red fluorescence: Red fluorescence: NLRP3 (A1H1); Green fluorescence: cytoskeleton actin (A2H2); Blue fluorescence: cell nuclei (A3H3) and Merge (A4H4). Scale bar: 20 μm.
Figure 9
Figure 9
Western blotting analysis. TLR4, MyD88, NFκB p65 and NLRP3 protein expression in the untreated hGFs cells (CTRL), in hGFs cultured with PPSTBs, in hGFs cultured with PPSTBs enriched with GO at 5 μg/mL, in hGFs cultured with PPSTBs enriched with GO at 10 μg/mL, in hGFs stimulated with LPS-E, in hGFs cultured with PPSTBs and stimulated with LPS-E, in hGFs cultured with PPSTBs enriched with GO at 5 μg/mL and stimulated with LPS-E and in hGFs cultured with PPSTBs enriched with GO at 10 μg/mL and stimulated with LPS-E. (a) Each membrane was probed with β-actin antibody to verify the loading consistency. (be) Histograms represent densitometric measurements of protein bands expressed as the integrated optical intensity (IOI) mean of three separate experiments. The error bars show the standard deviation (±SD). *** p < 0.001.
Figure 10
Figure 10
(ad) Histograms of RT-PCR showed the mRNA levels of TLR4, MYD88, REALA, NLRP3 in untreated cells (CTRL), in hGFs cultured with PPSTBs, in hGFs cultured with PPSTBs enriched with GO at 5 μg/mL, in hGFs cultured with PPSTBs enriched with GO at 10 μg/mL, in hGFs stimulated with LPS-E, in hGFs cultured with PPSTBs and stimulated with LPS-E, in hGFs cultured with PPSTBs enriched with GO at 5 μg/mL and stimulated with LPS-E and in hGFs cultured with PPSTBs enriched with GO at 10 μg/mL and stimulated with LPS-E. *** p < 0.001.
Figure 11
Figure 11
(af) Histograms of RT-PCR showed the mRNA levels of FNT1, VIM, VCL, PTK2, ITGA5, and ITG1b in untreated cells (CTRL), in hGFs cultured with PPSTBs, in hGFs cultured with PPSTBs enriched with GO at 5 μg/mL, in hGFs cultured with PPSTBs enriched with GO at 10 μg/mL, in hGFs stimulated with LPS-E, in hGFs cultured with PPSTBs and stimulated with LPS-E, in hGFs cultured with PPSTBs enriched with GO at 5 μg/mL and stimulated with LPS-E and in hGFs cultured with PPSTBs enriched with GO at 10 μg/mL and stimulated with LPS-E. * p < 0.05; ** p < 0.01; *** p < 0.001.
Figure 12
Figure 12
(a) Photograph of GO aqueous dispersion 1 mg/mL (left) and the obtained GO sponge after freeze-drying process (right) and (b) UV-Vis spectra of GO aqueous dispersion before freeze-drying (straight line) and GO aqueous dispersion obtained by redispersion of GO sponge (dotted line). The decrease of the absorbance after lyophilization is due to the loss of material during the process.

Similar articles

Cited by

References

    1. Geim A.K., Novoselov K.S. The rise of graphene. Nat. Mater. 2007;6:183–191. doi: 10.1038/nmat1849. - DOI - PubMed
    1. Armano A., Agnello S. Two-Dimensional Carbon: A Review of Synthesis Methods, and Electronic, Optical, and Vibrational Properties of Single-Layer Graphene. J. Carbon Res. 2019;5:67. doi: 10.3390/c5040067. - DOI
    1. Yang G., Li L., Lee W.B., Ng M.C. Structure of graphene and its disorders: A review. Sci. Technol. Adv. Mater. 2018;19:613–648. doi: 10.1080/14686996.2018.1494493. - DOI - PMC - PubMed
    1. Souza I.E.P., Cambraia L.V., Gomide V.S., Nunes E.H.M. Short review on the use of graphene as a biomaterial-prospects, and challenges in Brazil. J. Mater. Res. Technol. 2022;19:2410–2430. doi: 10.1016/j.jmrt.2022.05.170. - DOI
    1. Sunderrajan S., Miranda L.R., Pennathur G. Improved stability and catalytic activity of graphene oxide/chitosan hybrid beads loaded with porcine liver esterase. Prep. Biochem. Biotechnol. 2018;48:343–351. doi: 10.1080/10826068.2018.1446153. - DOI - PubMed

MeSH terms

LinkOut - more resources