. 2023 Apr 4;24(7):6716.
doi: 10.3390/ijms24076716.

Transcriptomic Changes Predict Metabolic Alterations in LC3 Associated Phagocytosis in Aged Mice

Affiliations

Transcriptomic Changes Predict Metabolic Alterations in LC3 Associated Phagocytosis in Aged Mice

Anuradha Dhingra et al. Int J Mol Sci. .

Abstract

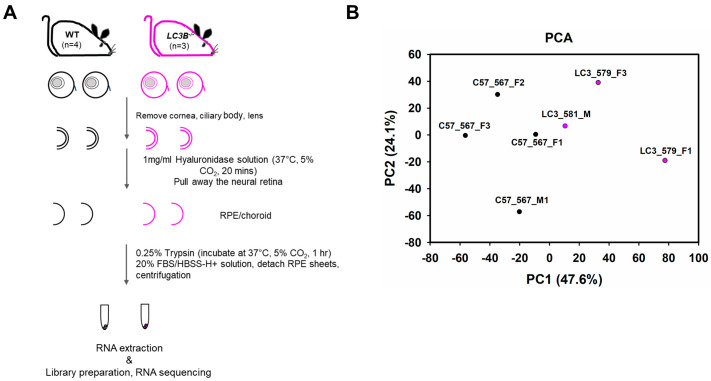
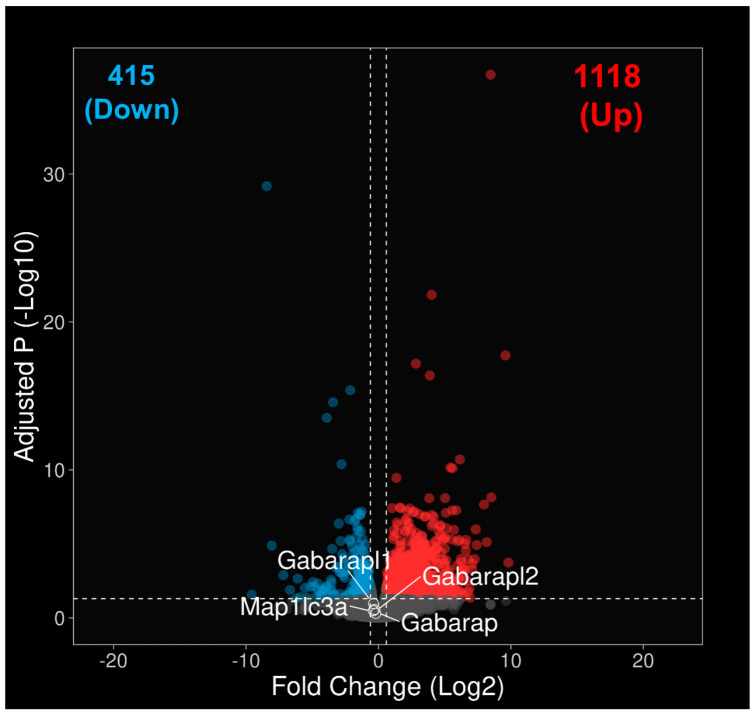
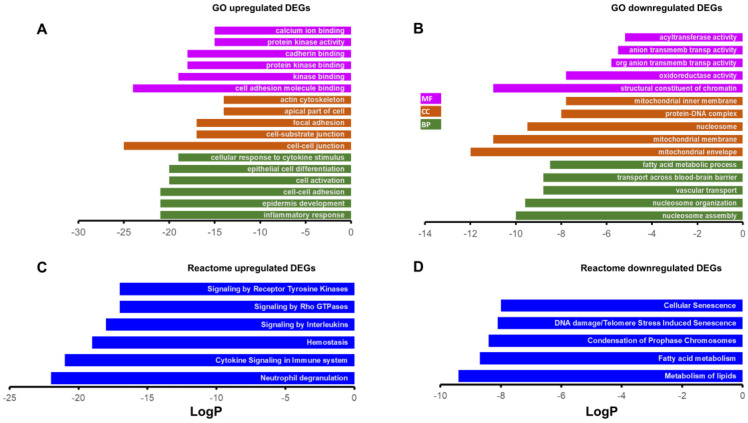
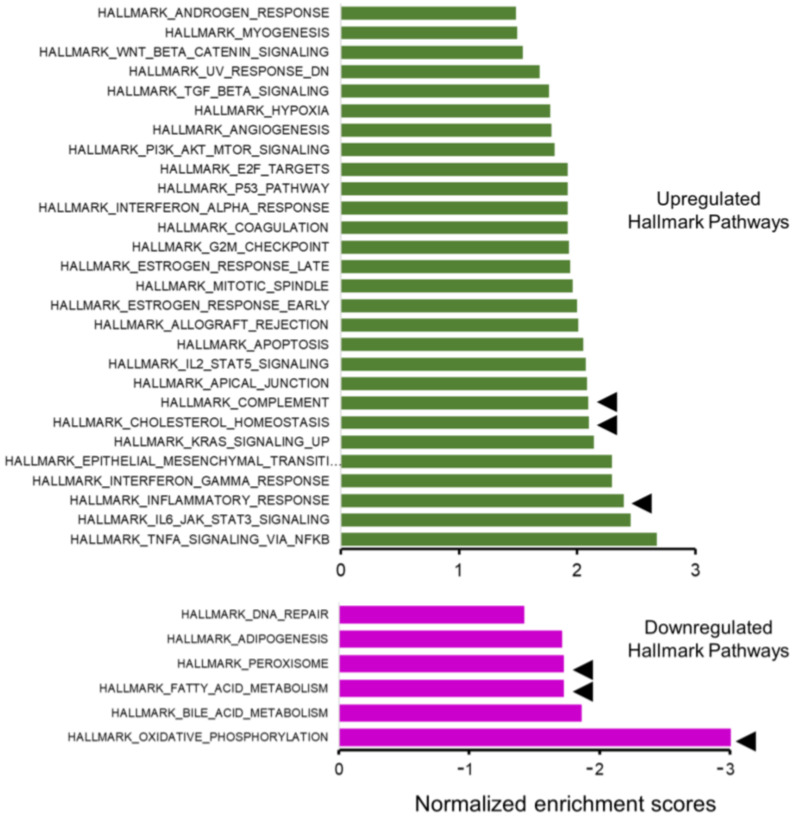
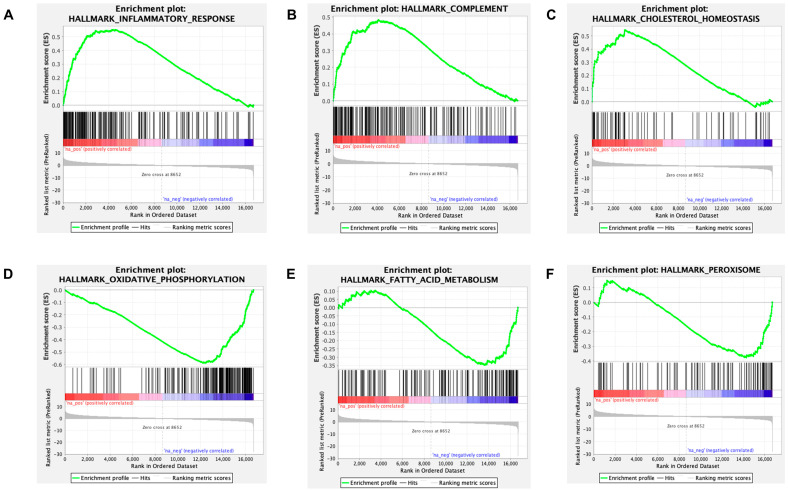
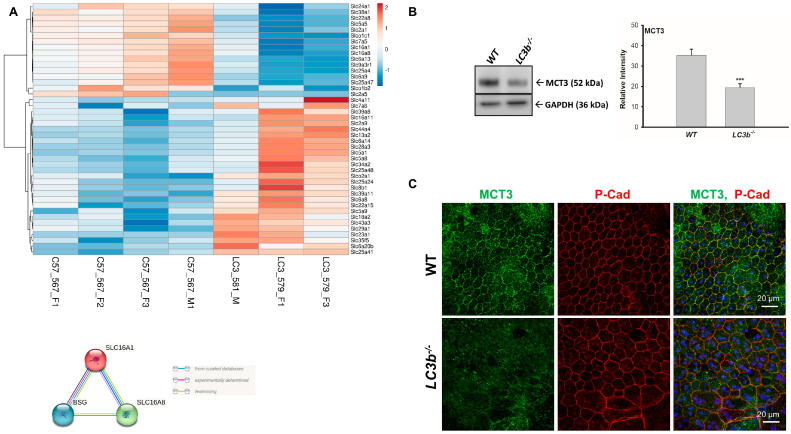
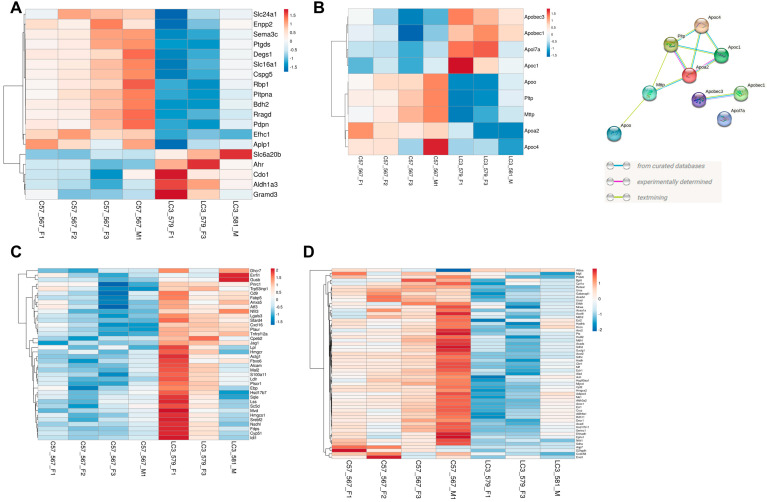
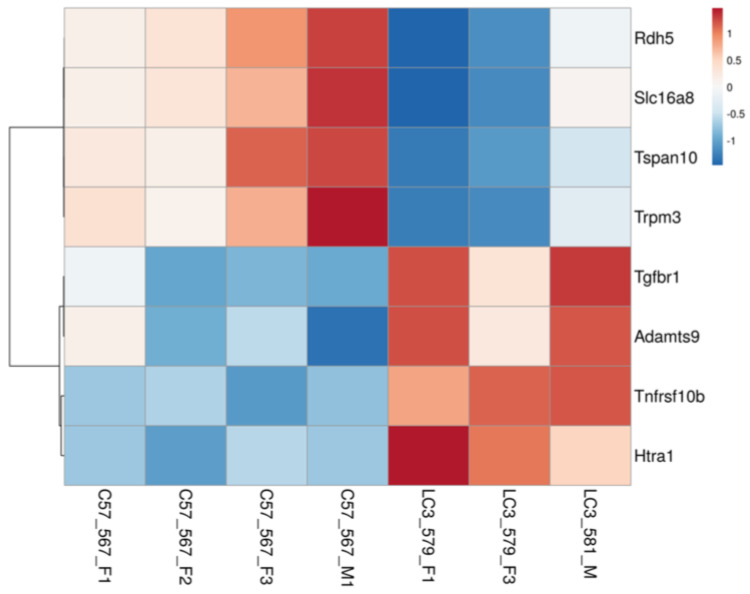
LC3b (Map1lc3b) plays an essential role in canonical autophagy and is one of several components of the autophagy machinery that mediates non-canonical autophagic functions. Phagosomes are often associated with lipidated LC3b to promote phagosome maturation in a process called LC3-associated phagocytosis (LAP). Specialized phagocytes, such as mammary epithelial cells, retinal pigment epithelial (RPE) cells, and sertoli cells, utilize LAP for optimal degradation of phagocytosed material, including debris. In the visual system, LAP is critical to maintain retinal function, lipid homeostasis, and neuroprotection. In a mouse model of retinal lipid steatosis-mice lacking LC3b (LC3b-/-), we observed increased lipid deposition, metabolic dysregulation, and enhanced inflammation. Herein, we present a non-biased approach to determine if loss of LAP mediated processes modulate the expression of various genes related to metabolic homeostasis, lipid handling, and inflammation. A comparison of the RPE transcriptome of WT and LC3b-/- mice revealed 1533 DEGs, with ~73% upregulated and 27% downregulated. Enriched gene ontology (GO) terms included inflammatory response (upregulated DEGs), fatty acid metabolism, and vascular transport (downregulated DEGs). Gene set enrichment analysis (GSEA) identified 34 pathways; 28 were upregulated (dominated by inflammation/related pathways) and 6 were downregulated (dominated by metabolic pathways). Analysis of additional gene families identified significant differences for genes in the solute carrier family, RPE signature genes, and genes with a potential role in age-related macular degeneration. These data indicate that loss of LC3b induces robust changes in the RPE transcriptome contributing to lipid dysregulation and metabolic imbalance, RPE atrophy, inflammation, and disease pathophysiology.

Keywords: LC3-associated phagocytosis (LAP); cholesterol metabolism; cholesterol trafficking; fatty acid metabolism; inflammation; monocarboxylate transporters; peroxisomes; retinal pigment epithelium (RPE); transcriptomics.


Conflict of interest statement

The authors declare no conflict of interest. The funders had no role in the design of the study; in the collection, analyses, or interpretation of data; in the writing of the manuscript; or in the decision to publish the results.

Figures

Figure 1
Figure 1
Retinal pigment epithelium (RPE) cell isolation for RNAseq and Principal component analysis. (A) Experimental design to isolate RPE from mouse eyes; ~24-month old WT and LC3b−/− mice were sacrificed, and the eyeballs were removed and processed to isolate RPE cells by enzymatic treatments as indicated. Total RNA was extracted and used for library preparation and RNA sequencing. (B) Principal component analysis (PCA), X-axis, and Y-axis show PC1 and PC2, respectively.
Figure 2
Figure 2
Differentially expressed genes (DEGs) between the LC3b−/− and WT RPE. Volcano plot of DEGs between the LC3b−/− and WT RPE with –Log10 of the adjusted p value on the Y axis and Log2 of the fold change expression on the X axis. Each point represents a single gene. DEGs were identified by using a cut-off of Padj <0.05 and fold change of ≤−1.5 or ≥1.5 and have been shown in red (upregulated DEGs), cyan (dowregulated DEGs), or grey dots (unchanged genes). Genes that are upregulated in the LC3b−/− are on the right (Up) and downregulated genes are on the left (Down). Genes belonging to ATG8/LC3 family (except for Map1lc3b) are indicated. Map1lc3b with adjusted P (-Log10) of 168.4 is not shown in the volcano plot.
Figure 3
Figure 3
Gene Ontology (GO) and reactome based gene enrichments. The top 5 most enriched GO terms of upregulated DEGs (A) and downregulated DEGs (B). The top 5 most enriched reactome gene terms for upregulated DEGs (C) and downregulated DEGs (D). The terms were selected based on the lowest LogP values (>5 GO terms shown in cases where LogP values were exactly same for more than one term). Analysis was performed using Metascape. MF: molecular function; CC: cellular component; BP: biological process.
Figure 4
Figure 4
Gene set Enrichment Analysis (GSEA). Bar chart showing absolute normalized enrichment scores for the hallmark pathways that were significantly different between the LC3b−/− and WT (false discovery rate or FDR < 0.05); GSEA identified 34 significantly different hallmark pathways: 28 were upregulated (top panel) and 6 were downregulated (bottom panel). Pathways indicated by arrowhead (◄) were selected for further analysis.
Figure 5
Figure 5
GSEA enrichment profile of upregulated and downregulated pathways. (A) A GSEA enrichment plot of the hallmark inflammatory response pathway with a normalized enrichment score 2.39 and an enrichment score of 0.55 indicating a positive relation. The leading edge includes 112 genes. (B) A GSEA enrichment plot of the hallmark complement pathway with a normalized enrichment score 2.1 and an enrichment score of 0.48 indicating a positive relation. The leading edge comprised 85 genes. (C) A GSEA enrichment plot of the hallmark cholesterol homeostasis pathway with a normalized enrichment score 2.1 and an enrichment score of 0.55 indicating a positive relation. The leading edge comprised 38 genes. (D) A GSEA enrichment plot of the hallmark oxidative phosphorylation pathway with a normalized enrichment score −3.02 and an enrichment score of −0.59 indicating a negative relation. The leading edge comprised 138 genes. (E) A GSEA enrichment plot of the hallmark fatty acid metabolism pathway with a normalized enrichment score −1.72 and an enrichment score of −0.35, indicating a negative relation. The leading edge comprised 57 genes. (F) A GSEA enrichment plot of the hallmark peroxisome pathway with a normalized enrichment score −1.72 and an enrichment score of −0.38 indicating a negative relationship. The leading edge comprised 35 genes.
Figure 6
Figure 6
Analysis of the solute carrier family genes. (A) Top: Heat map of various solute carrier family DEGs. The variance stabilized counts were converted to heat map colors using Clustvis software. Rows are centered; unit variance scaling is applied to rows. Rows are clustered using correlation distance and average linkage. The intensity scale ranges from low expression (dark blue) to high expression (red) relative to the median of the gene’s expression across all samples. Gene names (left) and mouse ID (bottom) are indicated. χ2 = 9.599 with 1 degrees of freedom, two-tailed p-value = 0.0019. Bottom: String diagram showing nexus between Slc16a1, Slc16a8, and Basigin (Bsg). (B) Left: Western blots of RPE/choroid from WT and LC3b−/−. Immunoblot analysis was performed with antibodies against MCT3 and loading control (GAPDH). Right: Quantification of mean intensity ±SEM of MCT3 relative to GAPDH (N = 3 eyes) *** p < 0.005. (C) Representative confocal images of RPE/choroid flat mount from WT (top) and LC3b−/− (bottom) immuno-stained for MCT3 (green) and P-cadherin (red). Images are projections from 5 µm stacks captured using 60× water objective (NA1.2) on Nikon A1R laser scanning confocal microscope.
Figure 7
Figure 7
Heat maps depicting DEGs or leading-edge genes in different gene sets. (A) Heat map of the DEGs between the LC3b−/− and WT from RPE signature gene set. An amount of 19 DEGs out of 149 RPE signature genes were examined; χ2 = 6.43 with 1 degrees of freedom (two-tailed p-value = 0.0112). (B) Heat map of the DEGs (between the LC3b−/− and WT RPE) overlapping with lipoprotein metabolism associated genes. An amount of 9 DEGs out of 41 lipoprotein metabolism associated genes were examined; χ2 = 13.93 with 1 degrees of freedom (two-tailed p-value = 0.0002). (C) Genes in the leading edge of cholesterol homeostasis hallmark pathway (upregulated). (D) Genes in the leading edge of fatty acid metabolism hallmark pathway (downregulated). For all the heatmaps, the variance stabilized counts were converted to colors using Clustvis software. Rows are centered; unit variance scaling is applied to rows. Rows are clustered using correlation distance and average linkage. The intensity scale ranges from low expression (dark blue) to high expression (red) relative to the median of the gene’s expression across all samples. Gene names (left) and mouse ID (bottom) are indicated.
Figure 8
Figure 8
Heat map of the DEGs overlapping with AMD loci genes. AMD loci genes with top priority based on biological and statistical evidence combined (from Fritsche et. al. 2016) were used for the analysis. The variance stabilized counts were converted to heat map colors using Clustvis software. Rows are centered; unit variance scaling is applied to rows. Rows are clustered using correlation distance and average linkage. The intensity scale ranges from low expression (dark blue) to high expression (red) relative to the median of the gene’s expression across all samples. Gene names (left) and mouse ID (bottom) are indicated. χ2 equals 12.02 with 1 degrees of freedom; two-tailed p value = 0.0005.

Update of

Similar articles

Cited by

References

    1. Dikic I., Elazar Z. Mechanism and medical implications of mammalian autophagy. Nat. Rev. Mol. Cell Biol. 2018;19:349–364. doi: 10.1038/s41580-018-0003-4. - DOI - PubMed
    1. Cemma M., Brumell J.H. Interactions of pathogenic bacteria with autophagy systems. Curr. Biol. 2012;22:R540–R545. doi: 10.1016/j.cub.2012.06.001. - DOI - PubMed
    1. Peña-Martinez C., Rickman A.D., Heckmann B.L. Beyond autophagy: LC3-associated phagocytosis and endocytosis. Sci. Adv. 2022;8:eabn1702. doi: 10.1126/sciadv.abn1702. - DOI - PMC - PubMed
    1. Ohsumi Y. Historical landmarks of autophagy research. Cell Res. 2014;24:9–23. doi: 10.1038/cr.2013.169. - DOI - PMC - PubMed
    1. Klionsky D.J., Abdel-Aziz A.K., Abdelfatah S., Abdellatif M., Abdoli A., Abel S., Abeliovich H., Abildgaard M.H., Abudu Y.P., Acevedo-Arozena A., et al. Guidelines for the use and interpretation of assays for monitoring autophagy (4th edition)(1) Autophagy. 2021;17:1–382. doi: 10.1080/15548627.2020.1797280. - DOI - PMC - PubMed