. 2023 Apr 4;24(7):6717.
doi: 10.3390/ijms24076717.

1,25(OH)2D3 Differently Modulates the Secretory Activity of IFN-DC and IL4-DC: A Study in Cells from Healthy Donors and MS Patients

Affiliations

1,25(OH)2D3 Differently Modulates the Secretory Activity of IFN-DC and IL4-DC: A Study in Cells from Healthy Donors and MS Patients

Isabella Sanseverino et al. Int J Mol Sci. .

Abstract

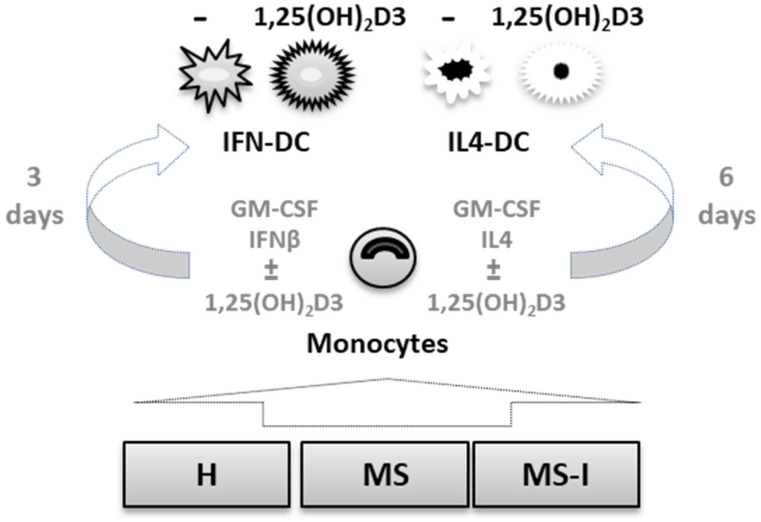
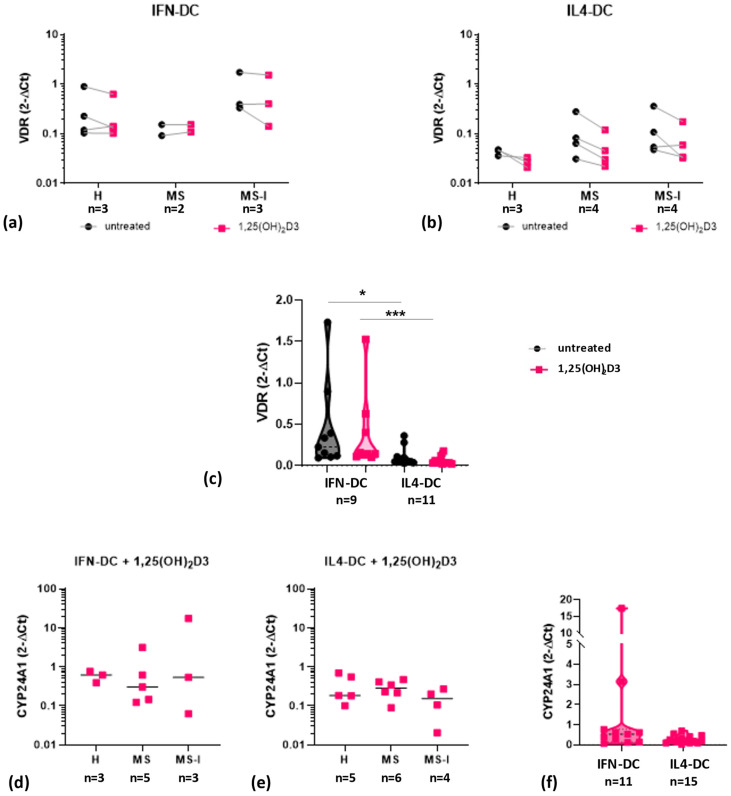
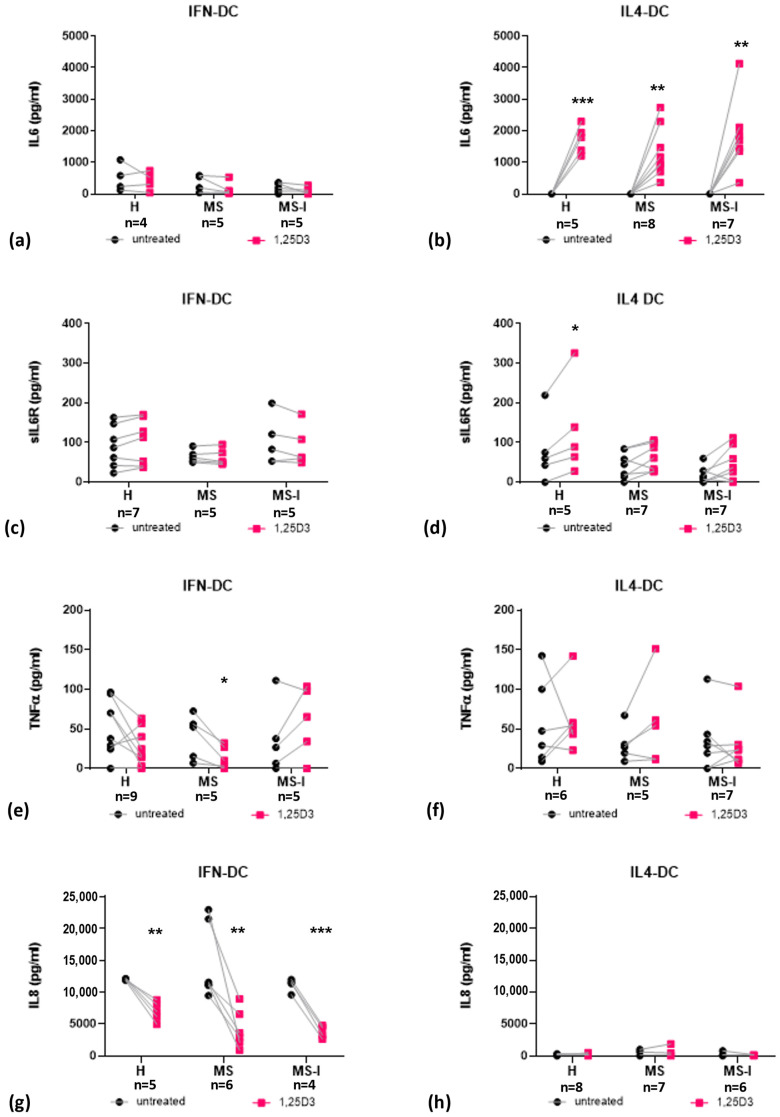
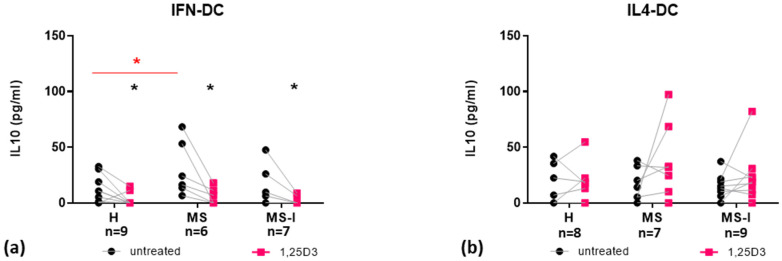
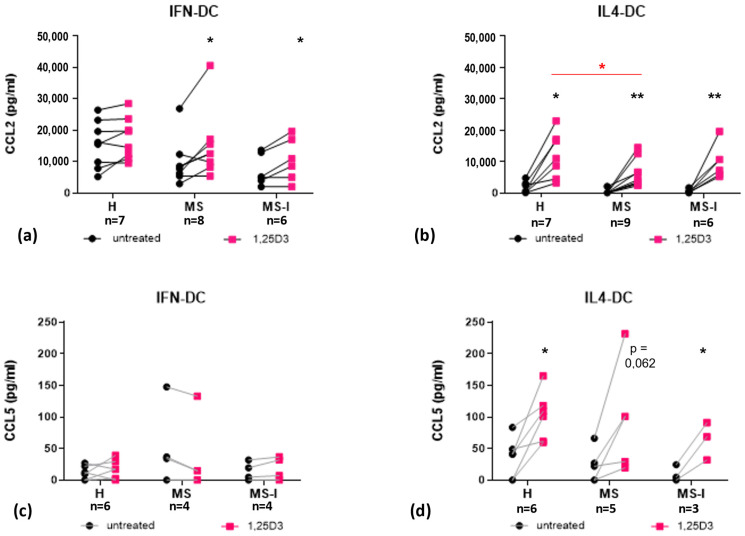
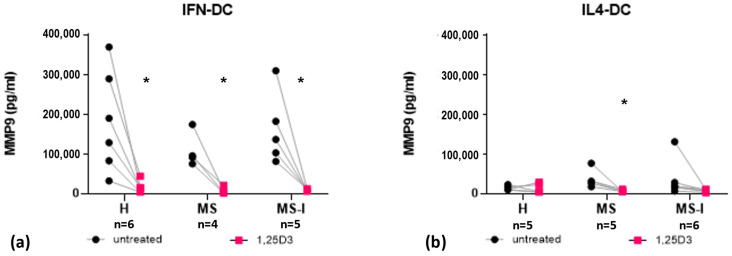
Immune mechanisms play an essential role in driving multiple sclerosis (MS) and altered trafficking and/or activation of dendritic cells (DC) were observed in the central nervous system and cerebrospinal fluid of MS patients. Interferon β (IFNβ) has been used as a first-line therapy in MS for almost three decades and vitamin D deficiency is a recognized environmental risk factor for MS. Both IFNβ and vitamin D modulate DC functions. Here, we studied the response to 1,25-dihydoxyvitamin D3 (1,25(OH)2D3) of DC obtained with IFNβ/GM-CSF (IFN-DC) compared to classically derived IL4-DC, in three donor groups: MS patients free of therapy, MS patients undergoing IFNβ therapy, and healthy donors. Except for a decreased CCL2 secretion by IL4-DC from the MS group, no major defects were observed in the 1,25(OH)2D3 response of either IFN-DC or IL4-DC from MS donors compared to healthy donors. However, the two cell models strongly differed for vitamin D receptor level of expression as well as for basal and 1,25(OH)2D3-induced cytokine/chemokine secretion. 1,25(OH)2D3 up-modulated IL6, its soluble receptor sIL6R, and CCL5 in IL4-DC, and down-modulated IL10 in IFN-DC. IFN-DC, but not IL4-DC, constitutively secreted high levels of IL8 and of matrix-metalloproteinase-9, both down-modulated by 1,25(OH)2D3. DC may contribute to MS pathogenesis, but also provide an avenue for therapeutic intervention. 1,25(OH)2D3-induced tolerogenic DC are in clinical trial for MS. We show that the protocol of in vitro DC differentiation qualitatively and quantitatively affects secretion of cytokines and chemokines deeply involved in MS pathogenesis.

Keywords: chemokine; cytokine; immune pathophysiology; modifiable environmental factor; monocyte-derived dendritic cell; multiple sclerosis; type I IFN; vitamin D.


Conflict of interest statement

The authors declare no conflict of interest. The funders had no role in the design of the study; in the collection, analyses, or interpretation of data; in the writing of the manuscript; or in the decision to publish the results.

Figures

Figure 1
Figure 1
Cell models. CD14+ monocytes were obtained from three groups of donors: healthy donors, H; relapsing remitting multiple sclerosis (RRMS) patients free of therapy, MS; RRMS patients undergoing interferon (IFN) therapy, MS-I. Monocytes were in vitro differentiated into IFN-DC or IL4-DC, in the presence or in the absence of 10 nM 1,25-dihydroxyvitamin D3 (1,25(OH)2D3).
Figure 2
Figure 2
Expression and modulation by 1,25(OH)2D3 of vitamin D receptor (VDR) and CYP24A1 mRNA. VDR (ac) and CYP24A1 (df) mRNA expression in IFN-DC (a,d) and IL4-DC (b,e) were analyzed by quantitative RT-PCR and expressed as 2−ΔCT values. GAPDH was used as reference gene. Violin plot of VDR (c) and CYP24A1 (f) mRNA data after pooling data obtained from the three donor groups. Cell type effects (e.g., quantitative differences between IFN-DC and IL4-DC) were tested by Kruskal–Wallis test with Dunn’s post-test for multiple comparisons for VDR and Mann–Whitney test for CYP24A1. Number of subjects (n) analyzed are indicated under each panel. Black dots indicate untreated cells, pink squares indicate 1,25(OH)2D3 treated cells; * p ≤ 0.05, *** p ≤ 0.001.
Figure 3
Figure 3
Expression and modulation by 1,25(OH)2D3 of pro-inflammatory cytokines. IL6 (a,b), sIL6R (c,d), TNFα (e,f) and IL8 (g,h) concentrations measured in IFN-DC (a,c,e,g) and IL4-DC (b,d,f,h) supernatants from H, MS, and MS-I donors are shown as individual values. Number of subjects (n) analyzed are indicated. Black dots represent untreated cells, pink squares represent 1,25(OH)2D3 treated cells. 1,25(OH)2D3 treatment effects were tested by Student’s t-test for paired samples. * p ≤ 0.05, ** p ≤0.01, *** p ≤ 0.001. No donor effect was found by two-way ANOVA with Tukey’s post-test.
Figure 4
Figure 4
Expression and modulation by 1,25(OH)2D3 of IL10. IL10 concentrations measured in IFN-DC (a) and IL4-DC (b) supernatants from H, MS, and MS-I donors are shown as individual values. Number of subjects (n) analyzed are indicated. Black dots represent untreated cells, pink squares represent 1,25(OH)2D3 treated cells. 1,25(OH)2D3 treatment effects were tested by Student’s t-test for paired samples. Donor group effects were tested by two-way ANOVA with Tukey’s post-test for multiple comparisons. Significantly different comparison is indicated by a red bar/asterisk, * p ≤ 0.05.
Figure 5
Figure 5
Expression and modulation by 1,25(OH)2D3 of CCR2 and CCR5 ligands. CCL2 (a,b) and CCL5 (c,d) concentrations measured in supernatants of IFN-DC (a,c) and IL4-DC (b,d) from H, MS, and MS-I donors are shown as individual values. Number of subjects (n) analyzed are indicated. Black dots represent untreated cells, pink squares represent 1,25(OH)2D3 treated cells. 1,25(OH)2D3 treatment effects were tested by Student’s t-test for paired samples (black asterisks). Donor group effects were tested by two-way ANOVA with Tukey’s post-test for multiple comparisons. Significantly different comparison is indicated by a red bar/asterisk. * p ≤ 0.05, ** p ≤ 0.01.
Figure 6
Figure 6
Expression and modulation by 1,25(OH)2D3 of matrix-metalloproteinase 9 (MMP9). MMP9 concentrations measured in IFN-DC (a) and IL4-DC (b) supernatants from H, MS, and MS-I donors are shown as individual values. Number of subjects (n) analyzed are indicated. Black dots represent untreated cells, pink squares represent 1,25(OH)2D3 treated cells. 1,25(OH)2D3 treatment effects were tested by Student’s t-test for paired samples, * p ≤ 0.05. Donor group effects were tested by two-way ANOVA with Tukey’s post-test for multiple comparisons. No significant effect was detected.

Similar articles

References

    1. Thompson A.J., Baranzini S.E., Geurts J., Hemmer B., Ciccarelli O. Multiple Sclerosis. Lancet. 2018;391:1622–1636. doi: 10.1016/S0140-6736(18)30481-1. - DOI - PubMed
    1. Simon K.C., Munger K.L., Ascherio A. Vitamin D and Multiple Sclerosis: Epidemiology, Immunology, and Genetics. Curr. Opin. Neurol. 2012;25:246–251. doi: 10.1097/WCO.0b013e3283533a7e. - DOI - PMC - PubMed
    1. Sintzel M.B., Rametta M., Reder A.T. Vitamin D and Multiple Sclerosis: A Comprehensive Review. Neurol. Ther. 2018;7:59–85. doi: 10.1007/s40120-017-0086-4. - DOI - PMC - PubMed
    1. Vandebergh M., Degryse N., Dubois B., Goris A. Environmental Risk Factors in Multiple Sclerosis: Bridging Mendelian Randomization and Observational Studies. J. Neurol. 2022;269:4565–4574. doi: 10.1007/s00415-022-11072-4. - DOI - PubMed
    1. Jagannath V.A., Filippini G., Di Pietrantonj C., Asokan G.V., Robak E.W., Whamond L., Robinson S.A. Vitamin D for the Management of Multiple Sclerosis. Cochrane Database Syst. Rev. 2018;9:CD008422. doi: 10.1002/14651858.CD008422.pub3. - DOI - PMC - PubMed