. 2023 Apr 4;24(7):6748.
doi: 10.3390/ijms24076748.

Modulation of Cellular Senescence in HEK293 and HepG2 Cells by Ultrafiltrates UPla and ULu Is Partly Mediated by Modulation of Mitochondrial Homeostasis under Oxidative Stress

Affiliations

Modulation of Cellular Senescence in HEK293 and HepG2 Cells by Ultrafiltrates UPla and ULu Is Partly Mediated by Modulation of Mitochondrial Homeostasis under Oxidative Stress

Junxian Zhou et al. Int J Mol Sci. .

Abstract

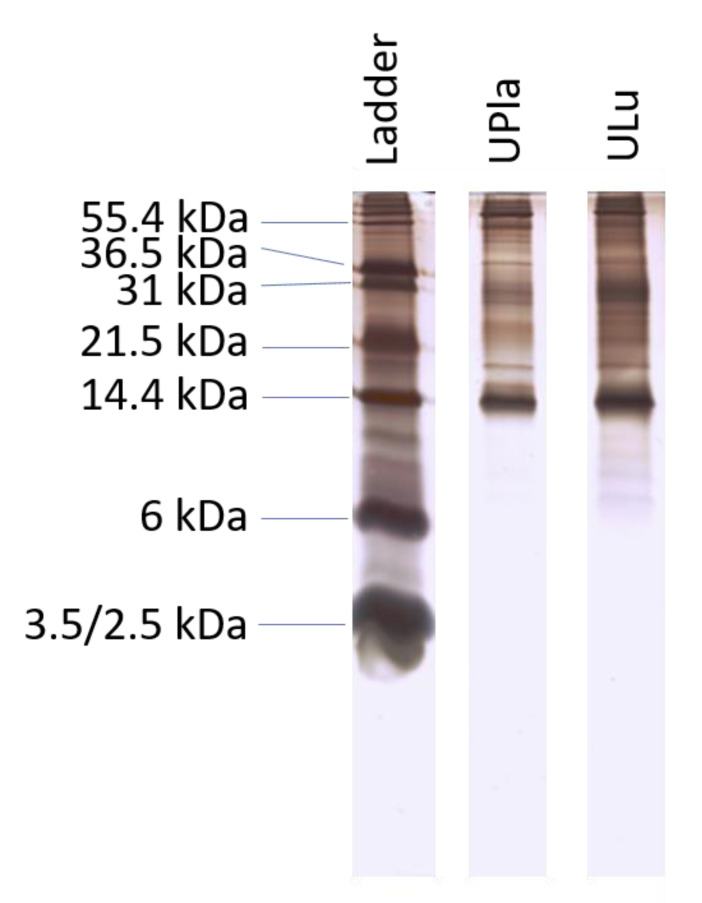
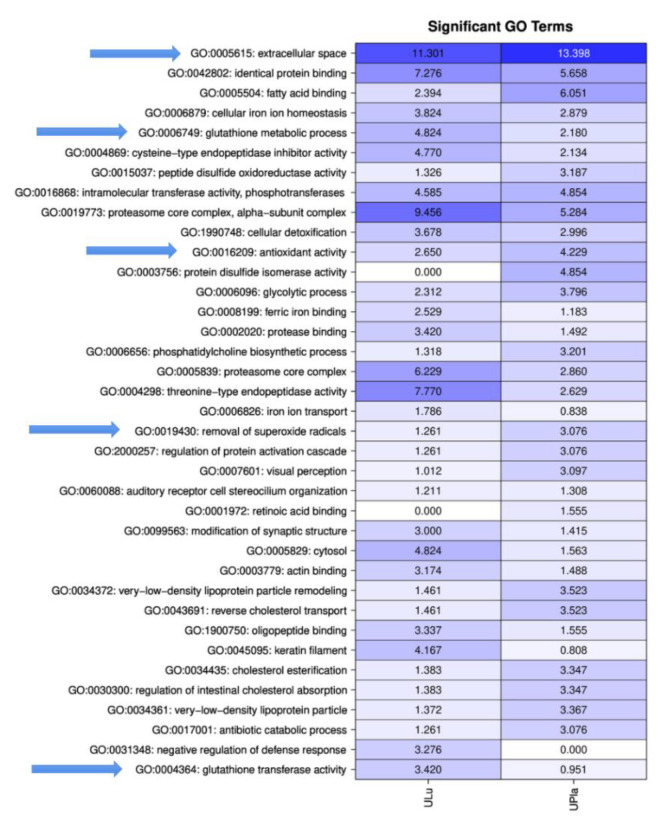
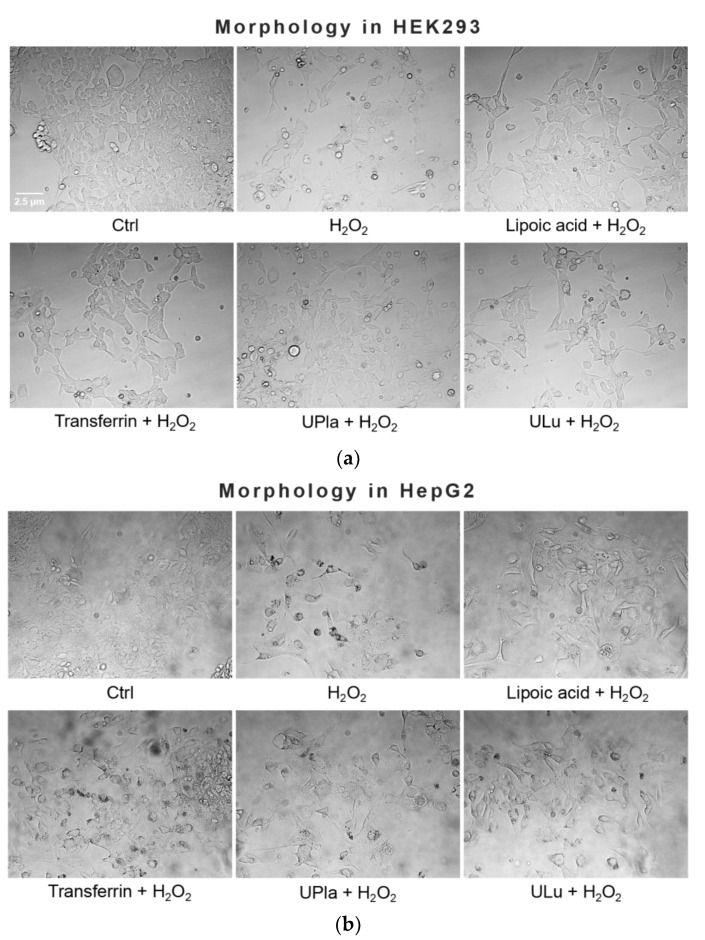
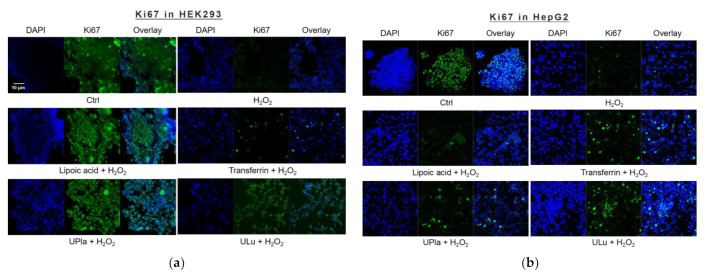
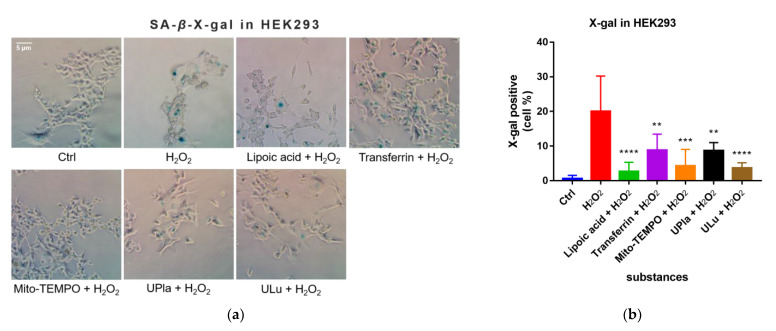
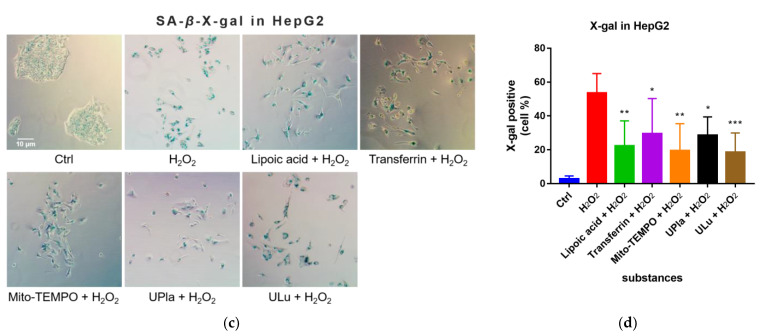
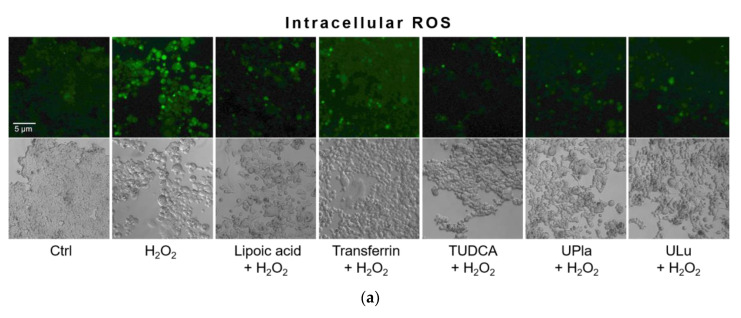
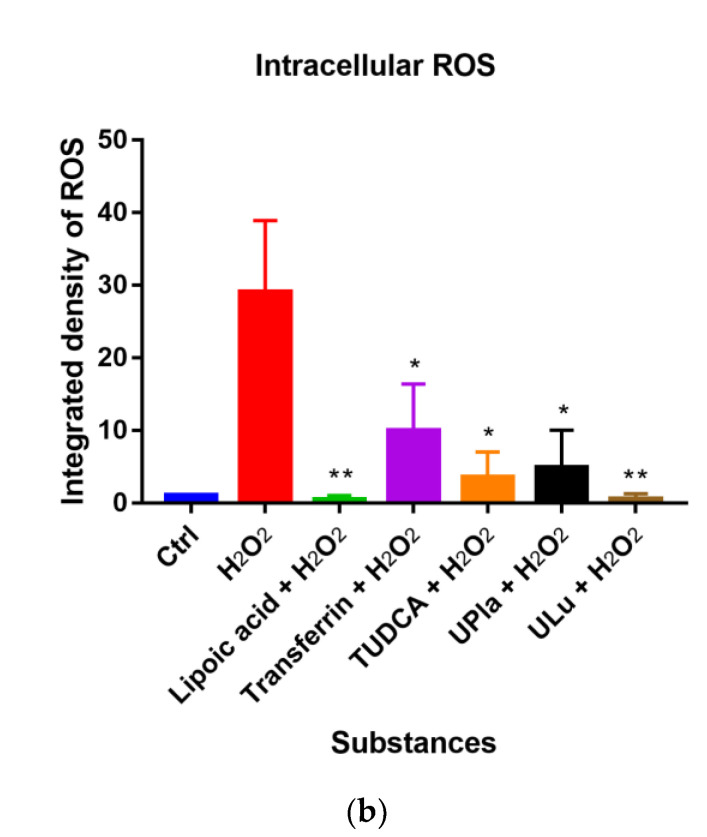
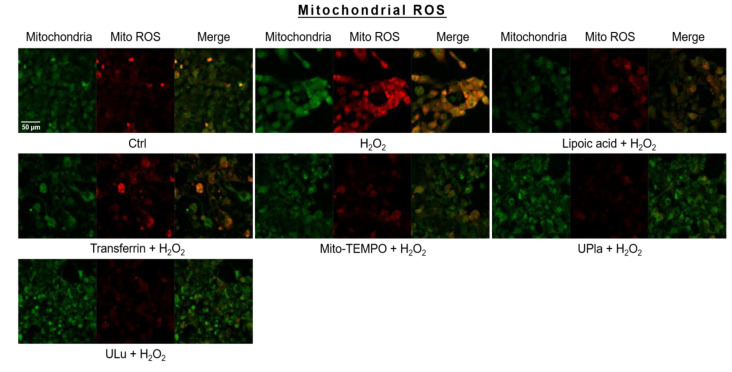
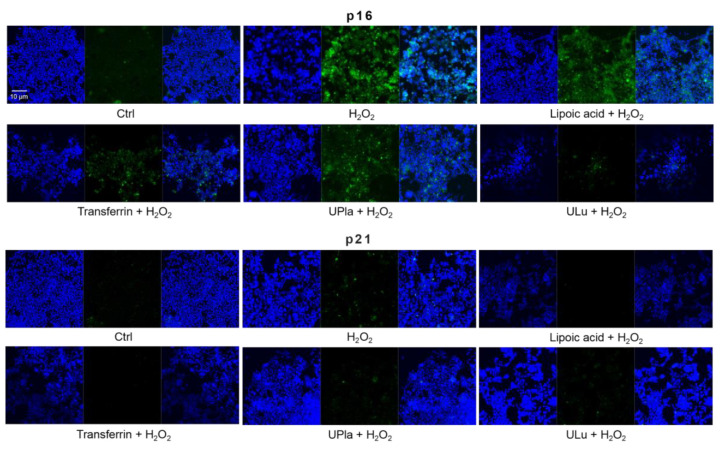
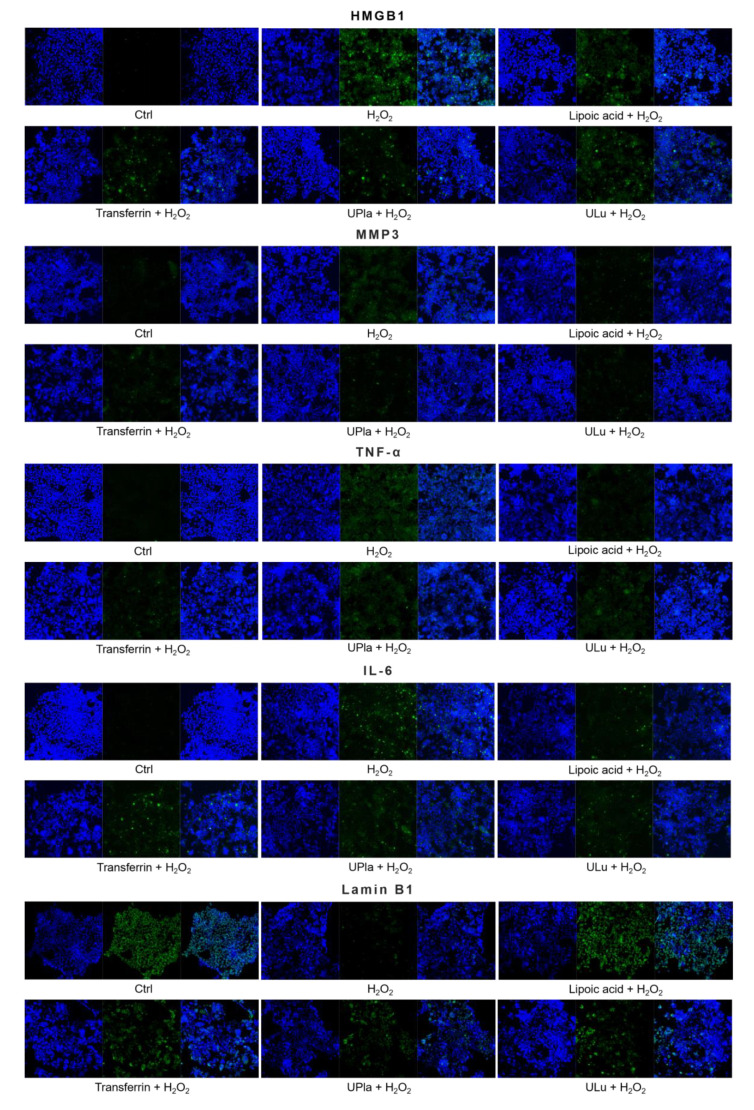
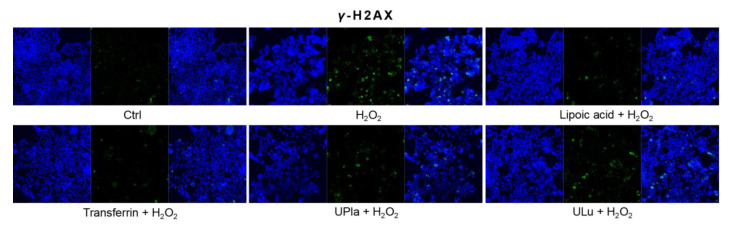
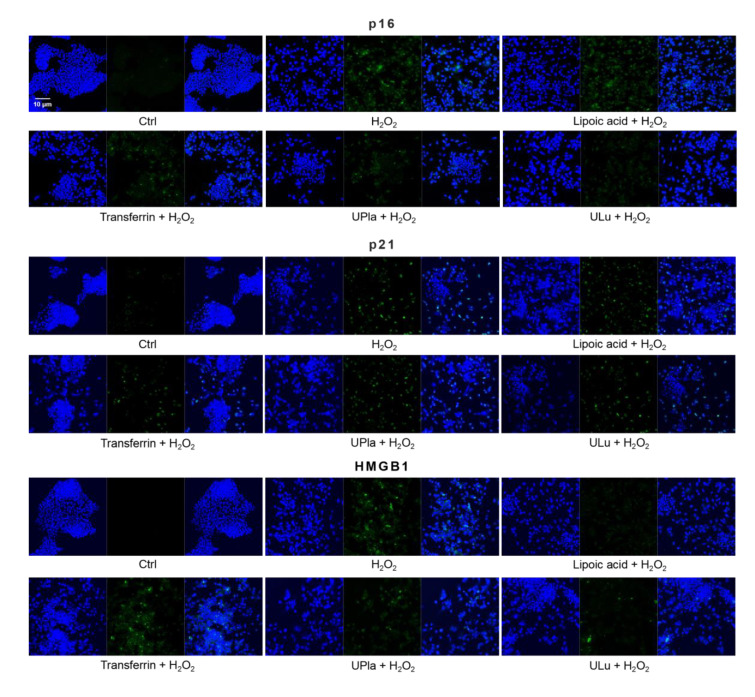
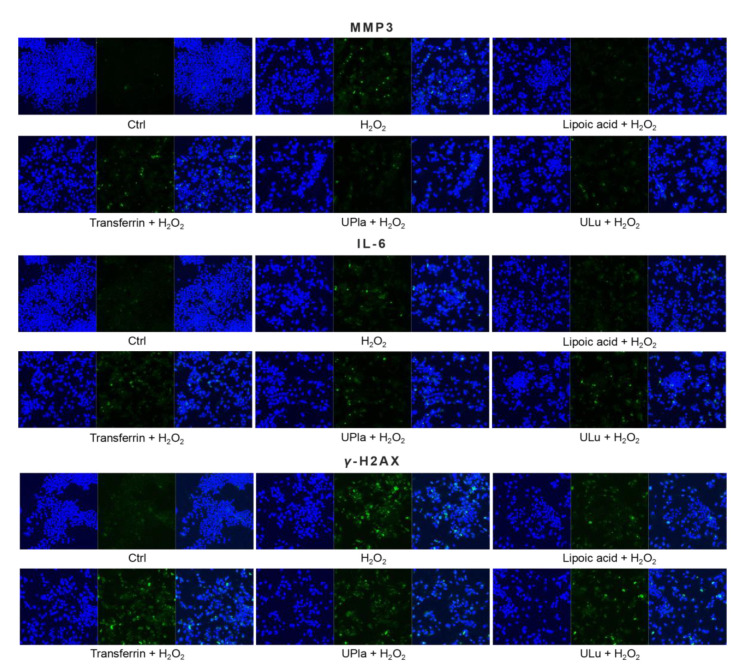
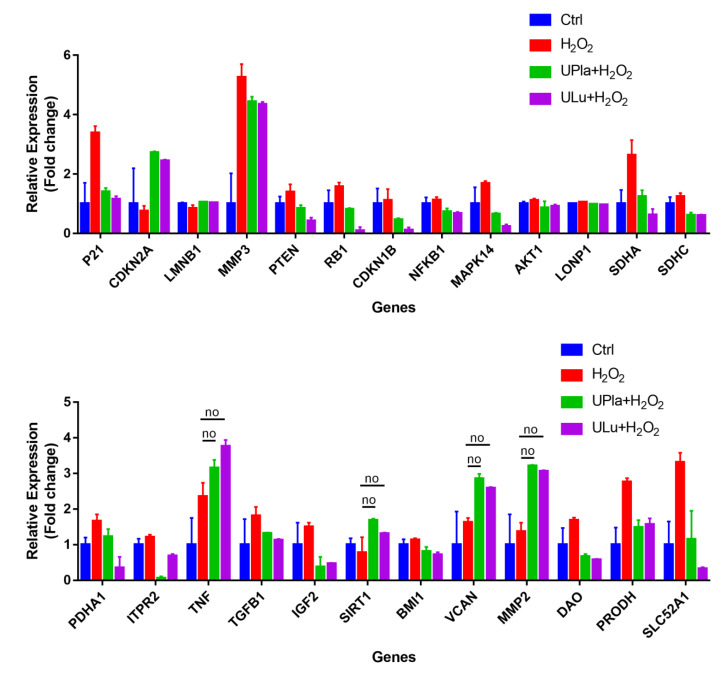
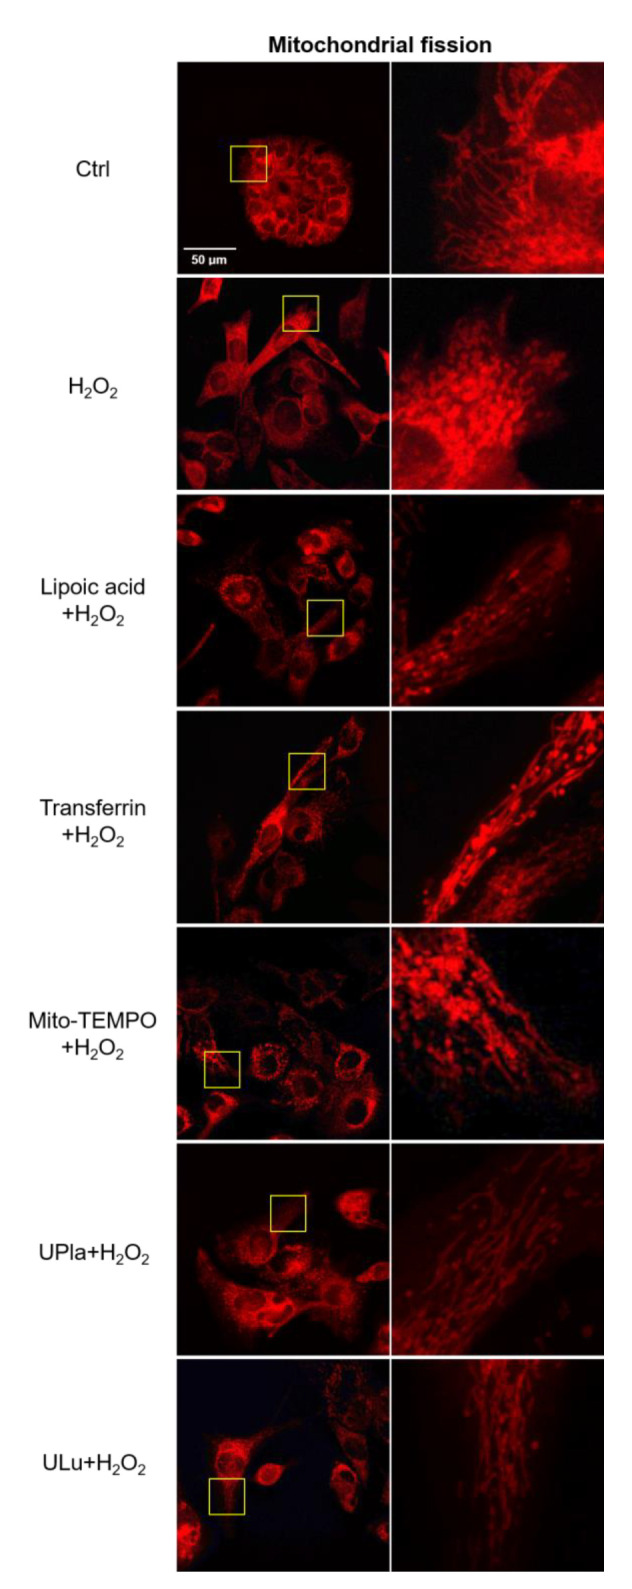
Protein probes, including ultrafiltrates from the placenta (UPla) and lung (ULu) of postnatal rabbits, were investigated in premature senescent HEK293 and HepG2 cells to explore whether they could modulate cellular senescence. Tris-Tricine-PAGE, gene ontology (GO), and LC-MS/MS analysis were applied to describe the characteristics of the ultrafiltrates. HEK293 and HepG2 cells (both under 25 passages) exposed to a sub-toxic concentration of hydrogen peroxide (H2O2, 300 μM) became senescent; UPla (10 μg/mL), ULu (10 μg/mL), as well as positive controls lipoic acid (10 μg/mL) and transferrin (10 μg/mL) were added along with H2O2 to the cells. Cell morphology; cellular proliferation; senescence-associated beta-galactosidase (SA-β-X-gal) activity; expression of senescence biomarkers including p16 INK4A (p16), p21 Waf1/Cip1 (p21), HMGB1, MMP-3, TNF-α, IL-6, lamin B1, and phospho-histone H2A.X (γ-H2AX); senescence-related gene expression; reactive oxygen species (ROS) levels; and mitochondrial fission were examined. Tris-Tricine-PAGE revealed prominent detectable bands between 10 and 100 kDa. LC-MS/MS identified 150-180 proteins and peptides in the protein probes, and GO analysis demonstrated a distinct enrichment of proteins associated with "extracellular space" and "proteasome core complex". UPla and ULu modulated senescent cell morphology, improved cell proliferation, and decreased beta-galactosidase activity, intracellular and mitochondrial ROS production, and mitochondrial fission caused by H2O2. The results from this study demonstrated that UPla and Ulu, as well as lipoic acid and transferrin, could protect HEK293 and HepG2 cells from H2O2-induced oxidative damage via protecting mitochondrial homeostasis and thus have the potential to be explored in anti-aging therapies.

Keywords: SA-β-X-gal; cell proliferation; cellular senescence; intracellular ROS; mitochondrial ROS; mitochondrial fission; senescence marker.


Conflict of interest statement

The authors declare no conflict of interest. Authors affiliated with the European Wellness Academy and European Wellness International were not involved in formal analysis and investigation. The authors have no other relevant affiliations or financial involvement with any organization or entity with a financial interest in or financial conflict with the subject matter or materials discussed in the manuscript apart from those disclosed.

Figures

Figure 1
Figure 1
Ultrafiltrates from placenta and lung samples were analyzed by Tris-Tricine–PAGE with a nominal 1 µg per lane. The result is representative of similar results of three independent experiments.
Figure 2
Figure 2
Matrix with −log10 p-values of significantly identified GO terms for ULu and UPla. Columns indicate the different tissues; rows indicate the GO terms. All GO terms with a p-value < 0.001 were used. Values > 1.3 are significant. Arrows mark important GO terms related to oxidative stress and senescence.
Figure 3
Figure 3
Effect of single substances on H2O2-induced cell morphology in HEK293 (a) and HepG2 cells (b). Normal cells were treated with H2O2 (300 μM) with or without single substances for three days, followed by four days of recovery culture. Afterwards, photos of the cells were taken at the magnification of 400× with a light microscope. The results represent three independent experiments.
Figure 4
Figure 4
Cell proliferation changes in HEK293 (a) and HepG2 (b) cells upon H2O2 treatment and the addition of the substances. The blue color shows DAPI-stained cell nuclei; the green represents Ki67 antibody staining. (a) Cell proliferation was decreased due to H2O2 induction, which was reversed by treatment with UPla, Ulu, and the positive control lipoic acid in HEK293 cells; (b) UPla, Ulu, as well as transferrin reversed the cell proliferation decline in HepG2 cells. The results are representative of three independent experiments.
Figure 5
Figure 5
X-gal staining of the senescent HEK293 (a) and HepG2 cells (c) with or without single-substance treatment and the quantification of positively X-gal-stained HEK293 (b) and HepG2 (d) cells in comparison with the control groups. Cells were photographed at 400× magnification for HEK293 cells and 200× magnification for HepG2 cells. Data are presented as the mean ± SD, N = 3. * p < 0.05 vs. H2O2 treatment. ** p < 0.01, *** p < 0.001, **** p < 0.0001. Ctrl: control.
Figure 5
Figure 5
X-gal staining of the senescent HEK293 (a) and HepG2 cells (c) with or without single-substance treatment and the quantification of positively X-gal-stained HEK293 (b) and HepG2 (d) cells in comparison with the control groups. Cells were photographed at 400× magnification for HEK293 cells and 200× magnification for HepG2 cells. Data are presented as the mean ± SD, N = 3. * p < 0.05 vs. H2O2 treatment. ** p < 0.01, *** p < 0.001, **** p < 0.0001. Ctrl: control.
Figure 6
Figure 6
Intracellular ROS levels were detected by DCFH-DA staining (a), and the integrated fluorescence density was quantified using ImageJ (b). H2O2 raised intracellular ROS levels (green fluorescence), which were reduced by UPla or ULu. Similar effects were observed in the positive control groups with lipoic acid, transferrin, and TUDCA. The results represent similar results of three independent experiments. Values are the mean ± SD, N = 3. * p < 0.05 vs. H2O2 treatment, ** p < 0.01.
Figure 6
Figure 6
Intracellular ROS levels were detected by DCFH-DA staining (a), and the integrated fluorescence density was quantified using ImageJ (b). H2O2 raised intracellular ROS levels (green fluorescence), which were reduced by UPla or ULu. Similar effects were observed in the positive control groups with lipoic acid, transferrin, and TUDCA. The results represent similar results of three independent experiments. Values are the mean ± SD, N = 3. * p < 0.05 vs. H2O2 treatment, ** p < 0.01.
Figure 7
Figure 7
Mitochondrial ROS assessment with mitochondrial dye MitoTracker Green and mitochondrial ROS indicator MitoSox Red, with visualization by confocal microscopy. The results represent similar results of three independent experiments. Mito ROS: mitochondrial ROS.
Figure 8
Figure 8
The expression of senescence markers was monitored by immunofluorescence staining in HEK293 cells upon treatment with H2O2, with or without single substances. Cells incubated with different senescence marker antibodies displayed green fluorescence and the nucleus was stained by DAPI. The results represent similar results from three independent experiments.
Figure 8
Figure 8
The expression of senescence markers was monitored by immunofluorescence staining in HEK293 cells upon treatment with H2O2, with or without single substances. Cells incubated with different senescence marker antibodies displayed green fluorescence and the nucleus was stained by DAPI. The results represent similar results from three independent experiments.
Figure 9
Figure 9
The expression of senescence markers was measured by immunofluorescence staining in HepG2 cells upon treatment with H2O2, with or without single substances. Cells were incubated with different senescence marker antibodies and counterstained by DAPI. The results represent similar results of three independent experiments.
Figure 9
Figure 9
The expression of senescence markers was measured by immunofluorescence staining in HepG2 cells upon treatment with H2O2, with or without single substances. Cells were incubated with different senescence marker antibodies and counterstained by DAPI. The results represent similar results of three independent experiments.
Figure 10
Figure 10
Gene expression profiling of H2O2-induced HepG2 senescence and modulation by UPla and ULu. Except genes labeled with “no”, the expression of all genes was significantly altered by H2O2 and significantly modulated by Upla and Ulu. The results are shown as fold changes to the control groups. The results are expressed as the mean ± SD from three sets of independent samples. Significance was indicated when p < 0.05. No: UPla or ULu did not affect gene expression changes.
Figure 11
Figure 11
Mitochondrial fission was detected with the mitochondrial dye MitoTracker Red and viewed by confocal microscopy. On the right side, the areas in the rectangle (left column) are magnified. Spherical or fragmented mitochondria were regarded as undergoing fission. The images are representative of three independent experiments.

References

    1. Itahana K., Campisi J., Dimri G.P. Mechanisms of cellular senescence in human and mouse cells. Biogerontology. 2004;5:1–10. doi: 10.1023/B:BGEN.0000017682.96395.10. - DOI - PubMed
    1. Campisi J. Cellular senescence: Putting the paradoxes in perspective. Curr. Opin. Genet. Dev. 2011;21:107–112. doi: 10.1016/j.gde.2010.10.005. - DOI - PMC - PubMed
    1. Kuilman T., Michaloglou C., Mooi W.J., Peeper D.S. The essence of senescence. Gene. Dev. 2010;24:2463–2479. doi: 10.1101/gad.1971610. - DOI - PMC - PubMed
    1. Ziegler D.V., Wiley C.D., Velarde M.C. Mitochondrial effectors of cellular senescence: Beyond the free radical theory of aging. Aging Cell. 2015;14:1–7. doi: 10.1111/acel.12287. - DOI - PMC - PubMed
    1. Wang A.S., Dreesen O. Biomarkers of cellular senescence and skin aging. Front. Genet. 2018;9:247. doi: 10.3389/fgene.2018.00247. - DOI - PMC - PubMed