. 2023 Apr 5;24(7):6769.
doi: 10.3390/ijms24076769.

Different Alterations of Hippocampal and Reticulo-Thalamic GABAergic Parvalbumin-Expressing Interneurons Underlie Different States of Unconsciousness

Affiliations

Different Alterations of Hippocampal and Reticulo-Thalamic GABAergic Parvalbumin-Expressing Interneurons Underlie Different States of Unconsciousness

Ljiljana Radovanovic et al. Int J Mol Sci. .

Abstract

We traced the changes in GABAergic parvalbumin (PV)-expressing interneurons of the hippocampus and reticulo-thalamic nucleus (RT) as possible underlying mechanisms of the different local cortical and hippocampal electroencephalographic (EEG) microstructures during the non-rapid-eye movement (NREM) sleep compared with anesthesia-induced unconsciousness by two anesthetics with different main mechanisms of action (ketamine/diazepam versus propofol). After 3 h of recording their sleep, the rats were divided into two experimental groups: one half received ketamine/diazepam anesthesia and the other half received propofol anesthesia. We simultaneously recorded the EEG of the motor cortex and hippocampus during sleep and during 1 h of surgical anesthesia. We performed immunohistochemistry and analyzed the PV and postsynaptic density protein 95 (PSD-95) expression. PV suppression in the hippocampus and at RT underlies the global theta amplitude attenuation and hippocampal gamma augmentation that is a unique feature of ketamine-induced versus propofol-induced unconsciousness and NREM sleep. While PV suppression resulted in an increase in hippocampal PSD-95 expression, there was no imbalance between inhibition and excitation during ketamine/diazepam anesthesia compared with propofol anesthesia in RT. This increased excitation could be a consequence of a lower GABA interneuronal activity and an additional mechanism underlying the unique local EEG microstructure in the hippocampus during ketamine/diazepam anesthesia.

Keywords: EEG microstructure; GABAergic parvalbumin-expressing interneurons; anesthesia; hippocampus; postsynaptic density protein 95 (PSD-95); reticulo-thalamic nucleus; sleep; unconsciousness.


Conflict of interest statement

The authors declare no conflict of interest.

Figures

Figure 1
Figure 1
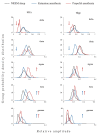
Topography of EEG microstructure during distinct states of unconsciousness. The group probability density distributions (PDE)/30 min of the relative amplitudes of all conventional EEG frequency bands (delta, theta, sigma, beta, and gamma) in the motor cortex (MCx) compared with the hippocampus (Hipp). PDE data for each brain structure and each state of unconsciousness are pooled from all rats belonging to the corresponding experimental group (NREM sleep: MCx n = 12 and Hipp n = 13; ketamine/diazepam anesthesia: MCx n = 6 and Hipp n = 7; propofol anesthesia: MCx: n = 6 and Hipp n = 7). Arrows show the statistically significantly higher (up arrows) or lower (down arrows) amplitude of a particular EEG frequency band in the hippocampus compared with the motor cortex at p ≤ 0.05.
Figure 2
Figure 2
Topography of the EEG microstructure during NREM sleep compared with anesthesia-induced unconsciousness. The group probability density distributions (PDE)/30 min of the relative amplitudes of all conventional EEG frequency bands (delta, theta, sigma, beta, and gamma) of the motor cortex (MCx) and hippocampus (Hipp) during NREM sleep compared with ketamine/diazepam and propofol anesthesia-induced unconsciousness. PDE data for each brain structure and each state of unconsciousness are pooled from all rats belonging to the corresponding experimental group (NREM sleep: MCx n = 12 and Hipp n = 13; ketamine/diazepam anesthesia: MCx n = 6 and Hipp n = 7; propofol anesthesia: MCx n = 6 and Hipp n = 6). Arrows show a statistically significant increase (up arrows) or decrease (down arrows) in the amplitude of a given EEG frequency band in the corresponding experimental group at p ≤ 0.05.
Figure 3
Figure 3
Hippocampal spectrograms during different states of unconsciousness. The individual examples of the total hippocampal spectrograms (the overall 0–50 Hz frequency range) during 15 min of each state of unconsciousness (NREM sleep, ketamine/diazepam, and propofol anesthesia) (A) with their spectrograms for each frequency band (B). The color bar is the same for all spectrograms.
Figure 4
Figure 4
Cortico-hippocampal coherence spectra during different states of unconsciousness. Mean coherence spectra during NREM sleep (n = 12), ketamine/diazepam anesthesia (n = 6), and propofol anesthesia (n = 6). Arrows show a statistically significant increase (up arrows) or decrease (down arrows) in cortico-hippocampal coherence within the specific EEG frequency band in the corresponding experimental group at p ≤ 0.05. While a significant increase in theta synchronization (red arrow) is observed only during propofol anesthesia compared with NREM sleep and ketamine/diazepam anesthesia, there are significant decreases in beta and gamma synchronizations (blue arrows) during ketamine/diazepam anesthesia compared with NREM and propofol anesthesia.
Figure 5
Figure 5
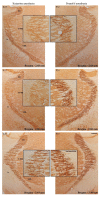
Suppression of PV+ interneurons in the hippocampal DG. (A) Mean number of PV+ interneurons in the hippocampal DG of the ketamine/diazepam-anesthetized rat group (n = 9) versus the propofol-anesthetized rat group (n = 10). (B) Typical individual examples of PV suppression within the hippocampal DG of the rats anesthetized with ketamine/diazepam (K19, K23, and K27) versus those anesthetized with propofol (P32, P34, and P42). Or—oriens layer of the hippocampus; Py—pyramidal cell layer of the hippocampus; Rad—radiatum layer of the hippocampus; LMol—lacunosum moleculare layer of the hippocampus; MolDG—molecular layer of the dentate gyrus; GrDG— granule cell layer of the dentate gyrus; PoDG— polymorph cell layer of the dentate gyrus. Scale bar is 200 µm.
Figure 6
Figure 6
Suppression of PV+ interneurons in the hippocampal CA3 region. (A) Mean number of PV+ interneurons in the hippocampal CA3 of the ketamine/diazepam-anesthetized rat group (n = 9) versus the propofol-anesthetized rat group (n = 10). (B) Typical individual examples of PV suppression within CA3 region of the hippocampus in the ketamine/diazepam (K19, K23, and K27) versus propofol group of rats (P32, P34, and P42) from Figure 5. Or—oriens layer of the hippocampus; Py—pyramidal cell layer of the hippocampus; Rad—radiatum layer of the hippocampus. Scale bar is 100 µm.
Figure 7
Figure 7
Suppression of PV+ interneurons in the reticulo-thalamic nucleus (RT). Typical individual examples of PV suppression within RT in the ketamine/diazepam (K19, K23, and K26) versus propofol group of rats (P32, P34, and P35). Rt—reticular nucleus; VPM—ventral posteromedial thalamic nucleus; VPL—ventral posterolateral thalamic nucleus; ic—internal capsule. The scale bar is 200 µm and for the inserts it is 100 µm.
Figure 8
Figure 8
PSD-95 expression in the DG of the hippocampus. Individual examples of the increased PSD-95 expression in the suprapyramidal granule cell layer of DG during PV suppression in the ketamine/diazepam anesthesia (K19, K21, and K28) versus propofol anesthesia (P31, P34, and P38). MolDG—molecular layer of the dentate gyrus; GrDG—granule cell layer of the dentate gyrus; PoDG—polymorph cell layer of the dentate gyrus. Scale bar is 50 µm and for the inserts it is 16 µm.
Figure 9
Figure 9
PSD-95 expression in RT. Individual examples PSD-95 expression in the RT during ketamine/diazepam anesthesia (K25, K27, and K29) versus propofol anesthesia (P31, P35, and P36). There is no difference in PSD-95 expression. Rt—reticular nucleus; VPM—ventral posteromedial thalamic nucleus; VPL—ventral posterolateral thalamic nucleus; ic—internal capsule. The scale bar is 200 µm and for the inserts 100 µm.

Similar articles

References

    1. Nelson L.E., Guo T.Z., Lu J., Saper C.B., Franks N.P., Maze M. The sedative component of anesthesia is mediated by GABAA receptors in an endogenous sleep pathway. Nature Neurosci. 2002;5:979–984. doi: 10.1038/nn913. - DOI - PubMed
    1. Lydic R., Baghdoyan H.A. Sleep, Anesthesiology, and the Neurobiology of Arousal State Control. Anesthesiology. 2005;103:1268–1295. doi: 10.1097/00000542-200512000-00024. - DOI - PubMed
    1. Franks N.P. General anaesthesia: From molecular targets to neuronal pathways of sleep and arousal. Nature Rev. Neurosci. 2008;9:370–386. doi: 10.1038/nrn2372. - DOI - PubMed
    1. Vanini G., Bassana M., Mast M., Mondino A., Cerda I., Phyle M., Chen V., Colmenero A.V., Hambrecht-Wiedbusch V.S., Mashour G.A. Activation of preoptic GABAergic or glutamatergic neurons modulates sleep-wake architecture but not anesthetic state transitions. Curr. Biol. 2020;30:779–787. doi: 10.1016/j.cub.2019.12.063. - DOI - PMC - PubMed
    1. Date A., Bashir K., Uddin A., Nigam C. Differences between natural sleep and the anesthetic state. Future Sci. OA. 2020;6:FSO664. doi: 10.2144/fsoa-2020-0149. - DOI

LinkOut - more resources