. 2023 Apr 5;24(7):6772.
doi: 10.3390/ijms24076772.

Integrative Analysis of Single-Cell and Bulk Sequencing Data Depicting the Expression and Function of P2ry12 in Microglia Post Ischemia-Reperfusion Injury

Affiliations

Integrative Analysis of Single-Cell and Bulk Sequencing Data Depicting the Expression and Function of P2ry12 in Microglia Post Ischemia-Reperfusion Injury

Chenglong Wang et al. Int J Mol Sci. .

Abstract

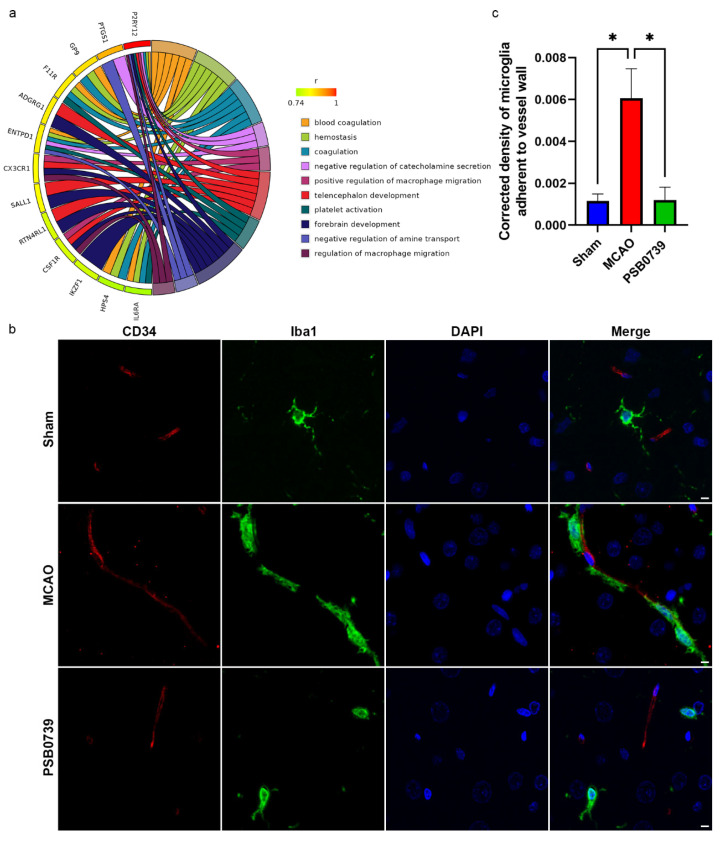
P2ry12 is a microglial marker gene. Recently, increasing evidence has demonstrated that its expression levels can vary in response to different CNS disorders and can affect microglial functions, such as polarization, plasticity, and migration. However, the expression and function of P2ry12 in microglia during ischemia-reperfusion injury (IRI) remain unclear. Here, we developed a computational method to obtain microglia-specific P2ry12 genes (MSPGs) using sequencing data associated with IRI. We evaluated the change in comprehensive expression levels of MSPGs during IRI and compared it to the expression of P2ry12 to determine similarity. Subsequently, the MSPGs were used to explore the P2ry12 functions in microglia through bioinformatics. Moreover, several animal experiments were also conducted to confirm the reliability of the results. The expression of P2ry12 was observed to decrease gradually within 24 h post injury. In response, microglia with reduced P2ry12 expression showed an increase in the expression of one receptor-encoding gene (Flt1) and three ligand-encoding genes (Nampt, Igf1, and Cxcl2). Furthermore, double-labeling immunofluorescence staining revealed that inhibition of P2ry12 blocked microglial migration towards vessels during IRI. Overall, we employ a combined computational and experimental approach to successfully explore P2ry12 expression and function in microglia during IRI.

Keywords: P2ry12; bioinformatics; ischemia–reperfusion injury; microglia.


Conflict of interest statement

The authors declare no conflict of interest.

Figures

Figure 1
Figure 1
Distribution of p2ry12 expression in single-cell transcriptomes of ischemia–reperfusion injury (IRI) in mice. (a,b) t-SNE visualization of single-cell transcriptomes from the transient middle cerebral artery occlusion (tMCAO)and sham control groups in GSE167593 and GSE174574, respectively. (c,d) t-SNE visualization of the transcriptomes of each cell population in GSE167593 and GSE174574, respectively. (e,f) t-SNE visualization of P2ry12 expression in single-cell transcriptomes in GSE167593 and GSE174574, respectively. (g,h) Density plots of pre-imputed and imputed P2ry12 expression in cell populations derived from the tMCAO and sham control groups in GSE167593, respectively. (i,j) Density plots of pre-imputed and imputed P2ry12 expression in cell populations derived from the tMCAO and sham control groups in GSE174574, respectively. LYM, lymphocytes; OLG, oligodendrocytes; MG, microglia; NPC, neural progenitor cells; Mo/Ma, monocytes/macrophages; NC, neurons; AS, astrocytes; GRA, granulocytes; EpC, ependymal cells; EC, endothelial cells; PC, perivascular cells.
Figure 2
Figure 2
Distributions of scores induced by microglia-specific p2ry12 genes (MSPGs) in different cell types in mice. (a) Correlation analysis between each gene in MSPGs and P2ry12. (b,c) The violin plots display the distribution of MSPGs-induced scores calculated by AddModuleScore and AUCell among different cell types in the GSE167593 and GSE174574 datasets, respectively. (d) Correlation heatmap demonstrating a strong correlation between the original MSPGs-induced scores and the recomputed scores using the bootstrap method. r, correlation coefficient; LYM, lymphocytes; OLG, oligodendrocytes; MG, microglia; NPC, neural progenitor cells; Mo/Ma, monocytes/macrophages; NC, neurons; AS, astrocytes; GRA, granulocytes; EpC, ependymal cells; EC, endothelial cells; PC, perivascular cells; AMS, AddModuleScore.
Figure 3
Figure 3
P2ry12 expression decreases during ischemia–reperfusion injury (IRI). (a) Average expression of microglia−specific p2ry12 genes (MSPGs) in mouse datasets associated with IRI. (b) Average expression of MSPGs in rat datasets associated with IRI. (c) Quantitative PCR showing P2ry12 mRNA expression in the normal rat cerebral cortex and ipsilateral ischemic rat cerebral cortex at three different post-reperfusion time points (1 h, 6 h, and 24 h). (d) Representative Western blot images depicting P2ry12 protein expression in the normal rat cerebral cortex and ipsilateral ischemic rat cerebral cortex at 24 h post reperfusion. (e) Quantification of the P2ry12 to β-actin ratio from the Western blot experiment. (f) Quantitative PCR showing P2ry12 mRNA expression in the normal rat cerebral cortex and rat ischemic penumbra at three different post-reperfusion time points (1 h, 6 h, and 24 h). (g) Representative Western blot images depicting P2ry12 protein expression in the normal rat cerebral cortex and rat ischemic penumbra at 24 h post reperfusion. (h) Quantification of the P2ry12 to β-actin ratio from the Western blot experiment. The data are expressed as the mean ± SEM. * p < 0.05, ** p < 0.01, **** p < 0.0001.
Figure 4
Figure 4
Exploring the effect of p2ry12 expression on microglial function during ischemia–reperfusion injury (IRI) using single-cell data in mice. (a,b) Trajectory plots showing that microglial cells along the trajectory reconstructed by microglia−specific p2ry12 genes (MSPGs) are divided into three states in GSE167593 and GSE174574, respectively. (c,d) Projection of MSPGs-induced scores calculated using AddModuleScore onto the trajectory in GSE167593 and GSE174574, respectively. (e,f) Circular bar plots showing the top 15 significantly enriched terms for microglia upregulated genes in each state in GSE167593 and GSE174574, respectively.
Figure 5
Figure 5
Interactions between p2ry12 expression microglial populations and other cortical cell types. (a) Summary illustration of ligand- and receptor-encoding genes unique to low-P2ry12 microglia compared to the high-P2ry12 microglia in the single-cell data. (b) Sankey plot demonstrating the ligand- and receptor-encoding genes unique to low-P2ry12 microglia that remain upregulated in the transient middle cerebral artery occlusion (tMCAO) group in bulk sequencing data. (c) Summary illustration of cell–cell interactions regarding the validated ligand–receptor pairs of low-P2ry12 microglia. MG, microglia; NPC, neural progenitor cells; Mo/Ma, monocytes/macrophages; NC, neurons; GRA, granulocytes; EpC, ependymal cells; PC, perivascular cells. The figure was created with BioRender.
Figure 6
Figure 6
Effects of p2ry12 inhibition on microglial migration during ischemia–reperfusion injury (IRI). (a) The Gene Ontology enrichment analysis of microglia−specific p2ry12 genes (MSPGs) for biological processes is shown in the chord plot. (b) The representative immunofluorescence images of Iba1 and CD34 (×400) illustrate the impact of P2ry12 antagonist PSB0739 on microglial adhesion to blood vessels during IRI compared to the sham group in rats. (c) The quantification of the vessel-adherent microglia to vessel ratio from the immunofluorescence staining indicates the effect of P2ry12 inhibition on microglial migration during IRI. The data are expressed as the mean ± SEM. * p < 0.05 (Dunn’s test). r, correlation coefficient. (Scale bars: 5 μm).

Similar articles

References

    1. Della-Morte D., Guadagni F., Palmirotta R., Testa G., Caso V., Paciaroni M., Abete P., Rengo F., Ferroni P., Sacco R.L., et al. Genetics of ischemic stroke, stroke-related risk factors, stroke precursors and treatments. Pharmacogenomics. 2012;13:595–613. doi: 10.2217/pgs.12.14. - DOI - PubMed
    1. Zhang R.L., Chopp M., Chen H., Garcia J.H. Temporal profile of ischemic tissue damage, neutrophil response, and vascular plugging following permanent and transient (2H) middle cerebral artery occlusion in the rat. J. Neurol. Sci. 1994;125:3–10. doi: 10.1016/0022-510X(94)90234-8. - DOI - PubMed
    1. Pan J., Konstas A.A., Bateman B., Ortolano G.A., Pile-Spellman J. Reperfusion injury following cerebral ischemia: Pathophysiology, MR imaging, and potential therapies. Neuroradiology. 2007;49:93–102. doi: 10.1007/s00234-006-0183-z. - DOI - PMC - PubMed
    1. Salter M.W., Stevens B. Microglia emerge as central players in brain disease. Nat. Med. 2017;23:1018–1027. doi: 10.1038/nm.4397. - DOI - PubMed
    1. Surinkaew P., Sawaddiruk P., Apaijai N., Chattipakorn N., Chattipakorn S.C. Role of microglia under cardiac and cerebral ischemia/reperfusion (I/R) injury. Metab. Brain Dis. 2018;33:1019–1030. doi: 10.1007/s11011-018-0232-4. - DOI - PubMed

LinkOut - more resources