. 2023 Apr 5;24(7):6779.
doi: 10.3390/ijms24076779.

The Immunological Profile of SARS-CoV-2 Infection in Children Is Linked to Clinical Severity and Age

Affiliations

The Immunological Profile of SARS-CoV-2 Infection in Children Is Linked to Clinical Severity and Age

Claudia Vanetti et al. Int J Mol Sci. .

Abstract

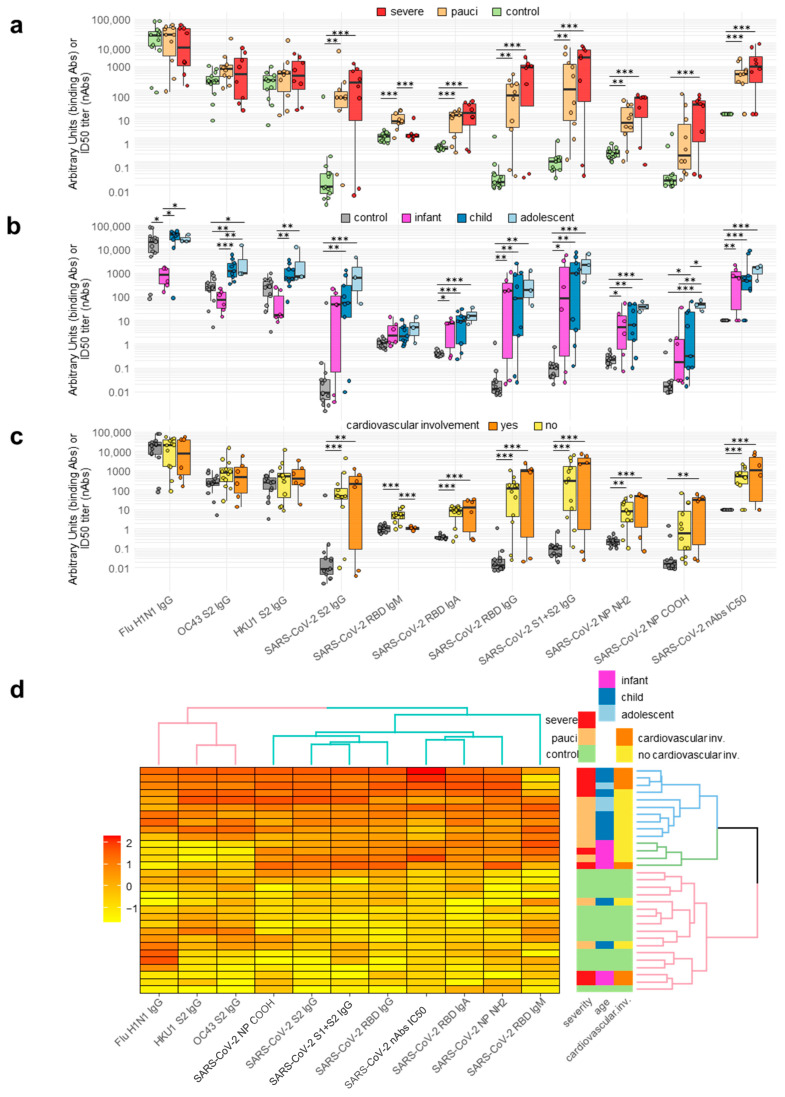
Coronavirus disease 19 (COVID-19) is clinically less severe in children, even if the wide variety and degree of severity of symptoms reported in children pose a still-unresolved challenge for clinicians. We performed an in-depth analysis of the immunological profiles of 18 hospitalized SARS-CoV-2-infected children, whose results were compared to those obtained from 13 age- and sex-matched healthy controls (HC). The patients were categorized as paucisymptomatic/moderate (55.6%) or severe/critical (44.5%) according to established diagnostic criteria and further stratified into the categories of infants (1-12 months), children (1-12 years), and adolescents (>12 years). We assessed SARS-CoV-2-specific RBD antibodies (Ab), neutralizing antibodies (nAb), and circulating cytokines/chemokines in the plasma, and the SARS-CoV-2-specific immune response was measured in PBMCs by gene expression and secretome analyses. Our results showed peculiar circulating cytokine/chemokine profiles among patients sharing a similar clinical phenotype. A cluster of patients consisting of infants with severe symptoms presented hyperinflammatory profiles, together with extremely polarized antibody profiles. In a second cluster consisting of paucisymptomatic patients, a less pronounced increase in the level of inflammatory cytokines, together with an association between the selected cytokines and humoral responses, was observed. A third cluster, again consisting of paucisymptomatic patients, showed a circulating cytokine/chemokine profile which overlapped with that of the HC. The SARS-CoV-2-stimulated production of pro-inflammatory proteins, T lymphocyte activation, and migration-specific proteins, were significantly increased in SARS-CoV-2-infected children compared to the HC. Our findings suggest that immune response activation in the course of SARS-CoV-2 infection in children is directly correlated with clinical severity and, to a lesser extent, age.

Keywords: COVID-19; SARS-CoV-2 infection; children; immune response.


Conflict of interest statement

The authors declare no conflict of interest.

Figures

Figure 1
Figure 1
Antibody responses to pediatric COVID-19. Circles correspond to each subject’s antibody levels, expressed as arbitrary units for binding antibodies or IC50 titer for neutralizing antibodies. Value distributions are summarized as boxplots showing the median and interquartile range with whiskers extending to ±1.96-fold the median. (Panel (a)): Antibody levels in healthy controls (n = 13) and patients stratified by disease severity as paucisymptomatic/moderate (pauci, n = 10) and severe/critical (severe, n = 8). (Panel (b)): Antibody levels in patients stratified by age as infants (≤1 year, n = 6), children (1–12 years, n = 9), and adolescents (>12 years, n = 3). (Panel (c)): Antibody levels in patients stratified by presence (n = 6) or absence (n = 12) of cardiovascular involvement. (Panel (d)): Heatmap of antibody levels in study subjects, expressed using linear regression upon log transformation of the data and the clustering of patients (right panel) according to antibody levels. Significant differences between groups are indicated by asterisks (ANOVA post hoc Tukey HSD test, p values adjusted for multiple comparisons, *** p < 0.001, ** p < 0.01, * p < 0.05).
Figure 2
Figure 2
Plasma cytokine/chemokine levels in pediatric COVID-19 patients. (Panel (a)): Heatmap of cytokine/chemokine levels in study subjects expressed using linear regression upon log transformation of the data and clustering (right panel) of the patients according to cytokine/chemokine plasma levels. (Panel (b)): Antibody levels in patient groups derived from the clustering in (panel (a)). Panel (c): Cytokine/chemokine plasma levels in patient groups derived from the clustering in (panel (a)). In (panel (b,c)), circles correspond to each subject’s antibody levels or cytokine/chemokine plasma concentration. Value distributions are summarized as boxplots showing the median and interquartile range with whiskers extending to ±1.96-fold the median. Significant differences between groups are indicated by asterisks (ANOVA post hoc Tukey HSD test, p values adjusted for multiple comparisons, *** p < 0.001, ** p < 0.01, * p < 0.05.
Figure 3
Figure 3
Cytokine and chemokine secretion by PBMCs upon SARS-CoV-2-antigen-specific stimulation. For each indicated cytokine or chemokine, results are shown for the control and patient secretions using unstimulated or SARS-CoV-2-stimulated PBMCs. Circles correspond to the levels of cytokines/chemokines secreted by the PBMCs of each subject. The value distributions are summarized as boxplots showing the median and interquartile range with whiskers extending to ±1.96-fold the median. Significant differences between patient and control or unstimulated vs. stimulated secretions are indicated by asterisks (post hoc Tukey HSD test after repeated-measure ANOVA, p adjusted, *** p < 0.001, ** p < 0.01, * p < 0.05).
Figure 4
Figure 4
SARS-CoV-2-specific gene expression in PBMCs upon SARS-CoV-2-antigen-specific stimulation. Heatmap of gene expression levels in study subjects expressed using linear regression upon log transformation of the data and clustering (right panel) of the patients according to gene expression levels in the control and patient unstimulated (Panel (a)) or SARS-CoV-2-stimulated PBMCs (Panel (b)).

References

    1. Viner R.M., Mytton O.T., Bonell C., Melendez-Torres G.J., Ward J., Hudson L., Waddington C., Thomas J., Russell S., van der Klis F., et al. Susceptibility to SARS-CoV-2 Infection Among Children and Adolescents Compared with Adults: A Systematic Review and Meta-Analysis. JAMA Pediatr. 2021;175:143–156. doi: 10.1001/jamapediatrics.2020.4573. - DOI - PMC - PubMed
    1. Sharma C., Ganigara M., Galeotti C., Burns J., Berganza F.M., Hayes D.A., Singh-Grewal D., Bharath S., Sajjan S., Bayry J. Multisystem Inflammatory Syndrome in Children and Kawasaki Disease: A Critical Comparison. Nat. Rev. Rheumatol. 2021;17:731–748. doi: 10.1038/s41584-021-00709-9. - DOI - PMC - PubMed
    1. Patel J.M. Multisystem Inflammatory Syndrome in Children (MIS-C) Curr. Allergy Asthma Rep. 2022;22:53–60. doi: 10.1007/s11882-022-01031-4. - DOI - PMC - PubMed
    1. Zimmermann P., Curtis N. Why Is COVID-19 Less Severe in Children? A Review of the Proposed Mechanisms Underlying the Age-Related Difference in Severity of SARS-CoV-2 Infections. Arch. Dis. Child. 2021;106:429–439. doi: 10.1136/archdischild-2020-320338. - DOI - PubMed
    1. Brodin P. SARS-CoV-2 Infections in Children: Understanding Diverse Outcomes. Immunity. 2022;55:201–209. doi: 10.1016/j.immuni.2022.01.014. - DOI - PMC - PubMed