. 2023 Apr 6;24(7):6828.
doi: 10.3390/ijms24076828.

The Geroprotective Drug Candidate CMS121 Alleviates Diabetes, Liver Inflammation, and Renal Damage in db/db Leptin Receptor Deficient Mice

Affiliations

The Geroprotective Drug Candidate CMS121 Alleviates Diabetes, Liver Inflammation, and Renal Damage in db/db Leptin Receptor Deficient Mice

Saadia Zahid et al. Int J Mol Sci. .

Abstract

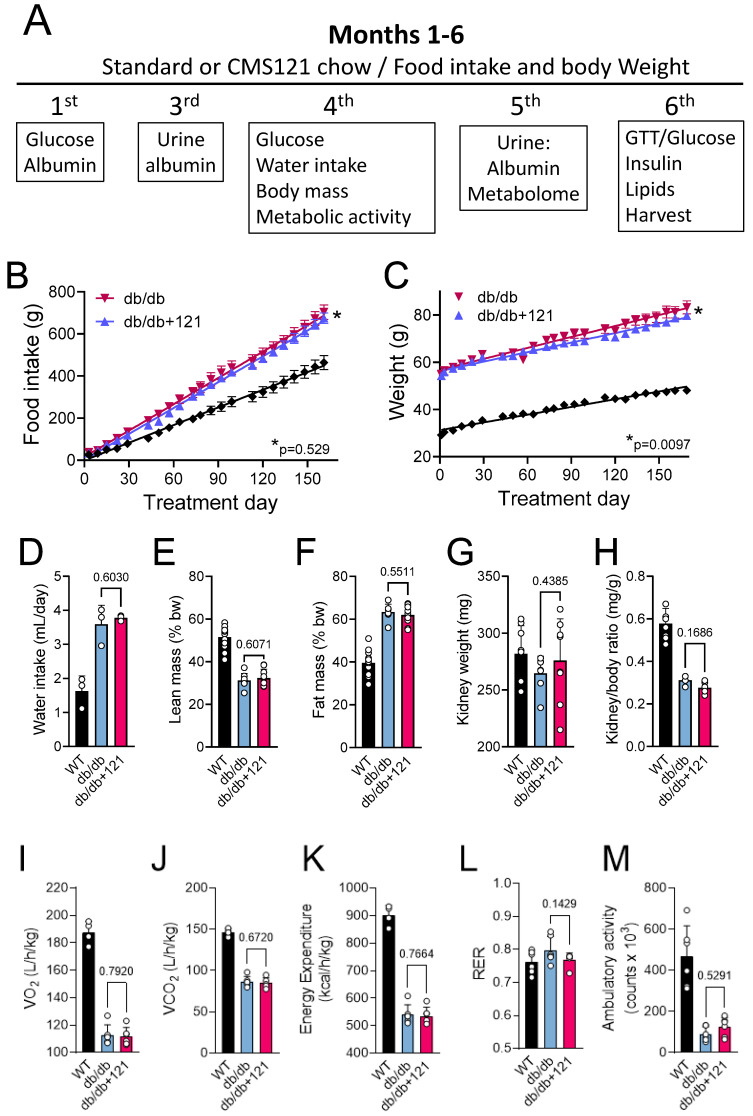
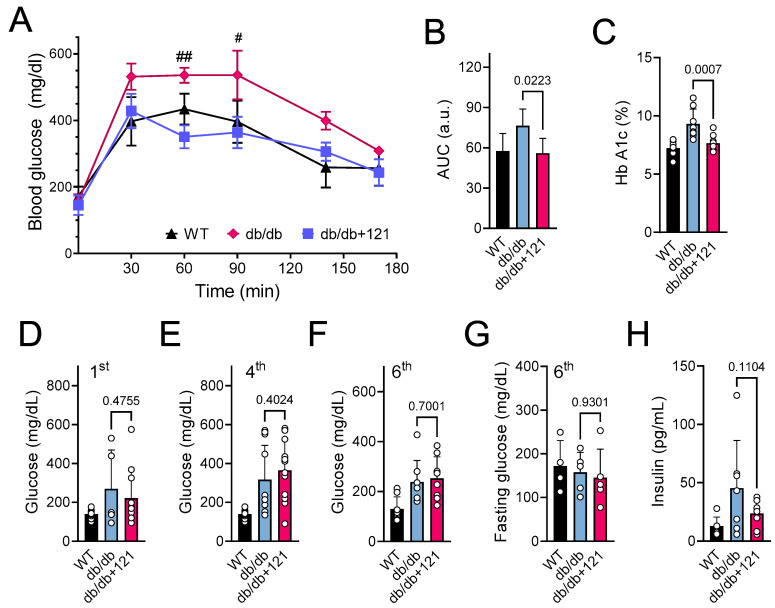
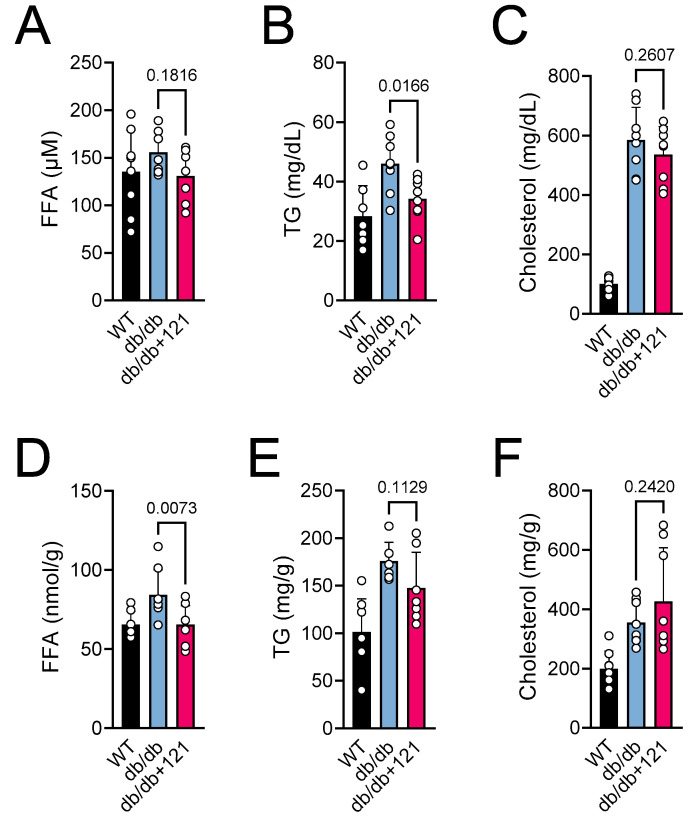
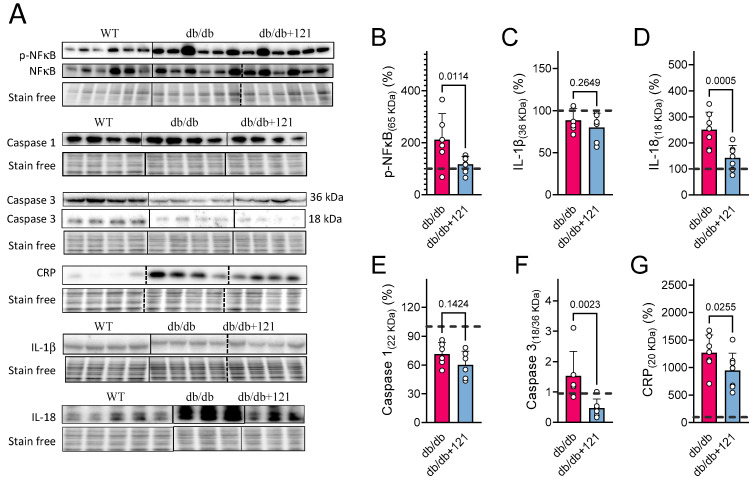
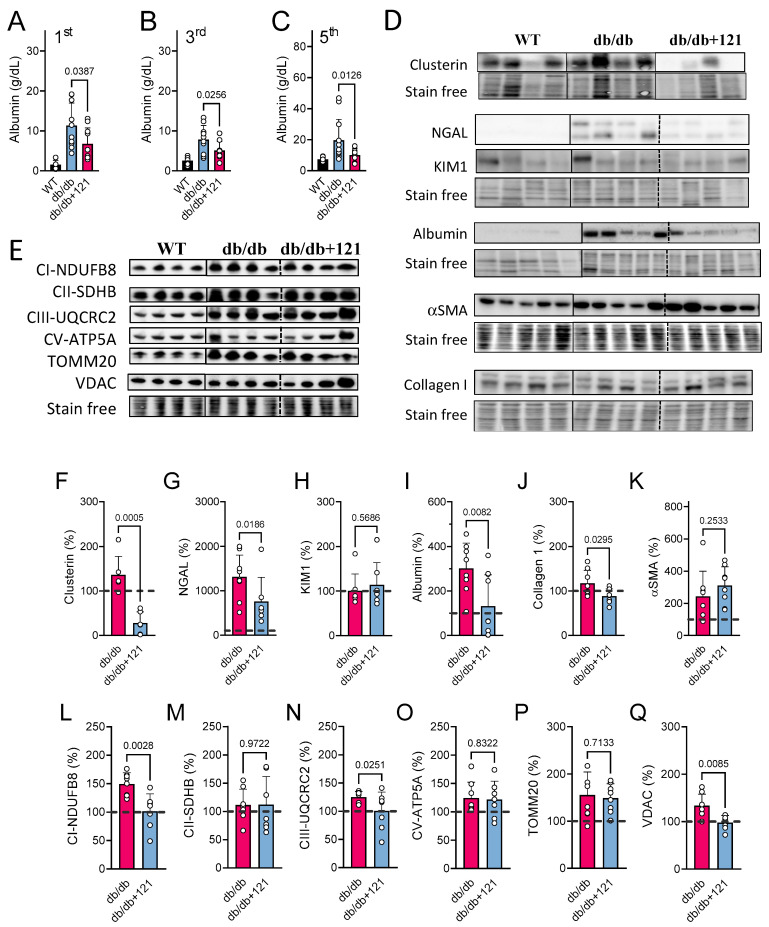
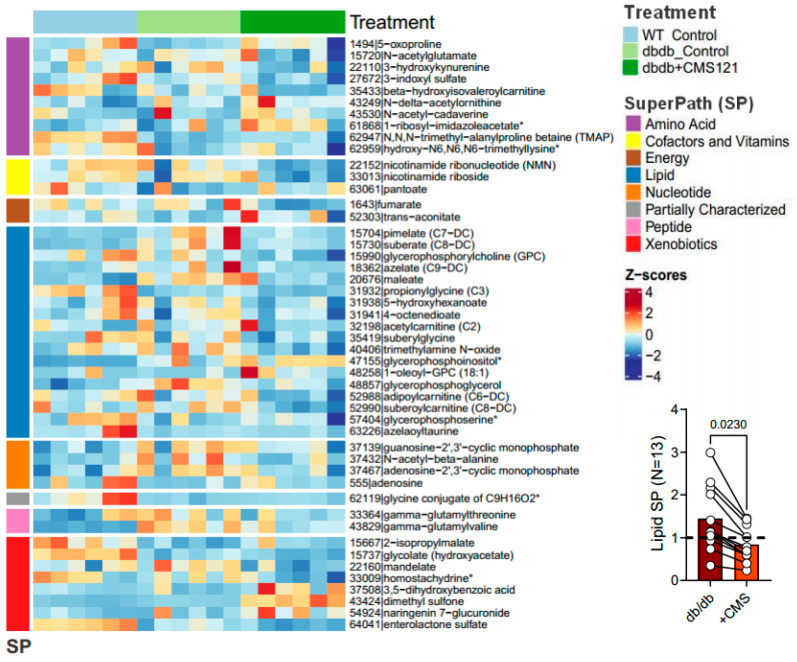
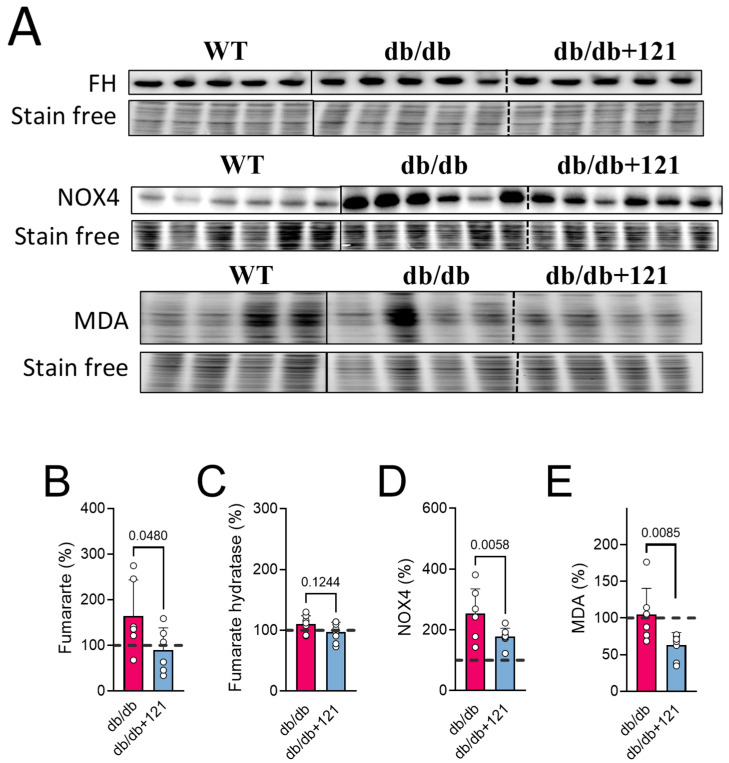
db/db mice, which lack leptin receptors and exhibit hyperphagia, show disturbances in energy metabolism and are a model of obesity and type 2 diabetes. The geroneuroprotector drug candidate CMS121 has been shown to be effective in animal models of Alzheimer's disease and aging through the modulation of metabolism. Thus, the hypothesis was that CMS121 could protect db/db mice from metabolic defects and thereby reduce liver inflammation and kidney damage. The mice were treated with CMS121 in their diet for 6 months. No changes were observed in food and oxygen consumption, body mass, or locomotor activity compared to control db/db mice, but a 5% reduction in body weight was noted. Improved glucose tolerance and reduced HbA1c and insulin levels were also seen. Blood and liver triglycerides and free fatty acids decreased. Improved metabolism was supported by lower levels of fatty acid metabolites in the urine. Markers of liver inflammation, including NF-κB, IL-18, caspase 3, and C reactive protein, were lowered by the CMS121 treatment. Urine markers of kidney damage were improved, as evidenced by lower urinary levels of NGAL, clusterin, and albumin. Urine metabolomics studies provided further evidence for kidney protection. Mitochondrial protein markers were elevated in db/db mice, but CMS121 restored the renal levels of NDUFB8, UQCRC2, and VDAC. Overall, long-term CMS121 treatment alleviated metabolic imbalances, liver inflammation, and reduced markers of kidney damage. Thus, this study provides promising evidence for the potential therapeutic use of CMS121 in treating metabolic disorders.

Keywords: Alzheimer’s disease; geroneuroprotector; inflammation; kidney damage; metabolic disorders; obesity.


Conflict of interest statement

The authors declare no conflict of interest.

Figures

Figure 1
Figure 1
Experimental timeline and nutritional parameters, body mass, locomotor activity, and metabolic activity of db/db mice fed a control diet or a diet containing the AD drug candidate CMS121 for 6 months. Beginning at the 5th week after birth, mice were either kept on the control diet (db/db) or on a diet containing CMS121 (db/db + 121) ad libitum (See M&M for details). (A) Timeline and end points analyzed. Wildtype (WT) mouse data are presented as a reference. Cumulative food intake (B) and body weight (C). Food intake per animal was based on the food consumption in cages containing 3 mice. Data (B,C) are presented as average ± SEM (n = 8–12). Differences between linear regression slopes of control and CMS121-treated db/db mice were analyzed, and the p-values are indicated. During the 13th and 15th weeks, respectively, treatment, water intake (n = 3), and body mass (n = 8–9) indexes were obtained: (D) water intake; (E) lean mass, and (F) fat mass. Kidney weight (G), and kidney/body weight ratio (H) data were obtained from 7–8 animals per group at the end of the experiment. Metabolic activity ((IM), n = 6) was evaluated at the 15th week of treatment. (I) Oxygen consumption (VO2); (J) carbon dioxide production (VCO2); (K) energy expenditure; (L) respiratory exchange rate (RER); and (M) overall ambulatory activity. Data (DM) are presented as mean ± SD, and p-values are indicated for the untreated control db/db mice as compared to the CMS121-treated mice. Values of the WT group are presented as a reference. One-way ANOVA was used to detect mean changes, and differences between db/db and db/db + 121 were evaluated by the Holm–Sidak post-hoc test.
Figure 2
Figure 2
Glucose status in db/db mice that were untreated or treated with CMS121 for 6 months. (A) Glucose tolerance test (GTT, n = 4–5) and (B) area under the curve (AUC) were obtained at the 6th month of treatment. (C) At the end of the experiment, blood was collected for the measurement of hemoglobin A1c (HbA1c; n = 8–9). Glucose was evaluated by caudal vein puncture (n = 11–12) after the 1st (D), 4th (E), and 6th ((F), n = 8) month of treatment. Fasting glucose was also evaluated in animals at 6 months of treatment ((G), n = 4–5). (H) Insulin levels were evaluated at the end of the treatment (n = 6–8). Data are presented as mean ± SD, except for GTT (mean ± SEM). p-values are indicated for the untreated control db/db mice compared to the CMS121-treated mice. Values of WT mice are presented as a reference. For the GTT (A), two-way ANOVA was used followed by the Bonferroni post-hoc test for multiple comparison analysis. One-way ANOVA was used to detect mean changes, and differences between db/db and db/db + 121 were evaluated by the Holm–Sidak post-hoc test (BH). # p < 0.05 and ## p < 0.01 as compared to WT at the same timepoint.
Figure 3
Figure 3
Blood and liver lipids of db/db mice fed control diet or a diet containing CMS121. (A,D) Free fatty acids (FFA), (B,E) triglycerides (TG), and (C,F) cholesterol were evaluated in plasma (AC) and liver (DF) at the end of the treatment. Data are presented as mean ± SD (n = 7–8). p-values are indicated for the untreated db/db mice compared to the CMS121-treated mice. Values of WT mice are presented as a reference. One-way ANOVA was used to detect mean changes, and differences between db/db and db/db + 121 were evaluated by the Holm–Sidak post-hoc test.
Figure 4
Figure 4
Liver inflammatory markers in db/db mice fed control diet or diet with CMS121. Representative blot images (A). Vertical lines indicate non-adjacent lanes from the same blot, and dashed lines adjacent groups. (BG) Respective quantification of blots: (B) p-NF-κB; (C) IL-1β; (D) IL-18; (E) Caspase 1; (F) Caspase 3 (cleaved/uncleaved), and (G) C-reactive protein (CRP). Data are presented as mean ± SD (n = 6–8), and p-values are indicated for the untreated control db/db mice compared to the CMS121-treated mice. Values were normalized to WT group (dashed line), and data are presented as percentages of WT values. One-way ANOVA was used to detect mean changes, and differences between db/db and db/db + 121 were evaluated by the Holm–Sidak post-hoc test.
Figure 5
Figure 5
Kidney markers were evaluated in db/db mice fed with CMS121. Urinary albumin levels (AC) were evaluated at the 1st, 3rd, and 5th treatment months. Values of control mice (WT) are presented as a reference. Representative blot images of kidney damage markers are presented (D) along their respective quantifications: (F) clusterin; (G) NGAL; (H) KIM1; (I) albumin, (J) collagen; (K) α-smooth muscle actin (αSMA). Data are presented as mean ± SD (n = 8–12). Representative blot image (E) of kidney mitochondrial proteins and their respective quantifications: markers of mitochondrial complex I ((L); NDUFB8), complex II ((M); SDHB), complex III ((N); UQCRC2), and complex V ((O); ATP5A), as well as the outer membrane translocase TOMM20 (P), and the voltage-dependent anion channel VDAC (Q). Vertical lines indicate non-adjacent lanes from the same blot, and dashed lines adjacent groups. Data are presented as mean ± SD (n = 6–8). p-values are indicated for the untreated db/db mice as compared to the CMS121-treated mice. Values were normalized to WT group (dashed line), and data are presented as percentages of WT values. One-way ANOVA was used to detect mean changes, and differences between db/db and db/db + 121 were evaluated by the Holm–Sidak post-hoc test.
Figure 6
Figure 6
Heatmap of the Z-scores of CMS121-induced changes in control and CMS-treated db/db mouse urine metabolites. Graph insert depicts the metabolites related to fatty acid metabolism that were altered by the diet. The glycine conjugate (C9H16O2) is a partially characterized molecule and was not considered in the analysis. * Indicates compounds that have not been confirmed based on a standard, but mass spectra data was appropriate to reveal its identity.
Figure 7
Figure 7
NOX4, MDA, and fumarate are modulated by the CMS121 diet. (A) Representative blot images of kidney extracts and their quantification: (C) fumarate hydratase (FH), (D) NOX4, and (E) MDA. (B) Fumarate levels in urine obtained from the metabolomic study (Figure 6). Vertical lines indicate non-adjacent lanes from the same blot, and dashed lines adjacent groups. Data are presented as mean ± SD (n = 6–8). p-values are indicated for the untreated db/db mice compared to the CMS121-treated mice. Values were normalized to WT group (dashed line), and data are presented as percentages of WT values. One-way ANOVA was used to detect mean changes, and differences between db/db and db/db + 121 were evaluated by the Holm–Sidak post-hoc test.

Similar articles

Cited by

References

    1. WHO World Health Organization Screening for Type 2 Diabetes: Report of a World Health Organization and International Diabetes Federation Meeting. [(accessed on 5 January 2023)];2003 Available online: http://www.who.int/diabetes/publications/en/screening_mnc03.pdf.
    1. Jiang Z., Wang Y., Zhao X., Cui H., Han M., Ren X., Gang X., Wang G. Obesity and Chronic Kidney Disease. Am. J. Physiol.-Endocrinol. Metab. 2023;324:E24–E41. doi: 10.1152/ajpendo.00179.2022. - DOI - PubMed
    1. Wallace A.S., Chang A.R., Shin J.-I., Reider J., Echouffo-Tcheugui J.B., Grams M.E., Selvin E. Obesity and Chronic Kidney Disease in US Adults with Type 1 and Type 2 Diabetes Mellitus. J. Clin. Endocrinol. Metab. 2022;107:1247–1256. doi: 10.1210/clinem/dgab927. - DOI - PMC - PubMed
    1. Jangra V., Tople J. Can Alzheimer’s Disease Be Secondary to Type-2 Diabetes Mellitus? Cureus. 2022;14:e31273. doi: 10.7759/cureus.31273. - DOI - PMC - PubMed
    1. Onaolapo A.Y., Ojo F.O., Adeleye O.O., Falade J., Onaolapo O.J. Diabetes Mellitus and Energy Dysmetabolism in Alzheimer’s Disease: Understanding the Relationships and Potential Therapeutic Targets. Curr. Diabetes Rev. 2023;19:e020123212333. doi: 10.2174/1573399819666230102141154. - DOI - PubMed