. 2023 Mar 24;12(7):994.
doi: 10.3390/cells12070994.

Modeling the Effects of Cypermethrin Toxicity on Ovalbumin-Induced Allergic Pneumonitis Rats: Macrophage Phenotype Differentiation and p38/STAT6 Signaling Are Candidate Targets of Pirfenidone Treatment

Affiliations

Modeling the Effects of Cypermethrin Toxicity on Ovalbumin-Induced Allergic Pneumonitis Rats: Macrophage Phenotype Differentiation and p38/STAT6 Signaling Are Candidate Targets of Pirfenidone Treatment

Ahmed A Morsi et al. Cells. .

Abstract

Although the classic form of asthma is characterized by chronic pneumonitis with eosinophil infiltration and steroid responsivity, asthma has multifactorial pathogenesis and various clinical phenotypes. Previous studies strongly suggested that chemical exposure could influence the severity and course of asthma and reduce its steroid responsiveness. Cypermethrin (CYP), a common pesticide used in agriculture, was investigated for the possible aggravation of the ovalbumin (OVA)-induced allergic pneumonitis and the possible induction of steroid resistance in rats. Additionally, it was investigated whether pirfenidone (PFD) could substitute dexamethasone, as an alternative treatment option, for the induced steroid resistance. Fifty-six male Wistar albino rats were randomly divided into seven groups: control, PFD alone, allergic pneumonitis, CYP alone, allergic pneumonitis/CYP-exposed, allergic pneumonitis/CYP/dexamethasone (Dex), and allergic pneumonitis/CYP/PFD-treated groups. Allergic pneumonitis was induced by three intraperitoneal OVA injections administered once a week, followed by an intranasal OVA instillation challenge. CYP (25 mg/kg/d), Dex (1 mg/kg/d), and PFD (100 mg/kg/d) were administered orally from day 15 to the end of the experiment. Bronchoalveolar lavage fluid (BALF) was analyzed for cytokine levels. Hematoxylin and eosin (H&E) and periodic acid Schiff (PAS)-stained lung sections were prepared. Immunohistochemical identification of p38 MAPK and lung macrophages was performed. The inflammatory/oxidative status of the lung and PCR-quantification of the STAT6, p38 MAPK, MUC5AC, and IL-13 genes were carried out. The allergic pneumonitis-only group showed eosinophil-mediated inflammation (p < 0.05). Further CYP exposure aggravated lung inflammation and showed steroid-resistant changes, p38 activation, neutrophil-mediated, M1 macrophage-related inflammation (p < 0.05). All changes were reversed (p < 0.05) by PFD, meanwhile not by dexamethasone treatment. Pirfenidone could replace dexamethasone treatment in the current rat model of CYP-induced severe steroid-resistant asthma via inhibiting the M1 macrophage differentiation through modulation of the STAT6/p38 MAPK pathway.

Keywords: CD86/CD206 immunohistochemistry; Th2/Th1 inflammation; asthma exacerbation; environmental triggers; p38/STAT6.


Conflict of interest statement

The authors declare no conflict of interest.

Figures

Figure 1
Figure 1
Diagrammatic representation of the different timepoints of the current experiment. i.p.: intraperitoneal, i.n.: intranasal, OVA: ovalbumin, CYP: cypermethrin, PFD: pirfenidone, Dex: dexamethasone.
Figure 2
Figure 2
The effect of pirfenidone on the gene expression profile of IL-13 (a), MUC5AC (b), p38 (c), and STAT6 (d) genes determined by PCR in the CYP-exposed allergic rats at the end of the experiment. The data are shown as mean ± SD, n = 5 lung tissue samples. Horizontal lines indicate the statistical significance and the p-value between groups using one-way ANOVA (Tukey’s post hoc test). ns: nonsignificant.
Figure 3
Figure 3
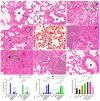
Photomicrographs of H&E-stained lung sections of the study groups. (a,b) control and pirfenidone alone-treated groups, respectively, show normal histological structure of the lungs. Alveoli (asterisks) are lined by thin type I (arrows) and thick type II (arrowheads) pneumocytes. Thin interalveolar septa are seen containing blood capillaries (zigzag arrows). Bronchioles (star) are lined by columnar cells (curved arrow) with thin underlying smooth muscle layers (arrow with tails). (c,d) Allergic pneumonitis group shows narrowed alveoli (asterisks) and thick interalveolar septa (S) infiltered by mononuclear inflammatory cells (circle), mainly eosinophils (arrows). Interalveolar edema (dollar sign) and massive interalveolar eosinophil infiltration (arrows) are prominent. Many alveoli are distorted with hypertrophic cell lining (arrowheads). Intra-alveolar red blood cells (RBCs) and vascular congestion are evident. The bronchioles show a thickened smooth muscle layer (arrows with tail), eosinophil infiltration (arrow), and hypertrophied folded epithelium with goblet cells (curved arrows). Detached cells and luminal mucous accumulation (D) are seen. (e) CYP-exposed group shows distorted alveoli (asterisks) with disorganized epithelial lining (arrowheads). Dilated blood vessels (BV) and diffuse vascular congestion (zigzag arrows) with extravasated blood cells are also seen. (f,g) Allergic/CYP-exposed group shows hypertrophic, highly folded bronchiolar epithelium with numerous goblet cells (curved arrows). Mucous (S) is accumulated intra-bronchiolar. The bronchiolar smooth muscle layer is thick (arrow with tail). Extensive mononuclear cellular accumulation is seen peribronchiolar (circle). The alveoli appear with obliterated lumina and show neutrophil infiltration (arrows) and congested capillaries (zigzag arrows). (h) Allergic/CYP/Dex-treated group shows the persistence of the cellular infiltration (circle) and goblet cell hyperplasia (curved arrows). (i) Allergic/CYP/PFD-treated group shows remarkable improvement of alveoli (asterisk), interalveolar septa (S), and bronchiolar (star) structures with the resolve of the edema and inflammation. (jl) representative figures of the mean eosinophil number (EN), neutrophil number (NN), and alveolar wall thickness, respectively, n = 5. The significant difference and the p-value are shown between the group using post hoc Tukey’s test, one-way ANOVA. ns: nonsignificant. Scale bar: 50 µm (a,i); 25 µm (bh).
Figure 4
Figure 4
Photomicrographs of PAS-stained lung sections of the study groups. The PAS-positive goblets cells (arrowheads) appear as an intense magenta-red reaction among the bronchiolar (stars) epithelium. (a,b) control and PFD alone-treated groups, respectively, show negative PAS reactions. (c) The allergic pneumonitis group shows numerous PAS-positive goblet cells scattered among the bronchiolar epithelium. (d) CYP-exposed group shows scarce PAS-positive goblet cells. (e) The allergic/CYP-exposed group shows extensively distributed PAS-reacted goblet cells intervening the epithelial lining. (f) The allergic/CYP/Dex-treated group shows persistent numerous PAS-stained goblet cells. (g) The allergic/CYP/PFD-treated group shows very few PAS-positive goblet cells. (h) Representative figure of the mean goblet cell number per bronchiole in the studied groups at the end of the experiment, n = 5. The significant difference and the p-value are shown between the group using post hoc Tukey’s test, one-way ANOVA. ns: nonsignificant. Scale bar: 50 µm (ag).
Figure 5
Figure 5
Anti-p38MAPK immunoassay lung sections of the study groups. (a,b) control and PFD alone-treated groups, respectively, show negative immunoreaction. (c) Allergic pneumonitis group shows p38 positive alveolar lining cells (arrow) and interstitial macrophages (zigzag arrows). (d) CYP-exposed group shows few p38 positive alveolar cells (arrows). (e,f) Allergic/CYP-exposed group shows extensive distribution of p38 immunopositivity staining the alveolar (arrows), bronchial lining cells (arrowheads), and interstitial macrophages. (g) Allergic/CYP/Dex-treated group shows the persistence of the p38 +ve alveolar (arrows) and bronchial cells (arrowheads), in addition to macrophages (zigzag arrow). (h) Allergic/CYP/PFD-treated group shows very few positive alveolar cells (arrows). (i) Representative figure of the mean area percentage of p38 immunopositivity among the study groups at the end of the experiment, n = 5. The significant difference and the p-value are shown using post hoc Tukey’s test, one-way ANOVA. ns: nonsignificant. Scale bar: 25 µm (ah).
Figure 6
Figure 6
Immunoassay CD86 (ag) and CD206 (hn) stained serial lung sections showing the dominant macrophage phenotype in the corresponding areas of interest of each study group. (a,h) control and (b,i) PFD alone-treated groups show negative immunoreaction for both CDs markers. (c,j) Allergic pneumonitis group shows CD206-positive M2 macrophages (j) relatively numerous to the CD86-positive M1 cells. (d,k) CYP-exposed group shows multiple CD86-positive M1 macrophages (d) and scarce CD206-positive M2 macrophages (k). (e,l) Allergic/CYP-exposed group and (f,m) allergic/CYP/dexamethasone-treated group show numerous M1 and M2 macrophages with the predominance of the M1 phenotype (CD86 + ve cells). (g,h) Allergic/CYP/PFD-treated group shows very few positive M1 (g) and M2 (h) phenotype macrophages. (o,p) representative figures of the mean number of the peribronchial (o) and parenchymal (p) CD86 and CD206 +ve macrophages at the end of the experiment, n = 5. Regarding CD86 immunopositivity, (a) significant versus control (p < 0.001). (b) significant versus allergic pneumonitis group (p < 0.001). (c) significant versus allergic/CYP-exposed group (p < 0.001). The capital letter refers to the comparison between groups regarding the CD206. The horizontal lines indicate the statistical significance and the p-value between M1 and M2 distribution within the same group using post hoc Tukey’s two-way ANOVA. Scale bar: 50 µm (an).

Similar articles

Cited by

References

    1. Ali R., Ahmed N., Salman M., Daudpota S., Masroor M., Nasir M. Assessment of Quality of Life in Bronchial Asthma Patients. Cureus. 2020;12:e10845. doi: 10.7759/cureus.10845. - DOI - PMC - PubMed
    1. Rahbarghazi R., Keyhanmanesh R., Aslani M.R., Hassanpour M., Ahmadi M. Bone Marrow Mesenchymal Stem Cells and Condition Media Diminish Inflammatory Adhesion Molecules of Pulmonary Endothelial Cells in an Ovalbumin-Induced Asthmatic Rat Model. Microvasc. Res. 2019;121:63–70. doi: 10.1016/j.mvr.2018.10.005. - DOI - PubMed
    1. Zhang X., Xu Z., Wen X., Huang G., Nian S., Li L., Guo X., Ye Y., Yuan Q. The Onset, Development and Pathogenesis of Severe Neutrophilic Asthma. Immunol. Cell Biol. 2022;100:144–159. doi: 10.1111/imcb.12522. - DOI - PubMed
    1. Athari S.S. Targeting Cell Signaling in Allergic Asthma. Signal Transduct. Target. Ther. 2019;4:45. doi: 10.1038/s41392-019-0079-0. - DOI - PMC - PubMed
    1. Arora S., Dev K., Agarwal B., Das P., Syed M.A. Macrophages: Their Role, Activation and Polarization in Pulmonary Diseases. Immunobiology. 2018;223:383–396. doi: 10.1016/j.imbio.2017.11.001. - DOI - PMC - PubMed

Publication types