. 2023 Mar 24;12(7):1006.
doi: 10.3390/cells12071006.

The Beneficial Effect of Mitochondrial Transfer Therapy in 5XFAD Mice via Liver-Serum-Brain Response

Affiliations

The Beneficial Effect of Mitochondrial Transfer Therapy in 5XFAD Mice via Liver-Serum-Brain Response

Sahar Sweetat et al. Cells. .

Abstract

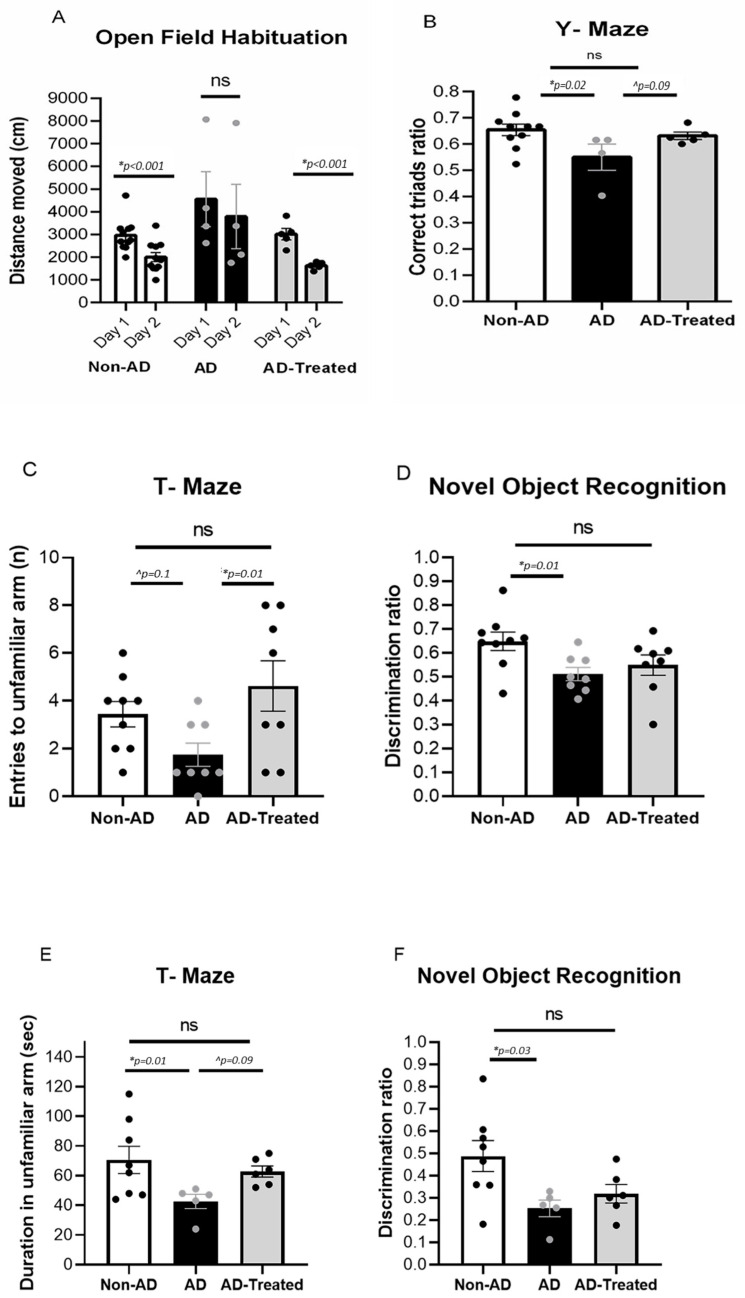
We recently reported the benefit of the IV transferring of active exogenous mitochondria in a short-term pharmacological AD (Alzheimer's disease) model. We have now explored the efficacy of mitochondrial transfer in 5XFAD transgenic mice, aiming to explore the underlying mechanism by which the IV-injected mitochondria affect the diseased brain. Mitochondrial transfer in 5XFAD ameliorated cognitive impairment, amyloid burden, and mitochondrial dysfunction. Exogenously injected mitochondria were detected in the liver but not in the brain. We detected alterations in brain proteome, implicating synapse-related processes, ubiquitination/proteasome-related processes, phagocytosis, and mitochondria-related factors, which may lead to the amelioration of disease. These changes were accompanied by proteome/metabolome alterations in the liver, including pathways of glucose, glutathione, amino acids, biogenic amines, and sphingolipids. Altered liver metabolites were also detected in the serum of the treated mice, particularly metabolites that are known to affect neurodegenerative processes, such as carnosine, putrescine, C24:1-OH sphingomyelin, and amino acids, which serve as neurotransmitters or their precursors. Our results suggest that the beneficial effect of mitochondrial transfer in the 5XFAD mice is mediated by metabolic signaling from the liver via the serum to the brain, where it induces protective effects. The high efficacy of the mitochondrial transfer may offer a novel AD therapy.

Keywords: 5XFAD; Alzheimer’s disease; amyloid; cognition; mitochondria; mitochondrial transfer.


Conflict of interest statement

The authors declare no conflict of interest.

Figures

Figure 1
Figure 1
IV mitochondria-treated AD mice performed better in cognitive tests than untreated AD mice. (A,B) AD mice that received four injections of mitochondria starting at 6 months of age showed better cognitive performance compared to untreated mice, approaching the performance of non-AD mice. In the Open Field Habituation test (A), there was a significantly lower distance walk in Day 2 compared to Day 1 in the non-AD mice (t-test, p < 0.001) and in the treated AD mice (p < 0.001), but not in the untreated AD mice. In the Y-maze test (B), one-way ANOVA showed a trend toward difference between the groups [f(2, 16) = 3.22, p = 0.06]. LSD post-hoc analysis showed significantly worse performance (lower correct triads ratio) in AD mice relative to the non-AD group (p = 0.02), and a trend toward better performance in treated AD mice relative to untreated AD mice (p = 0.09), with no difference between treated AD mice and non-AD mice. (C,D) AD mice that received three injections of mitochondria starting at 6 months of age showed better cognition compared to untreated AD mice, similar to the performance of non-AD mice. In the T-maze test (C), one-way ANOVA revealed a significant difference between the groups [f(2, 22) = 3.84, p = 0.037]. LSD post-hoc analysis showed significantly better performance (higher number of entries into the new arm) in treated AD mice relative to untreated AD mice (p = 0.01) and a trend toward worse performance in AD mice relative to the non-AD group (p = 0.1), with no difference between treated AD mice and non-AD mice. There was better cognitive performance in the mitochondria-treated AD mice in the Novel Object Recognition test (D) compared to untreated AD mice, similar to the performance of non-AD mice: one-way ANOVA revealed a significant difference between the groups [f(2, 22) = 3.76, p = 0.039]. LSD post-hoc analysis showed significantly worse performance (lower discrimination ratio: spending less time near the novel object) in AD mice relative to the non-AD group (p = 0.01), with no difference between treated AD mice and non-AD mice. (E,F) AD mice that received two injections of the isolated mitochondria starting at 12 months of age showed better cognitive performance compared to untreated AD mice in the T-maze test. (E) One-way ANOVA showed a significant difference between the groups [f(2, 16) = 3.477, p = 0.05]. LSD post-hoc analysis showed significantly worse performance in AD mice relative to the non-AD group (p = 0.01) and a trend toward worse performance of AD mice relative to the treated AD group (p = 0.09), with no difference between treated AD mice and non-AD mice. There was better cognitive performance in the Novel Object Recognition test compared to untreated AD mice, similar to the performance of non-AD mice. (F) One-way ANOVA revealed a significant difference between the groups [f(2, 16) = 4.463, p = 0.029]. Tukey post-hoc analysis showed significantly worse performance in AD mice relative to the non-AD group (p = 0.03), with no difference between treated AD mice and non-AD mice (* statistically significant; ^ trend, ns= non significant).
Figure 2
Figure 2
Reduced neuronal damage and amyloid burden in the cortex of AD mice treated with mitochondrial transfer. (A) NeuN and FJC staining of neurons. Lower neuronal count (NeuN) (relative to non-AD mice) and presence of degenerative neurons (FJC) were detected in the AD mice, with increased neural counts and decreased degenerative neurons in mitochondria-treated AD mice relative to untreated AD mice. (B,C) Quantitative analysis: one-way ANOVA showed a significant difference between the groups [f(2, 12) = 12.59, p = 0.001]. LSD post-hoc analysis showed a significantly lower neuronal count in AD vs. non-AD mice (p = 0.0003), with higher count in mitochondria-treated vs. untreated AD mice (p = 0.04) and a trend toward decrease in degenerative neurons in the treated vs. untreated AD mice (t-test, p = 0.1). (D) 6E10 and thioflavin staining for amyloid. Amyloid pathology was detected in AD mice. Decreased amyloid pathology in the mitochondria-treated relative to untreated AD mice. (E,F) Quantitative analysis: lower amyloid burden (6E10) and plaques (thioflavin) in mitochondria-treated vs. untreated AD mice (t-test, p = 0.009; trend, p = 0.06, respectively). Staining of 6E10 and thioflavin was hardly detected in the non-AD mice (* statistically significant; ^ trend).
Figure 3
Figure 3
Increased mitochondrial enzymatic activity in the brain and liver of AD mice treated with mitochondrial transfer (A–D). Injected mitochondria are detected in the liver and not in brain (E,F). (A,B) COX/CS activity ratio in the brain and liver of 6-month-old treated mice (four injections). (A) One-way ANOVA showed a significant difference in brain between the groups [f(2, 11) = 8.064, p = 0.007]. LSD post-hoc analysis showed a significantly lower ratio in AD vs. non-AD mice (p = 0.002), with higher ratio in mitochondria-treated vs. untreated AD mice (p = 0.018), reaching the ratio of the non-AD mice. (B) A higher COX/CS ratio was detected in the liver of treated AD mice relative to the untreated AD mice (t-test, p = 0.004), reaching even a higher value than in the liver of the non-AD mice, with a trend showing a reduced ratio in the AD relative to non-AD mice (p = 0.1). (C,D) COX/CS activity ratio in the brain and liver of 12-month-old treated mice (two injections). (C) The treated AD mice showed a higher COX/CS ratio in brain relative to the untreated AD mice (t-test, p = 0.028), reaching the ratio of the non-AD and even exceeding it, with a trend showing a reduced ratio in the AD relative to non-AD mice (p = 0.15). (D) One-way ANOVA showed a trend toward difference in brain between the groups [f(2, 16) = 3.245, p = 0.06]. LSD post-hoc analysis showed a significantly higher COX/CS ratio in the treated compared to the untreated AD mice (p = 0.044), with a reduced ratio in the AD relative to non-AD mice (p = 0.033). (E,F) DsRed signal is detected in the liver and not in the brain of AD mice about 2 h following the injection of DsRed mitochondria. (E) Using IVIS: DsRed signal in the liver of mitochondria-injected (200 mgr/mouse buffer) AD mice but not in their brain (hippocampus region is presented). No signal in the brains and livers of buffer-injected mice. (F) Using anti-RFP Ab fluorescence staining: DsRed signal in the liver of mitochondria-injected (500 mgr/mouse) AD mice but not in their brain. No signal in the brains and livers of buffer-injected mice (* statistically significant; ^ trend).
Figure 4
Figure 4
Proteomics analysis of the hippocampus: heatmap analysis of hippocampus homogenates. Analysis showing proteins significantly altered across all group comparisons (non-AD, AD, and treated AD). Red is indicative of upregulation while green is indicative of downregulation.
Figure 5
Figure 5
Proteomics analysis of the hippocampus: annotation analysis of hippocampus homogenates. (A) KEGG/GOTERM (names of affected proteins presented in brackets; full names of proteins are presented in Table S1 and Supplemental-hippocampus-proteomics-excel). (B) Gorilla enrichment. AD > treated AD—marked in blue, AD < treated AD—marked in red.
Figure 6
Figure 6
Proteomics analysis of the hippocampus: annotation analysis of hippocampus aggregates. (A) KEGG/GOTERM (names of affected proteins presented in brackets; full names of proteins are presented in Table S1 and Supplemental-hippocampus-aggregates-proteomics-excel). (B) Gorilla enrichment AD > treated AD—marked in blue, AD < treated AD—marked in red.
Figure 7
Figure 7
Proteomics analysis of the hippocampus: PTM-phosphorylation analysis. (A) STRING analysis of close clustering of synapse related proteins (in red) (full names of proteins are presented in the Supplemental hippocampus-phospho-proteomics-excel). (B) Identification of the amino-acid motifs of the differential phospho-peptides between the AD and treated AD groups in the brain samples.
Figure 8
Figure 8
Proteomics analysis of the liver. (A) Heatmap showing proteins significantly altered across all group comparisons (non-AD, AD, and treated AD) in liver homogenates. Red is indicative of upregulation while green is indicative of downregulation. (B,C) Annotation analysis. (B) KEGG/GOTERM (names of affected proteins presented in brackets; full names of proteins are presented in Table S1 and Supplemental-liver-proteomics-excel). (C) Gorilla enrichment of the liver. AD > treated AD—marked in blue, AD < treated AD—marked in red.
Figure 8
Figure 8
Proteomics analysis of the liver. (A) Heatmap showing proteins significantly altered across all group comparisons (non-AD, AD, and treated AD) in liver homogenates. Red is indicative of upregulation while green is indicative of downregulation. (B,C) Annotation analysis. (B) KEGG/GOTERM (names of affected proteins presented in brackets; full names of proteins are presented in Table S1 and Supplemental-liver-proteomics-excel). (C) Gorilla enrichment of the liver. AD > treated AD—marked in blue, AD < treated AD—marked in red.
Figure 9
Figure 9
Metabolomics analysis of the liver. (A) PLS-DA (“supervised PCA”) obtained from the three groups (non-AD, AD mice, and treated AD mice) showed separation of the samples, with the AD mice and the non-AD mice showing the biggest difference, while the treated AD group separates from the AD mice. (B) Heatmap showing metabolites significantly altered across all group comparisons, presented as average value for each group. (C) VIP score plots, presenting the contribution of the metabolites (top 25) with the highest impact on the difference between the tested groups, showing Treatment Rescued effect (such as hexose, taurine, glutamine, Glu) or Treatment Effect (such as Asn, Asp, Ala). (Detailed VIP contribution in Table S3). (D). Correlation of the metabolites (top 25) with the transitions (differences) between the groups (non-AD vs. AD, non-AD vs. treated AD and AD vs. treated AD). Positive correlation marked in red, negative correlation marked in blue. Most of the metabolites showing positive correlation in the non-AD vs. AD do not show such a correlation in the non-AD vs. treated-AD and also show negative correlation in the AD vs. treated AD (such as carnosine, sphingomyelin, hydroxytetradeceno, and hexadecenolcarnitine), thereby pointing to a Treatment Rescued effect. A Treatment Effect in the AD vs. treated AD difference showed correlated metabolites (such as Ala, Asn, Asp). (E) Metabolomic Pathway Analysis (SMPDB pathway libraries as references) for identifying the metabolic pathways enriched by the mitochondria treatment. The 5–6 top enriched sets in the treated AD vs. the AD mice are highly significant.
Figure 10
Figure 10
Metabolomics analysis of the serum. (A) Heatmap showing metabolites significantly altered across all group comparisons, presented as average value for each group. (B) VIP score plot and (C) correlation of metabolites with treated AD vs. the AD difference point to the alterations in Ala, Asp, Asn, Gly, Glu, and hexose.

Similar articles

Cited by

References

    1. Ramachandran A.K., Das S., Joseph A., Shenoy G.G., Alex A.T., Mudgal J. Neurodegenerative Pathways in Alzheimer’s Disease: A Review. Curr. Neuropharmacol. 2021;19:679–692. doi: 10.2174/1570159X18666200807130637. - DOI - PMC - PubMed
    1. Anil D.A., Aydin B.O., Yeliz D., Burcin T. Design, synthesis, biological evaluation and molecular docking studies of novel 1 H-1,2,3-Triazole derivatives as potent inhibitors of carbonic anhydrase, acetylcholinesteraseand aldose reductase. J. Mol. Struct. 2022;1257:132613. doi: 10.1016/j.molstruc.2022.132613. - DOI
    1. Scheffler I.E. A century of mitochondrial research: Achievements and perspectives. Mitochondrion. 2001;1:3–31. doi: 10.1016/S1567-7249(00)00002-7. - DOI - PubMed
    1. Reddy P.H. Mitochondrial dysfunction in aging and Alzheimer’s disease: Strategies to protect neurons. Antioxid Redox Signal. 2007;9:1647–1658. doi: 10.1089/ars.2007.1754. - DOI - PubMed
    1. Desler C., Lillenes M.S., Tønjum T., Rasmussen L.J. The role of mitochondrial dysfunction in the progression of Alzheimer’s disease. Curr. Med. Chem. :2017. doi: 10.2174/0929867324666170616110111. - DOI - PMC - PubMed

Publication types