. 2023 Mar 27;12(7):1025.
doi: 10.3390/cells12071025.

Autophagy Inhibitor Chloroquine Downmodulates Hepatic Stellate Cell Activation and Liver Damage in Bile-Duct-Ligated Mice

Affiliations

Autophagy Inhibitor Chloroquine Downmodulates Hepatic Stellate Cell Activation and Liver Damage in Bile-Duct-Ligated Mice

Trinh Van Le et al. Cells. .

Abstract

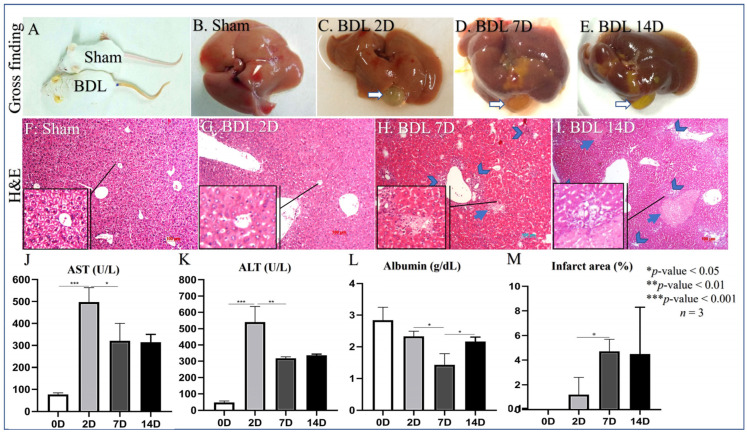
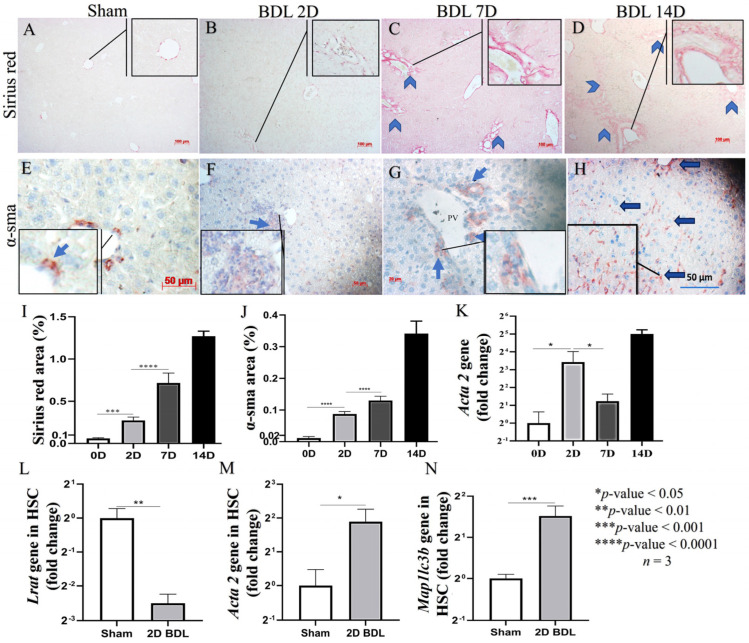
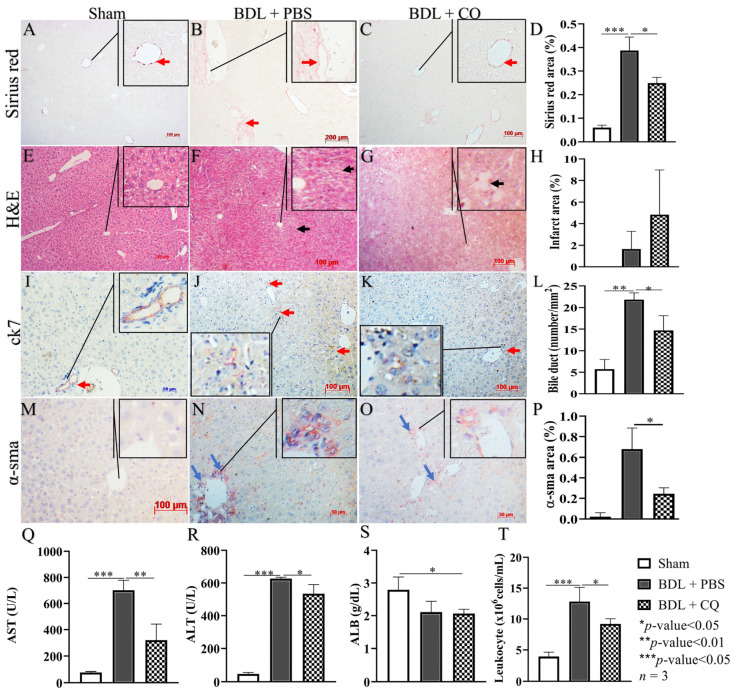
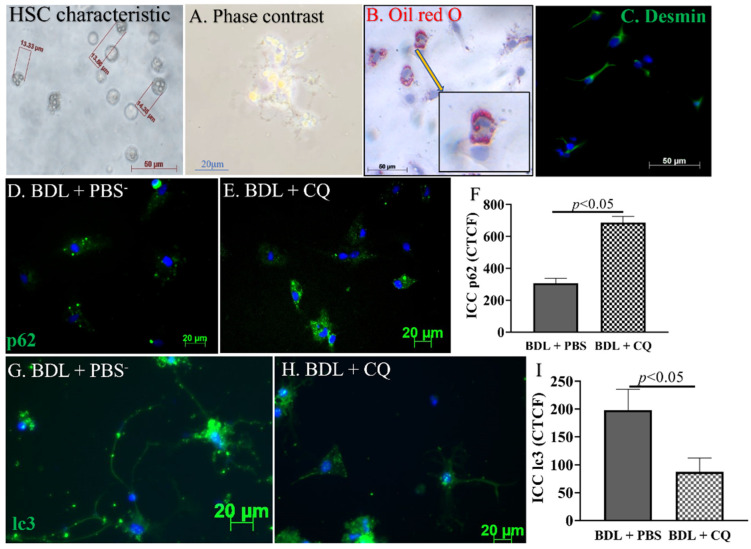
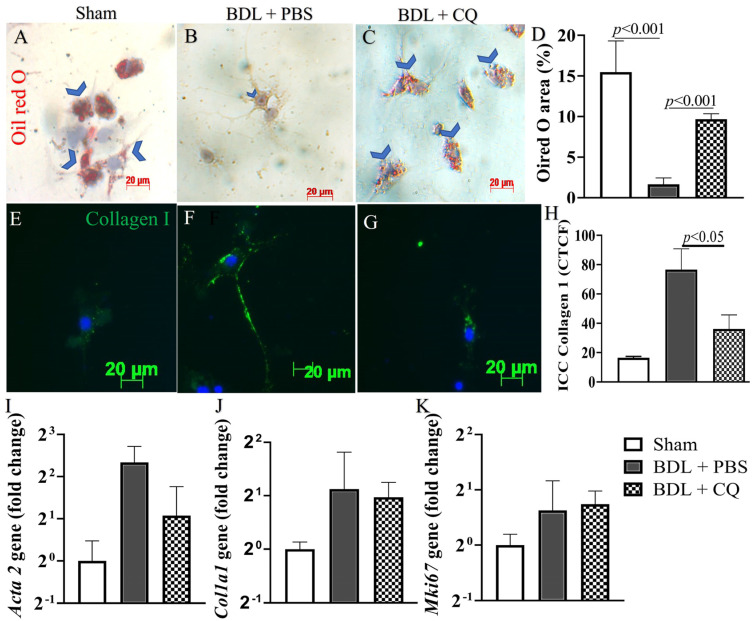
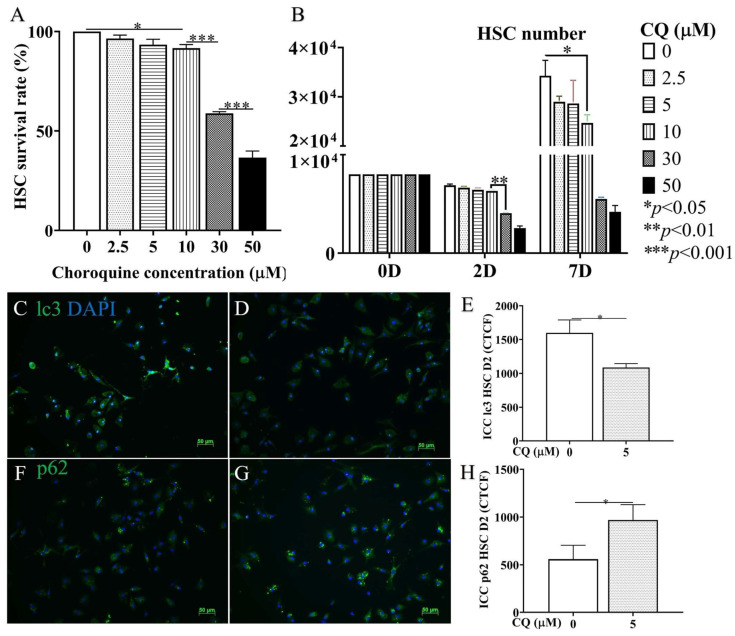
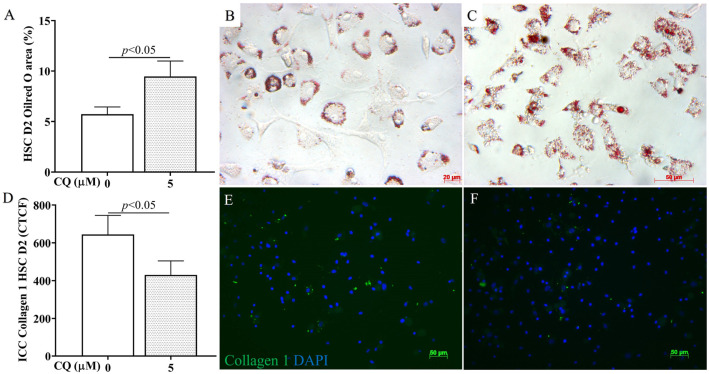
Hepatic stellate cell (HSC) activation via the autophagy pathway is a critical factor in liver fibrogenesis. This study tests the hypothesis that chloroquine (CQ) treatment can prevent autophagy and HSC activation in vitro and in vivo in bile-duct-ligated (BDL) mice. Sham-operated and BDL mice were treated with either PBS or CQ in two 60 mg/kg doses the day (D) before and after surgery. On day 2 (2D), HSCs were isolated, and their biological activities were evaluated by measuring intracellular lipid content, α-sma/collagen, and expression of autophagy lc3, sqstm1/p62 markers. The treatment efficacy on liver function was evaluated with serum albumin, transaminases (AST/ALT), and hepatic histology. Primary HSCs were treated in vitro for 24 h with CQ at 0, 2.5, 5, 10, 30, and 50 µM. Autophagy and HSC activation were assessed after 2D of treatment. CQ treatment improved serum AST/ALT, albumin, and bile duct proliferation in 2D BDL mice. This is associated with a suppression of HSC activation, shown by higher HSC lipid content and collagen I staining, along with the blockage of HSC autophagy indicated by an increase in p62 level and reduction in lc3 staining. CQ 5 µM inhibited autophagy in primary HSCs in vitro by increasing p62 and lc3 accumulation, thereby suppressing their in vitro activation. The autophagy inhibitor CQ reduced HSC activation in vitro and in vivo. CQ improved liver function and reduced liver injury in BDL mice.

Keywords: anti-fibrosis; autophagy; bile duct ligation; chloroquine; stellate cell transformation.


Conflict of interest statement

The authors declare no conflict of interest.

Figures

Figure 1
Figure 1
Evidence of liver damage in BDL mice. (A) Macroscopic evidence of jaundice in BDL mice compared to control animals. (B) Liver macroscopic appearance in control mice. (CE) Liver macroscopic appearance in BDL mice 2, 7, and 14 days after BDL. (F) Microscopic appearance of liver in control animals (H&E staining). (GI) Microscopic appearance of liver in BDL animals (H&E staining) 2, 7, and 14 days after BDL; head arrows indicate portal reaction and inflammation; arrows indicate the necrotic area. (JL) Levels of circulating AST/ALT/Albumin in BDL mice 0, 2, 7, and 14 days after BDL, * p < 0.05, ** p < 0.01, *** p < 0.001, n = 3. (M) Quantification of necrotic areas in BDL mice Sham (0), 2, 7, and 14 days after BDL, * p < 0.05, n = 3, 100 µm scale bare.
Figure 2
Figure 2
Hepatic stellate cell activation following bile duct ligation. (A) Sirius red staining of liver tissues in control animal. (BD) Sirius red staining of liver tissues in BDL animals over time; head arrows indicate portal fibrosis. (E) α-sma staining of liver tissue in control animal. (FH) α-sma staining of liver tissue in BDL animals over time; blue arrows indicate interstitial HSC and portal MBF positive for α-sma. (I) Quantification of Sirius red staining of liver tissues in BDL animals over time. (J) Quantification of α-sma in liver tissues in BDL animals over time. (K) Quantification of acta 2 mRNA level in liver tissues of BDL animals over time. (LN) mRNA levels of lrat (L), acta 2 (M) and Map1lc3b (N) in HSC isolated from Sham and BDL mice. * p < 0.05, ** p < 0.01, *** p < 0.001, **** p < 0.0001, n = 3, scale bar: 100 µm for sirius red and 50 µm for α-sma staning.
Figure 3
Figure 3
Effects of CQ treatment effects on liver damage in BDL. (AD) Representative Sirius red staining of liver tissues in Sham, BDL + PBS, and BDL + CQ animals with the respective quantification; red arrows indicate positive areas. (EH) Representative H&E staining of liver tissues in Sham, BDL + PBS, and BDL + CQ animals with the respective quantification; black arrows indicate areas of necrosis. (IL) Representative ck7 staining in liver tissues in Sham, BDL + PBS, and BDL + CQ animals with the respective quantification; red arrows indicate portal reaction due to bile duct proliferation. (MP) Representative α-sma staining in liver tissues from Sham, BDL + PBS, and BDL + CQ animals together with the quantification; blue arrows indicate positive areas. (QS) ALT, AST, and albumin levels in Sham animals and BDL (2 days) animals treated either with CQ (BDL/CQ) or with PBS (BDL/PBS, control). (T) Peripheral leukocytes in Sham animals and BDL (2 days) animals treated either with CQ or with PBS (control). * p < 0.05, ** p < 0.01, *** p < 0.001, n = 3, 100 µm scale bar.
Figure 4
Figure 4
Effects of CQ on HSCs in vivo autophagy. (AC) Representative images of the phenotypic characteristics of HSCs isolated from Sham mice: phase contrast images of cells 24 h after seeding (A), Oil red O staining (B), and desmin staining (C; green, desmin staining; blue, nucleus staining). (DF) Representative images of the sqstm1/p62 staining in isolated HSCs and graph comparison of CTCF (Correct Total Cell Fluorescence quantification) from ICC staining. (GI) Representative images of the lc-3b staining in isolated HSC and graph comparison of CTCF from ICC staining in BDL + PBS and BDL + CQ mice, n = 3.
Figure 5
Figure 5
Effects of CQ on HSC in vivo activation. (AC) Representative images of Oil red O staining in HSC isolated from the three mice groups: Sham, BDL/PBS, and BDL/CQ; blue arrows indicate the positive areas. (D) Quantification of the surface of Oil red O staining areas, p < 0.05, n = 3. (EG) Representative images of type I collagen staining in HSCs isolated from the three mice groups: Sham, BDL/PBS, and BDL/CQ; (H) Quantification CTCF (Correct Total Cell Fluorescence quantification) of Collagen staining, p < 0.05, n = 3. (IK) mRNA levels of acta 2, col1a1, and Mki-67 markers in HSCs isolated from Sham, BDL/PBS, and BDL/CQ mice.
Figure 6
Figure 6
CQ cytotoxicity and autophagy effectiveness on HSCs in vitro. (A,B) Graphic comparison of CQ concentrations varying between 0, 2.5, 5, 10, 30, and 50 µM based on cytotoxicity and proliferation until 7D of culture (B) and 2D (A). (C,D) Representative images of ICC staining with lc3 antibody/DAPI of in vitro HSCs treated with 0 and 5 µM of CQ. (E) Graphic comparison of CTCF (Correct Total Cell Fluorescence quantification) from ICC staining. (F,G) Representative images of ICC staining with p62 antibody/DAPI of HSC treated with 0 and 5 µM of CQ. (H) Graphic comparison of CTCF from ICC staining. p-value: * < 0.05, ** < 0.01, *** < 0.001, n = 3, 50 µm scale bar.
Figure 7
Figure 7
CQ effects on HSC in vitro activation. (A) Graphic comparison of Oil red O area (%) between CQ 0 and 5 µM from the ORO staining image. (BD) Graphic comparison of CTCF (Correct Total Cell Fluorescence quantification) from ICC staining with collagen 1 antibody/DAPI (E,F) between CQ 0 and 5 µM. p-value < 0.05, n = 3, 50 µm scale bar.

References

    1. Klionsky D.J., Petroni G., Amaravadi R.K., Baehrecke E.H., Ballabio A., Boya P., Pedro J.M.B.-S., Cadwell K., Cecconi F., Choi A.M.K., et al. Autophagy in major human diseases. Embo J. 2021;40:e108863. doi: 10.15252/embj.2021108863. - DOI - PMC - PubMed
    1. Conway O., Akpinar H.A., Rogov V.V., Kirkin V. Selective autophagy receptors in neuronal health and disease. [(accessed on 19 January 2023)];J. Mol. Biol. 2020 432:2483–2509. doi: 10.1016/j.jmb.2019.10.013. Available online: https://www.sciencedirect.com/science/article/pii/S0022283619306096. - DOI - PubMed
    1. Mallat A., Lodder J., Teixeira-Clerc F., Moreau R., Codogno P., Lotersztajn S. Autophagy: A multifaceted partner in liver fibrosis. Biomed. Res. Int. 2014;2014:869390. doi: 10.1155/2014/869390. - DOI - PMC - PubMed
    1. Weiskirchen R., Tacke F. Relevance of autophagy in parenchymal and non-parenchymal liver cells for health and disease. Cells. 2019;8:16. doi: 10.3390/cells8010016. - DOI - PMC - PubMed
    1. Fang H., Liu A., Dahmen U., Dirsch O. Dual role of chloroquine in liver ischemia reperfusion injury: Reduction of liver damage in early phase, but aggravation in late phase. Cell Death Dis. 2013;4:e694. doi: 10.1038/cddis.2013.225. - DOI - PMC - PubMed

Publication types