. 2023 Mar 29;12(7):1039.
doi: 10.3390/cells12071039.

The Impact of Phase-Specific Macrophage Depletion on Intestinal Anastomotic Healing

Affiliations

The Impact of Phase-Specific Macrophage Depletion on Intestinal Anastomotic Healing

Maximiliane Winter et al. Cells. .

Abstract

Intestinal anastomotic healing (AH) is critical in colorectal surgery, since disruptive AH leads to anastomotic leakage, a feared postoperative complication. Macrophages are innate immune cells and are instrumental in orchestrating intestinal wound healing, displaying a functional dichotomy as effectors of both tissue injury and repair. The aim of this study was to investigate the phase-specific function and plasticity of macrophages during intestinal AH. Transgenic CD11b diphtheria toxin receptor (CD11b-DTR) mice were used to deplete intestinal macrophages in a temporally controlled manner. Distal colonic end-to-end anastomoses were created in CD11b-DTR, and wild-type mice and macrophages were selectively depleted during either the inflammatory (day 0-3), proliferative (day 4-10), or reparative (day 11-20) phase of intestinal AH, respectively. For each time point, histological and functional analysis as well as gene set enrichment analysis (GSEA) of RNA-sequencing data were performed. Macrophage depletion during the inflammatory phase significantly reduced the associated inflammatory state without compromising microscopic AH. When intestinal macrophages were depleted during the proliferative phase, AH was improved, despite significantly reduced perianastomotic neoangiogenesis. Lastly, macrophages were depleted during the reparative phase and GSEA revealed macrophage-dependent pathways involved in collagen remodeling, cell proliferation, and extracellular matrix composition. However, AH remained comparable at this late timepoint. These results demonstrate that during intestinal AH, macrophages elicit phase-specific effects, and that therapeutic interventions must critically balance their dual and timely defined role.

Keywords: DTR; IBD; anastomotic healing; inflammation; intestine; macrophages; monocytes; mucosal inflammation; wound healing.


Conflict of interest statement

The authors declare no conflict of interest.

Figures

Figure 1
Figure 1
Graphical overview of the study design and macrophage-associated activities during intestinal anastomotic healing. Wild type (WT), CD11b diphtheria toxin receptor (CD11b-DTR), extracellular matrix (ECM), tumor necrosis factor alpha (TNF-α), interleukin (IL1-ß, -4, -6, -8, -10, -12, -13, -23), reactive oxygen species (ROS), transforming growth factor (TGF), specialized pro-resolving mediator (SPM), matrix metalloproteinases (MMP), platelet-derived growth factor (PDGF), epidermal growth factor (EGF).
Figure 2
Figure 2
Temporally controlled diphtheria-toxin-induced monocyte depletion. (A) Diphtheria toxin receptor (DTR) in CD11b-DTR mice allows the specific systemic and local ablation of monocytes and macrophages by injecting diphtheria toxin (DT) intraperitoneally (i.p.), while wildtype (WT) mice are naturally resistant. (B) DT treatment scheme with a varying duration of DT treatment. Mice were treated with DT for 3 (red), 6 (blue) or 9 (green) days. Gating strategy for identification of circulating monocytes (mono) in (C) WT and (D) CD11b-DTR mice; representative flow cytometry plots are shown. Viable cells are identified on a forward scatter-height (FSC-H) x side scatter (SSC-H) plot, while single cells are identified on an FSC-H x FSC-area (A) plot. Next, CD11b x FCH-H gating was used to identify CD11+ positive cells, which were gated in two parameter density plots with Ly6G and Ly6C. Monocytes were defined as CD11b+Ly6GlowLy6C+cells. Numeric data for circulating monocytes subsets mice following (E) 3, (F) 6, or (G) 9 days of treatment. All data are presented as mean values ± SEM, combined from 2 independent experiments with 4 to 5 individually analyzed mice per group. Each symbol in scatter plots represents 1 individual mouse. Data were analyzed with Student’s t test and significance is indicated by the following symbols: * p < 0.05, ** p < 0.01, **** p < 0.0001 vs. WT.
Figure 3
Figure 3
Diphtheria-toxin-induced circulating monocyte and intestinal macrophage depletion during intestinal anastomotic healing. (A) Colonic end-to-end anastomosis at the rectosigmoid junction as a model of murine intestinal anastomotic healing (AH) in wild type (WT) and CD11b-diphtheria toxin receptor (CD11b-DTR) mice. (B) Post-operative intraperitoneal (i.p) diphtheria toxin (DT) injective regime. After surgery, phase-specific DT-induced monocyte and macrophage ablation is conducted during the inflammatory (red, day 0–3), proliferative (blue, day 4–10), or reparative (green, day 11–20) of intestinal AH. On post-operative day (POD) 3, 9 or 20, mice are sacrificed for tissue and blood examination. (C) Representative dot plots (initially gated on viable CD11b cells) of circulating monocytes (CD11b+Ly6GlowLy6C+cells), stratified for Ly6Chigh(hi), Ly6Cintermediate(int) and Ly6Clow subsets. Numeric data for circulating monocytes subsets in WT and CD11b-DTR mice during (D) the inflammatory, (E) the proliferative and (F) the reparative phase of intestinal anastomotic healing. Representative immunofluorescence images of F4/80-stained sections of the anastomotic region in WT (G) and (H) CD11b-DTR (H) mice. To better visualize the presence of macrophages (F4/80+), representative single color and merged pictures with DAPI (nuclei) staining are shown. All overview images were taken at 20× magnification, scale bar 50 µm, while close ups (dashed line) were taken at 40× magnification; scale bar 20 µm, white arrows indicate macrophages, L= lumen, I = perianastomotic infiltrate (outlined with white broken line), E = epithelium, M = muscularis. For quantitative analysis, 3 randomly chosen fields are analyzed on 3 non-consecutive slides. The intestinal macrophage burden is expressed as F4/80-stained cells per DAPI-stained cells in % and shown for the (I) inflammatory, (J) proliferative and (K) reparative phase of intestinal AH in WT and CD11b-DTR mice. All data are presented as mean values ± SEM, combined from at least 2 independent experiments with 5 to 9 individually analyzed mice per group. Each symbol in scatter plots represents 1 individual mouse; line indicates mean values. Data were analyzed with Student’s t test and significance is indicated by the following symbols: * p < 0.05, ** p < 0.01, *** p < 0.001, **** p < 0.0001 vs. WT, ns = not significant.
Figure 4
Figure 4
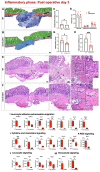
Intestinal anastomotic healing during the inflammatory phase. Multicolor stained sections of anastomotic healing (AH) at postoperative day 3 in (A) wild type (WT) and (B) CD11b-diphtheria toxin receptor (DTR) mice. E = epithelium (green); MM = muscularis mucosae (purple); SM = submucosa; M, tunica muscularis (turquoise); M = muscularis (red), I = perianastomotic infiltrate. Images were taken at 4× magnification, scale bar 100 µm. (C) Anastomotic healing score. (D) Thickness of colonic layers in the perianastomotic region (in µm). Representative histopathologic images of hematoxylin-and-eosin-stained anastomotic regions from (E) WT and (F) CD11b-DTR mice. Overview images were taken at 4× magnification (scale bar 100 µm), close-ups at 20× magnification (scale bar 50 µm), 40× magnification (scale bar 20 µm) and 100× magnification (scale bar 20 µm)). (G) Inflammatory infiltrate (in mm2) and (H) quantitative inflammation score for WT and CD11b-DTR mice. For quantitative analysis, 3 randomly chosen fields are analyzed per slide. Relative expression levels (normalized counts) of representative genes involved in (I) leucocyte adhesion-extravasation-migration, (J) cytokine and chemokine signaling, (K) reactive oxygen species (ROS) signaling, (L) leucocyte signaling and (M) eicosanoid signaling. All data are presented as mean values ± SEM, combined from at least 2 independent experiments with 4 to 8 individually analyzed mice per group. Each symbol in scatter plots represents 1 individual mouse; line indicates mean values. Data were analyzed with Student’s t test and significance is indicated by the following symbols: * p < 0.05, ** p < 0.01, *** p <0.001, **** p <0.0001 vs. WT, ns = not significant.
Figure 5
Figure 5
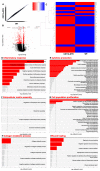
Gene set enrichment analysis of intestinal anastomotic healing during the inflammatory phase. Gene set enrichment analysis (GSEA) results of anastomotic healing (AH) comparing wild type (WT) with CD11b-diphtheria toxin receptor (DTR) mice. RNA-Seq was performed on samples collected at postoperative day 3. (A) Scatterplot and (B) volcano plot. Volcano plot showing statistical significance of differential gene expression data (adjusted p-value) vs. magnitude of expression change (log2 fold change). (C) Heatmap of the top 50 differentially regulated genes related to wound healing, identified using GO term 0042060 (“wound healing”). (D) Pathways under inflammatory response (GO:0006954), (E) pathways under cytokine production (GO:0001816), (F) pathways under extracellular matrix assembly (GO:0085029), (G) pathways under cell population proliferation (GO:0085029), (H) pathways under collagen metabolic process (GO:0032963) and (I) pathways under wound healing (GO:0042060). A significance threshold of 0.05 was used for the FDR-corrected p-values to determine significantly expressed genes and gene sets. Bars in red indicate statistically significant upregulation. A total of 4 mice were analyzed per group.
Figure 6
Figure 6
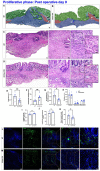
Intestinal anastomotic healing during the proliferative phase. Multicolor stained sections of anastomotic healing (AH) at postoperative day 9 in (A) wild type (WT) and (B) CD11b-diphtheria toxin receptor (DTR) mice. E = epithelium (green); MM = muscularis mucosae (purple); SM = submucosa; M, tunica muscularis (turquoise); M = muscularis (red), I = perianastomotic infiltrate. Images were taken at 4× magnification, scale bar 100 µm. Representative histopathologic images of hematoxylin-and-eosin-stained anastomotic regions from (C) WT and (D) CD11b-DTR mice. Overview images were taken at 4× magnification (scale bar 100 µm), close-ups at 20× magnification (scale bar 50 µm), 40× magnification (scale bar 20 µm) and 100× magnification (scale bar 20 µm)). (E) Scar area (in mm2), (F) anastomotic healing score, (G) re-epithelialization (epithelial gap in mm), (H) thickness of colonic layers in the perianastomotic region (in µm), (I) collagen density (picro-sirius red stained collagen (PSR+)/scar area) (J) anastomotic bursting pressure (in mmHg) and (K) blood vessel density (CD31+ structures/mm2). Representative immunofluorescence images of CD31-stained sections of anastomotic regions from WT (L) and CD11b-DTR (M) mice. To visualize blood vessels (CD 31+), representative single color and merged pictures with DAPI (nuclei) staining are presented. For orientation, images were taken at ×10 magnification (scale bar 100 µm), then orange marked section is magnified ×20 (scale bar 50 µm) and ×40 (scale bar 20 µm), and 4 consecutive chosen fields were analyzed in 3 non-consecutive slides. All data are presented as mean values ± SEM, combined from at least 2 independent experiments with 5 to 8 individually analyzed mice per group. Data were analyzed with Student’s t test and significance is indicated by the following symbols: * p < 0.05, ** p < 0.01, vs. WT, ns = not significant.
Figure 7
Figure 7
Gene set enrichment analysis of intestinal anastomotic healing during the proliferative phase. Gene set enrichment analysis (GSEA) results of anastomotic healing (AH) comparing wild type (WT) with CD11b-diphtheria toxin receptor (DTR) mice. RNA-Seq was performed on samples collected at postoperative day 9. Scatterplot (A) and volcano plot (B). Volcano plot showing statistical significance of differential gene expression data (adjusted p-value) vs. magnitude of expression change (log2 fold change). (C) Heatmap of the top 50 differentially regulated genes related to wound healing, identified using GO term 0042060 (“wound healing”). (D) Pathways under inflammatory response (GO:0006954), (E) pathways under cytokine production (GO:0001816), (F) pathways under extracellular matrix assembly (GO:0085029), (G) pathways under cell population proliferation (GO:0085029), (H) pathways under collagen metabolic process (GO:0032963) and (I) pathways under wound healing (GO:0042060). A significance threshold of 0.05 was used for the FDR-corrected p-values to determine significantly expressed genes and gene sets. Bars in blue indicate statistically significant upregulation. A total of 4 mice were analyzed per group.
Figure 8
Figure 8
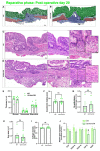
Intestinal anastomotic healing during the reparative phase. Multicolor stained sections of anastomotic healing (AH) at postoperative day 20 in (A) wild type (WT) and (B) CD11b-diphtheria toxin receptor (DTR) mice. E = epithelium (green); MM = muscularis mucosae (purple); SM = submucosa; M, tunica muscularis (turquoise); M = muscularis (red), I = perianastomotic infiltrate. Images were taken at 4× magnification, scale bar 100 µm. Representative histopathologic images of hematoxylin-and-eosin-stained anastomotic regions from (C) WT and (D) CD11b-DTR mice. Overview images were taken at 4x magnification (scale bar 100 µm), close-ups at 20× magnification (scale bar 50 µm), 40× magnification (scale bar 20 µm) and 100× magnification (scale bar 20 µm)). (E) Thickness of colonic layers in the perianastomotic region (in µm). (F) Anastomotic healing score, (G) re-epithelialization (epithelial gap in mm), (H) scar area (in mm2) and (I) collagen density. (J) Quantitative PCR analysis of results of macrophage derived growth factors (EGF: epidermal growth factor, PDGF-A/B: platelet-derived growth factor A/B, VEGF: vascular endothelial growth factor, TGF-β1: transforming growth factor beta 1) normalized to eukaryotic translation elongation factor 2 (Eef2) and analyzed by the 2−∆∆Ct method. All data are presented as mean values ± SEM, with 5 to 8 individually analyzed mice per group. Each symbol in the scatter plots represents 1 individual mouse; line indicates mean values. Significance, analyzed with Student’s t test, compared with WT mice is indicated by the following symbols: * p < 0.05, ns = non-significant vs. WT.
Figure 9
Figure 9
Gene set enrichment analysis of intestinal anastomotic healing during the reparative phase. Gene set enrichment analysis (GSEA) results of anastomotic healing (AH) comparing wild type (WT) with CD11b-diphtheria toxin receptor (DTR) mice. RNA-Seq was performed on samples collected at postoperative day 9. Scatterplot (A) and volcano plot (B). Volcano plot showing statistical significance of differential gene expression data (adjusted p-value) vs. magnitude of expression change (log2 fold change). (C) Heatmap of the top 50 differentially regulated genes related to wound healing, identified using GO term 0042060 (“wound healing”). (D) Pathways under inflammatory response (GO:0006954), (E) pathways under cytokine production (GO:0001816), (F) pathways under extracellular matrix assembly (GO:0085029), (G) pathways under cell population proliferation (GO:0085029), (H) pathways under collagen metabolic process (GO:0032963) and (I) pathways under wound healing (GO:0042060). A significance threshold of 0.05 was used for the FDR-corrected p-values to determine significantly expressed genes and gene sets. Bars in green indicate statistically significant upregulation. A total of 4 mice were analyzed per group.

Similar articles

Cited by

References

    1. McDermott F., Heeney A., Kelly M.E., Steele R.J., Carlson G.L., Winter D.C. Systematic review of preoperative, intraoperative and postoperative risk factors for colorectal anastomotic leaks. Br. J. Surg. 2015;102:462–479. doi: 10.1002/bjs.9697. - DOI - PubMed
    1. Bosmans J.W.A.M., Jongen A.C.H.M., Bouvy N.D., Derikx J.P.M. Colorectal anastomotic healing: Why the biological processes that lead to anastomotic leakage should be revealed prior to conducting intervention studies. BMC Gastroenterol. 2015;15:180. doi: 10.1186/s12876-015-0410-3. - DOI - PMC - PubMed
    1. Marjanovic G., Hopt U.T. Physiology of anastomotic healing. Chirurg. 2011;82:41–47. doi: 10.1007/s00104-010-1898-2. - DOI - PubMed
    1. Rijcken E., Sachs L., Fuchs T., Spiegel H.-U., Neumann P.-A. Growth factors and gastrointestinal anastomotic healing. J. Surg. Res. 2014;187:202–210. doi: 10.1016/j.jss.2013.10.013. - DOI - PubMed
    1. Lee S.H., Starkey P.M., Gordon S. Quantitative analysis of total macrophage content in adult mouse tissues. Immunochemical studies with monoclonal antibody F4/80. J. Exp. Med. 1985;161:475–489. doi: 10.1084/jem.161.3.475. - DOI - PMC - PubMed

Publication types