. 2023 Mar 29;12(7):1040.
doi: 10.3390/cells12071040.

Inhibition of LRRK2 Attenuates Depression-Related Symptoms in Mice with Moderate Traumatic Brain Injury

Affiliations

Inhibition of LRRK2 Attenuates Depression-Related Symptoms in Mice with Moderate Traumatic Brain Injury

Alessia Filippone et al. Cells. .

Abstract

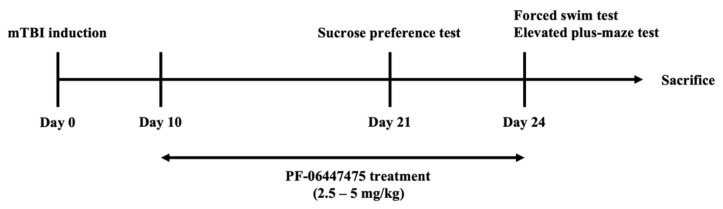
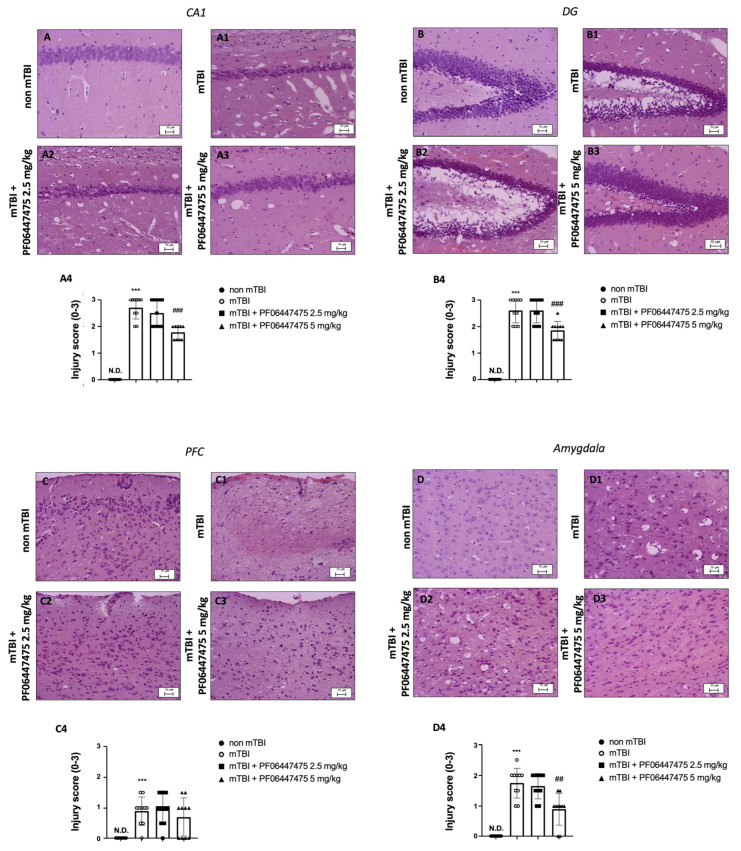
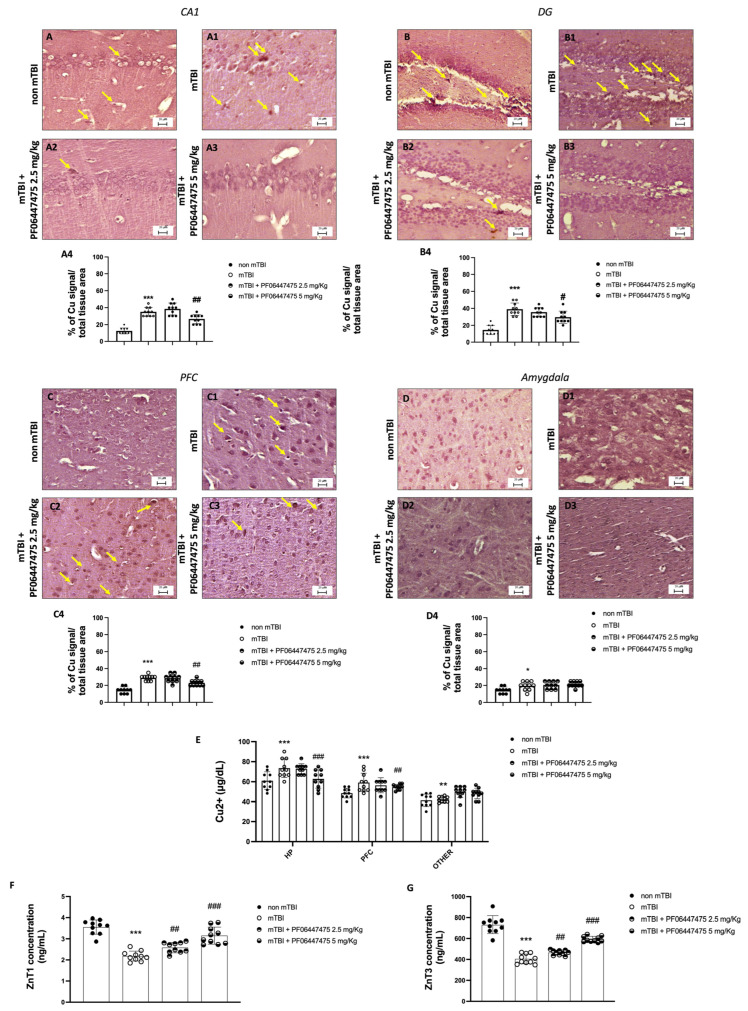
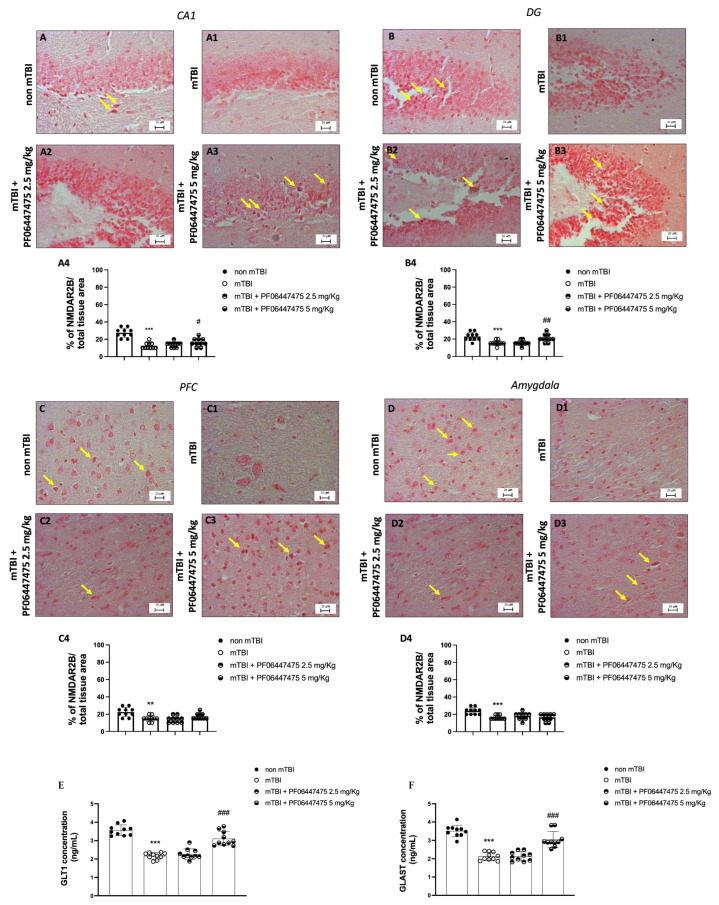
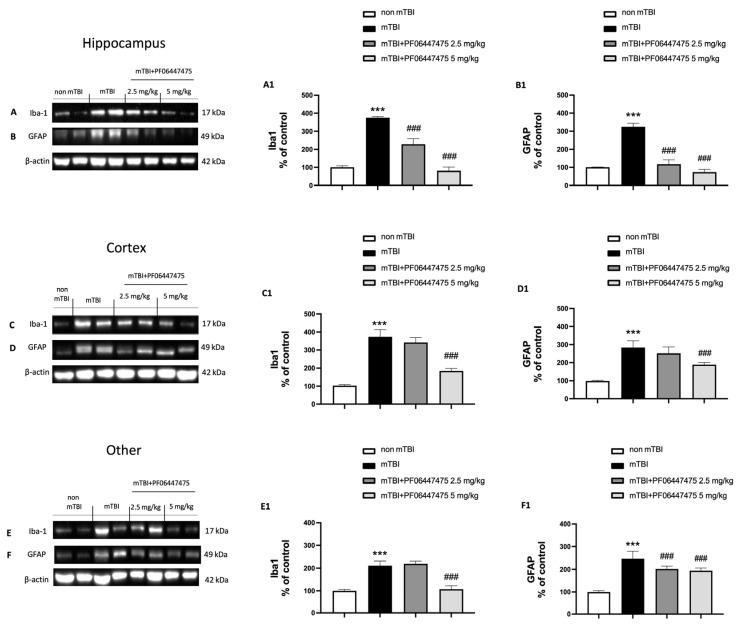
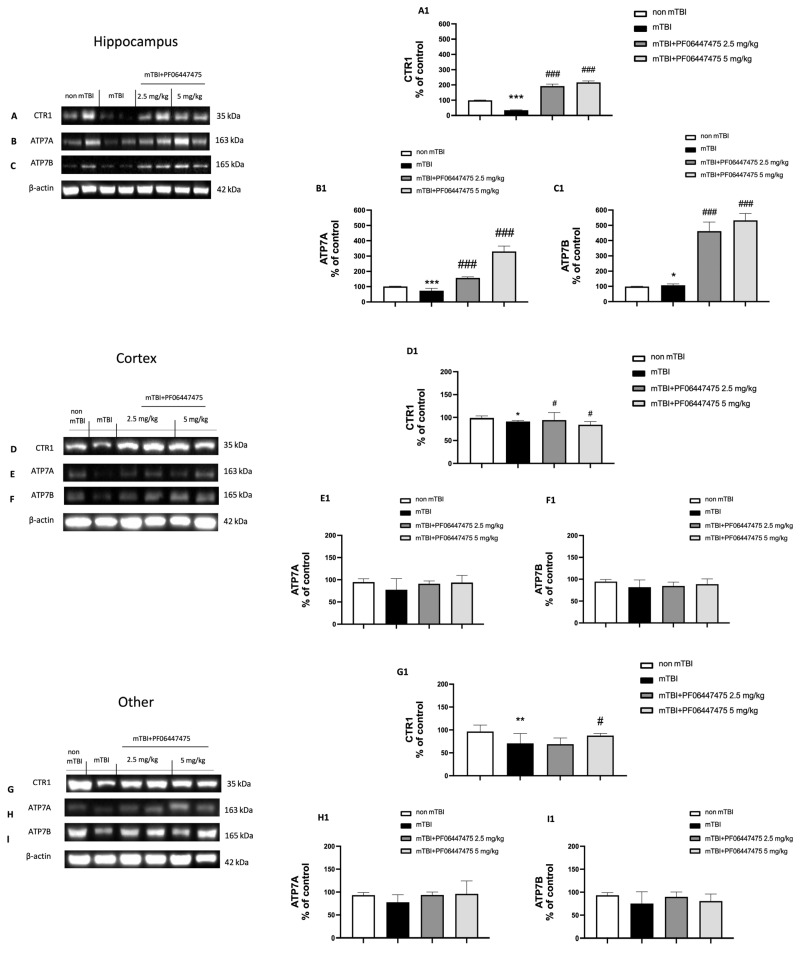
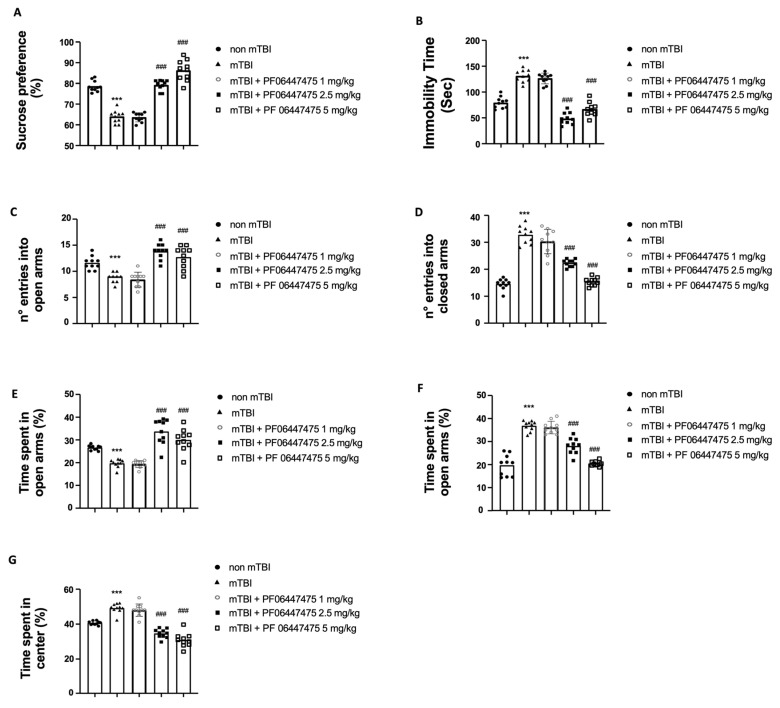
Moderate traumatic brain injury (mTBI) has been associated with emotional dysregulation such as loss of consciousness, post-traumatic amnesia and major depressive disorder. The gene Leucine-rich repeat kinase 2 (LRRK2) is involved in protein synthesis and degradation, apoptosis, inflammation and oxidative stress, processes that trigger mTBI. The aim of this study was to investigate the role of LRRK2 in reducing depression-related symptoms after mTBI and to determine whether inhibition of LRRK2 mediated by PF-06447475 could have antidepressant effects. Moderate traumatic brain injury was induced by controlled cortical impact (CCI) and mice were treated with PF-06447475 at doses of 1, 2.5 and 5 mg/kg once daily for 14 days. We performed histological, immunohistochemical and molecular analyses of brain tissue 24 days after mTBI. Furthermore, the tissue changes found in the hippocampus and amygdala confirmed the depression-like behavior. PF-treatment with 06447475 significantly reduced the histological damage and behavioral disturbances. Thus, this study has shown that mTBI induction promotes the development of depression-like behavioral changes. LRRK2 inhibition showed an antidepressant effect and restored the changes in the copper/glutamate/N-methyl-D-aspartic acid receptor (Cu/NMDAR) system.

Keywords: depression; moderate traumatic brain injury; neuroinflammation.


Conflict of interest statement

The authors declare no conflict of interest.

Figures

Scheme 1
Scheme 1
Experimental timeline.
Figure 1
Figure 1
Effects of PF-475 treatments on histological features after mTBI in the CA1, DG, PFC and amygdala areas. CA1 area: H&E staining of the non-mTBI group (A) and the mTBI group (A1), see injury score (A4). PF-475 treatments (2.5 mg/kg (A2) and 5 mg/kg (A3)), see injury score (A4). DG area: H&E staining of the non-mTBI group (B) and the mTBI group (B1), see injury score (B4). PF-475 treatments (2.5 mg/kg (B2) and 5 mg/kg (B3)), see injury score (B4). PFC area: H&E staining of the non-mTBI group (C) and the mTBI group (C1), see injury score (C4). PF-475 treatments (2.5 mg/kg (C2) and 5 mg/kg (C3)), see injury score (C4). Amygdala area: H&E staining of the non-mTBI group (D) and the mTBI group (D1), see injury score (D4). PF-475 treatments (2.5 mg/kg (D2) and 5 mg/kg (D3)), see injury score (D4). Data are expressed as SD from 10 mice for each group. Two-way ANOVA test. (ND) Not detectable. *** p< 0.001 vs. non-mTBI; ## p < 0.01 and ### p< 0.001 vs. mTBI.
Figure 2
Figure 2
Effects of PF-475 treatments on Cu uptake after mTBI in the CA1, DG, PFC and amygdala areas. CA1 area: copper staining of the non-mTBI group (A) and the mTBI group (A1), see percentage of Cu signal over the total tissue area (A4). PF-475 2.5 mg/kg (A2) and 5 mg/kg (A3), see percentage of Cu signal over the total tissue area (A4). DG area: copper staining of the non-mTBI group (B) and the mTBI group (B1), see percentage of Cu signal over the total tissue area (B4). PF-475 2.5 mg/kg (B2) and 5 mg/kg (B3), see percentage of Cu signal over the total tissue area (B4). PFC area: copper staining of the non-mTBI group (C) and the mTBI group (C1), see percentage of Cu signal over the total tissue area (C4). PF-475 2.5 mg/kg (C2) and 5 mg/kg (C3), see percentage of Cu signal over the total tissue area (C4). Amygdala area: copper staining of the non-mTBI group (D) and the mTBI group (D1), see percentage of Cu signal over the total tissue area (D4). PF-475 2.5 mg/kg (D2) and 5 mg/kg (D3), see percentage of Cu signal over the total tissue area (D4). Copper accumulation (E). The concentration of ZnT1 and ZnT3 in brain tissues (F,G). Data are expressed as SD from 10 mice for each group. Two-way ANOVA test. * p < 0.05, ** p < 0.01 and *** p < 0.001 vs. non mTBI; # p < 0.05, ## p < 0.01 and ### p < 0.001 vs. mTBI.
Figure 3
Figure 3
Immunohistochemical localization of NMDAR2B after mTBI in CA1, DG, PFC and amygdala areas. CA1 area: the non-mTBI group (A) and the mTBI group (A1), see percentage of NMDAR2B over the total tissue area (A4). PF-475 2.5 mg/kg (A2) and 5 mg/kg (A3), see percentage of NMDAR2B over the total tissue area (A4). DG area: the non-mTBI group (B) and the mTBI group (B1), see percentage of NMDAR2B over the total tissue area (B4). PF-475 2.5 mg/kg (B2) and 5 mg/kg (B3), see percentage of NMDAR2B over the total tissue area (B4). PFC area: the non-mTBI group (C) and the mTBI group (C1), see percentage of NMDAR2B over the total tissue area (C4). PF-475 2.5 mg/kg (C2) and 5 mg/kg (C3), see percentage of NMDAR2B over the total tissue area (C4). Amygdala area: the non-mTBI group (D) and the mTBI group (D1), see percentage of NMDAR2B over the total tissue area (D4). PF-475 2.5 mg/kg (D2) and 5 mg/kg (D3), percentage of NMDAR2B over the total tissue area (D4). The concentrations of GLT1 and GLAST in brain tissues (E,F). Data are expressed as SD from 10 mice for each group. Two-way ANOVA test. ** p < 0.01 and *** p < 0.001 vs. non mTBI; # p < 0.05, ## p < 0.01 and ### p < 0.001 vs. mTBI.
Figure 4
Figure 4
Effects of PF-475 on astrocytes and microglia activation after mTBI in hippocampus, cortex and other. Cytosolic fractions of hippocampus tissue were used to evaluate astrocytes and microglia activation trough the expression of GFAP and Iba-1, respectively. Representative blot of Iba-1 is shown (A), see densitometric analysis (A1); representative blot of GFAP is shown (B), see densitometric analysis (B1). Cytosolic fractions of cortex tissue: representative blot of Iba-1 is shown (C), see densitometric analysis (C1); representative blot of GFAP is shown (D), see densitometric analysis (D1). Cytosolic fractions of other tissue: representative blot of Iba-1 is shown (E), see densitometric analysis (E1); representative blot of GFAP is shown (F), see densitometric analysis (F1). Two-way ANOVA test. *** p < 0.001 vs. non mTBI; ### p < 0.001 vs. TBI.
Figure 5
Figure 5
Effects of PF-475 on copper transporters expression after mTBI in hippocampus, cortex and other. Cytosolic fractions of hippocampus tissue were also used to evaluate copper transporters expression, such as CTR1, ATP7A and ATP7B. Representative blots of CTR1, ATP7A and ATP7B are shown (AC), see densitometric analysis (A1C1). Cytosolic fractions of cortex tissue: representative blots of CTR1, ATP7A and ATP7B are shown (DF), see densitometric analysis (D1F1). Cytosolic fractions of other tissue: representative blots of CTR1, ATP7A and ATP7B are shown (GI), see densitometric analysis (G1I1). Two-way ANOVA test. * p < 0.05, ** p < 0.01 and *** p < 0.001 vs. non mTBI; # p < 0.05 and ### p < 0.001 vs. TBI.
Figure 6
Figure 6
Effect of PF-475 treatment on behavioral function. The sucrose preference test showed that mTBI significantly reduced the percentage of sucrose preference, while PF-475 (2.5 and 5 mg/kg) restored it (A). The forced swim test demonstrated that the increased immobility time induced by mTBI in mice was decreased after treatment with PF-475 at doses of 2.5 and 5 mg/kg (B). The elevated plus maze test showed that PF-475 treatment (2.5 and 5 mg/kg) reduced depression symptoms after mTBI induction, reducing the number of entries and time spent in closed arms (D,F); PF-475 increased the number of entries and time spent in open arms (C,E) and reduced the time spent at center (G). Data was expressed as SD from 10 mice for each group. Two-way ANOVA test. *** p < 0.001 vs. non mTBI; ### p< 0.001 vs. mTBI.

Similar articles

Cited by

References

    1. Carroll L., Cassidy J.D., Peloso P., Borg J., von Holst H., Holm L., Paniak C., Pépin M. Prognosis for mild traumatic brain injury: Results of the who collaborating centre task force on mild traumatic brain injury. J. Rehabilit. Med. 2004;36:84–105. doi: 10.1080/16501960410023859. - DOI - PubMed
    1. Hellewell S.C., Beaton C.S., Welton T., Grieve S.M. Characterizing the Risk of Depression Following Mild Traumatic Brain Injury: A Meta-Analysis of the Literature Comparing Chronic mTBI to Non-mTBI Populations. Front. Neurol. 2020;11:350. doi: 10.3389/fneur.2020.00350. - DOI - PMC - PubMed
    1. Laker S.R. Epidemiology of Concussion and Mild Traumatic Brain Injury. PM&R. 2011;3:S354–S358. doi: 10.1016/j.pmrj.2011.07.017. - DOI - PubMed
    1. Scholten A.C., Haagsma J.A., Cnossen M.C., Olff M., Van Beeck E.F., Polinder S. Prevalence of and Risk Factors for Anxiety and Depressive Disorders after Traumatic Brain Injury: A Systematic Review. J. Neurotrauma. 2016;33:1969–1994. doi: 10.1089/neu.2015.4252. - DOI - PubMed
    1. McAllister T.W. Neurobiological consequences of traumatic brain injury. Dialog Clin. Neurosci. 2011;13:287–300. doi: 10.31887/DCNS.2011.13.2/tmcallister. - DOI - PMC - PubMed

MeSH terms

Substances