. 2023 Mar 30;12(7):1045.
doi: 10.3390/cells12071045.

Rat Ovarian Function Is Impaired during Experimental Autoimmune Encephalomyelitis

Affiliations

Rat Ovarian Function Is Impaired during Experimental Autoimmune Encephalomyelitis

Ana Milosevic et al. Cells. .

Abstract

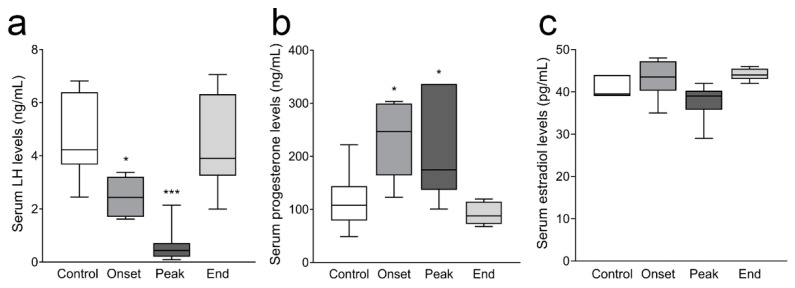
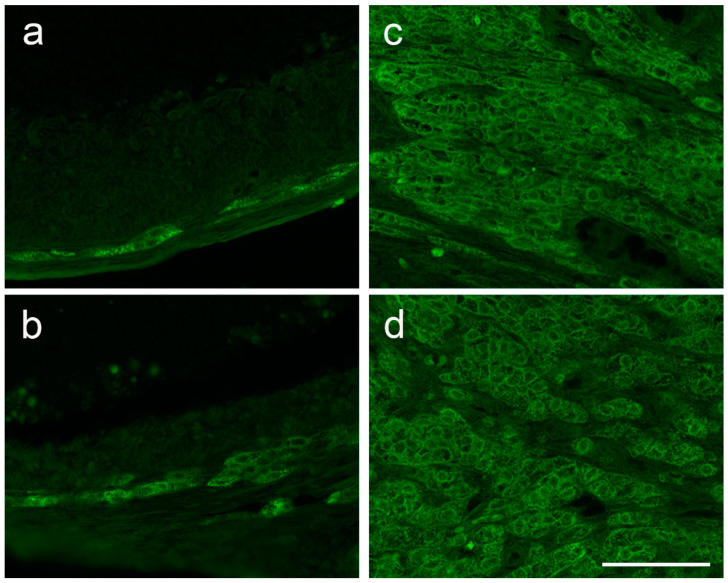
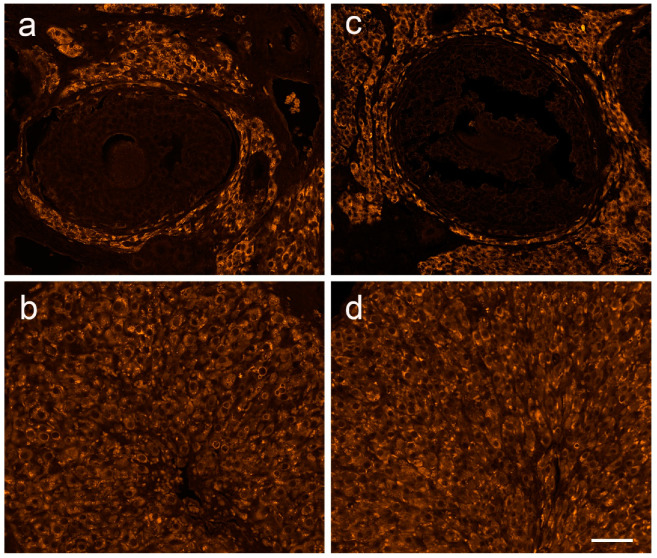
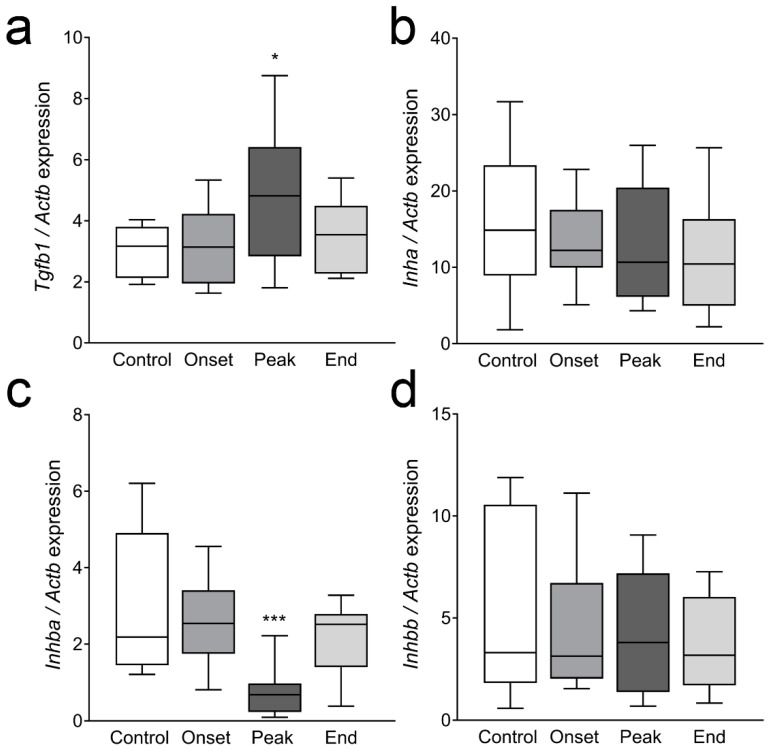
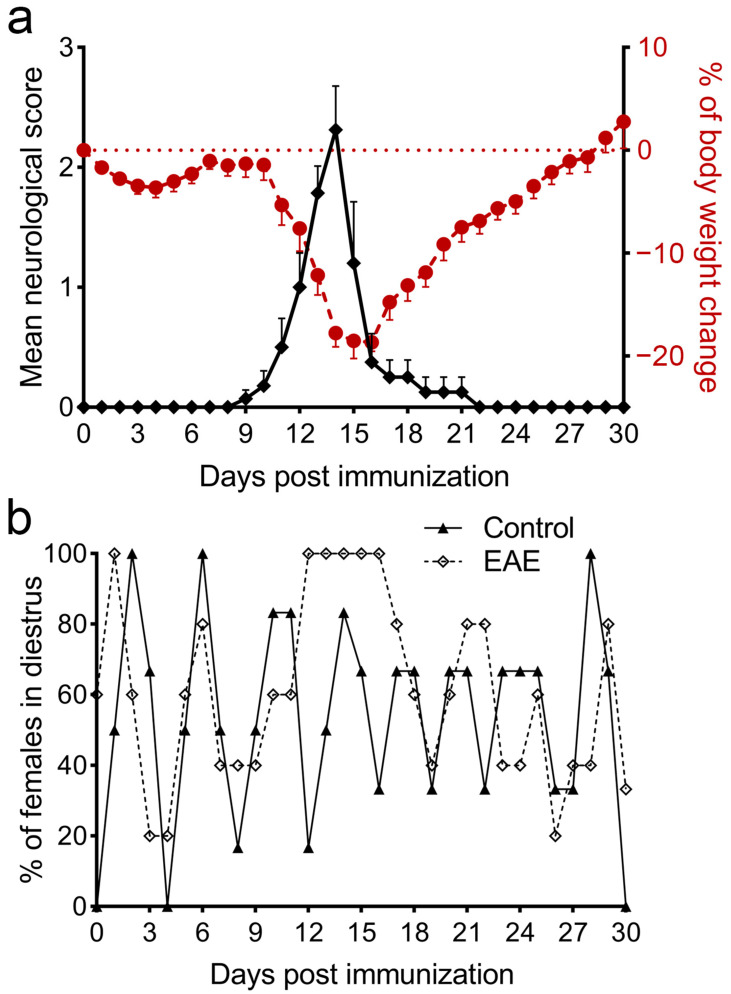
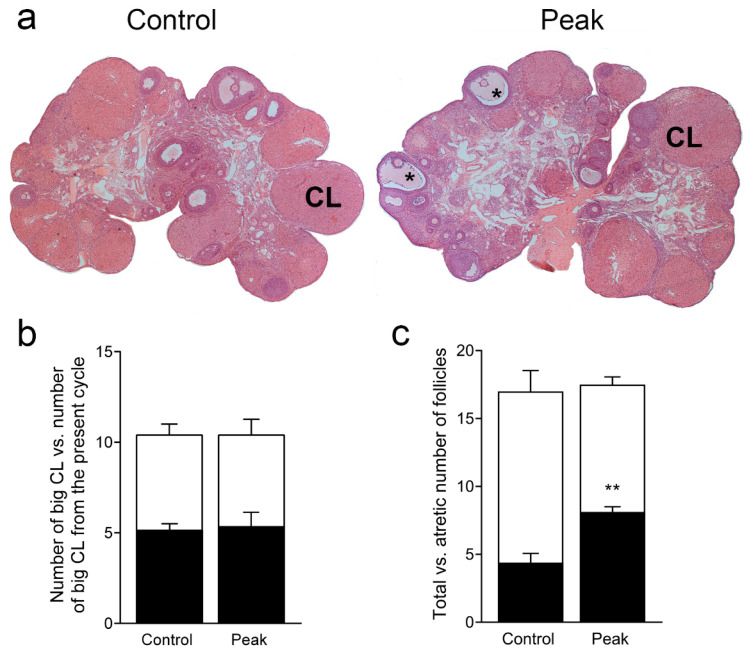
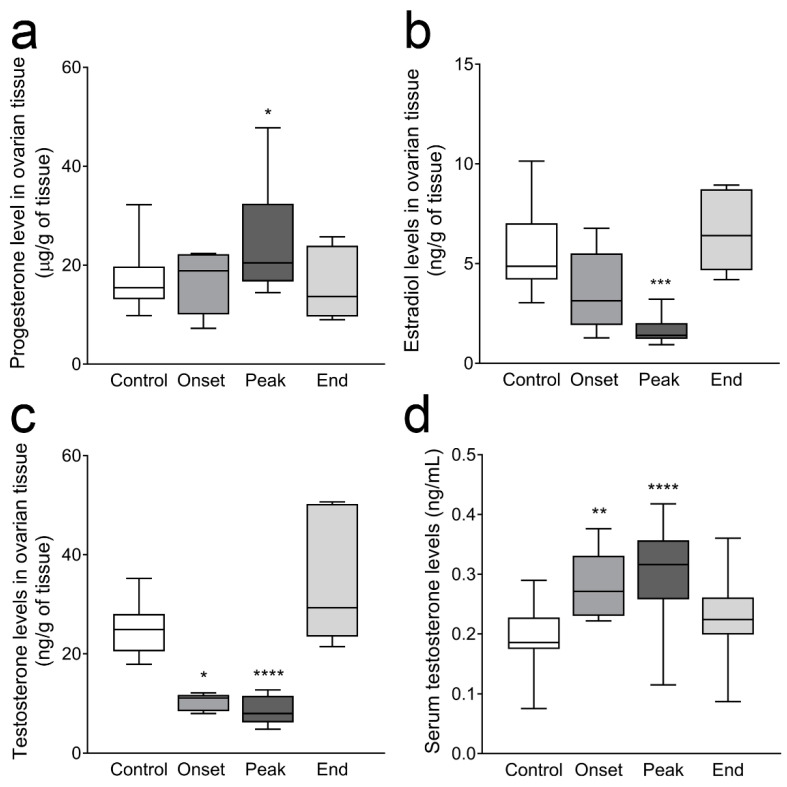
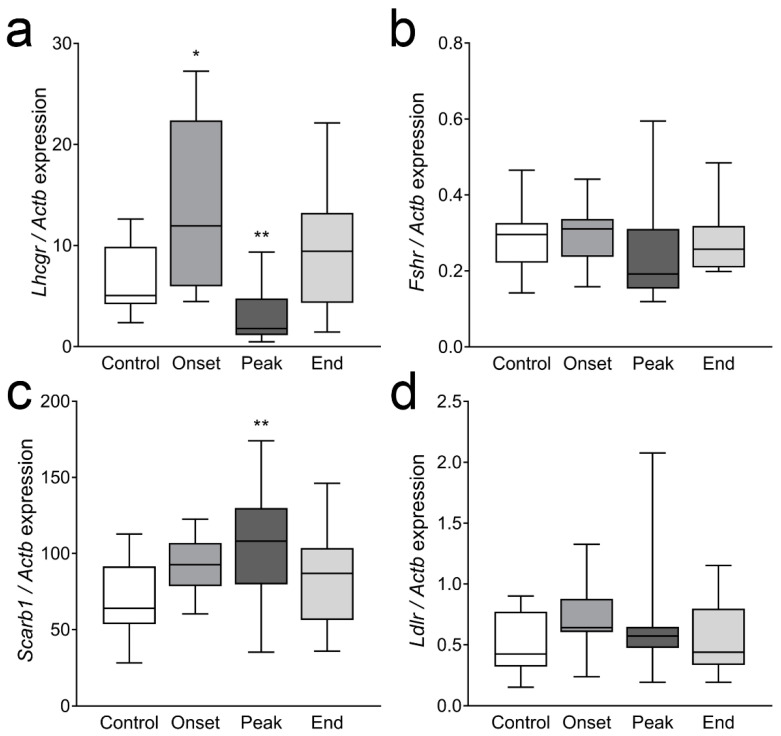
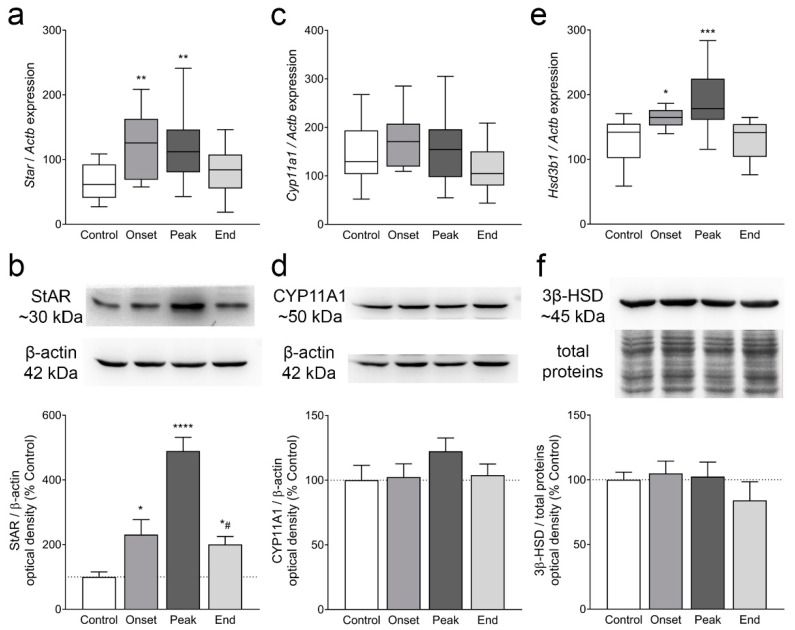
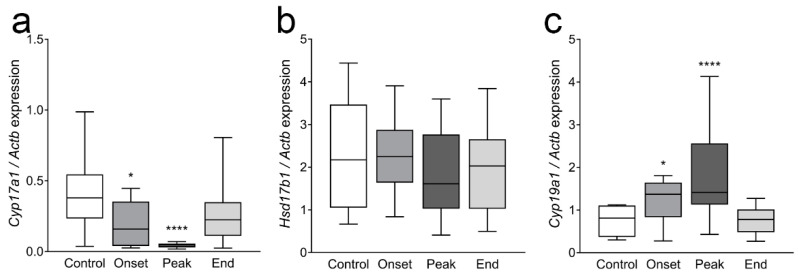
Multiple sclerosis (MS) is an autoimmune disease affecting the CNS and occurring far more prevalently in women than in men. In both MS and its animal models, sex hormones play important immunomodulatory roles. We have previously shown that experimental autoimmune encephalomyelitis (EAE) affects the hypothalamic-pituitary-gonadal axis in rats of both sexes and induces an arrest in the estrous cycle in females. To investigate the gonadal status in female rats with EAE, we explored ovarian morphometric parameters, circulating and intraovarian sex steroid levels, and the expression of steroidogenic machinery components in the ovarian tissue. A prolonged state of diestrus was recorded during the peak of EAE, with maintenance of the corpora lutea, elevated intraovarian progesterone levels, and increased gene and protein expression of StAR, similar to the state of pseudopregnancy. The decrease in CYP17A1 protein expression was followed by a decrease in ovarian testosterone and estradiol levels. On the contrary, serum testosterone levels were slightly increased. With unchanged serum estradiol levels, these results point at extra-gonadal sites of sex steroid biosynthesis and catabolism as important regulators of their circulating levels. Our study suggests alterations in the function of the female reproductive system during central autoimmunity and highlights the bidirectional relationships between hormonal status and EAE.

Keywords: EAE; multiple sclerosis; ovaries; progesterone; steroidogenesis; testosterone.


Conflict of interest statement

The authors declare no conflict of interest.

Figures

Figure A1
Figure A1
Serum levels of LH, progesterone, and estradiol. Luteinizing hormone, progesterone, and estradiol levels in serum samples were measured by ELISA. (a) LH (ng/mL); (b) progesterone (ng/mL); (c) estradiol (pg/mL). The results are presented as the median values of hormone concentrations. The horizontal line in each box plot indicates the median value, the box limits indicate quartile 1 and quartile 3, and the vertical whisker lines represent minimum and maximum values (n ≥ 5 animals/group). * p < 0.05, *** p < 0.001; Kruskal–Wallis test followed by uncorrected Dunn’s post hoc test.
Figure A2
Figure A2
Immunofluorescent labeling of LHR in ovarian tissue. Bouin-fixed, paraffin-embedded ovaries were cut on a microtome, and the slices were labeled using an LHR antibody. (a) Representative follicle from the ovary of the Control group, in the diestrus phase, showing a strong LHR-specific signal in the theca interna region of the follicle; (b) Representative follicle from the ovary of the Peak group, during prolonged diestrus, showing similar LHR staining in theca interna. LHR staining of stroma cells was similar in the (c) Control and (d) Peak ovaries. Scale bar: 50 µm applies to all.
Figure A3
Figure A3
Immunofluorescent labeling of 3β-HSD in ovarian tissue. Ovaries were fixed, embedded in paraffin, and cut on a microtome. Tissue slices were fluorescently labeled using a 3β-HSD antibody. Representative images of ovaries from the Control (in the diestrus phase) and Peak (in the state of prolonged diestrus) are shown. Similar 3β-HSD-positive labeling is observed in the theca layer of the follicles and stroma of ovaries from the (a) Control and (b) Peak groups. Lutein cells of the CL also show a 3β-HSD-specific signal in the cytoplasm, both in ovarian sections from the (c) Control and (d) Peak, with no gross differences in the signal intensity. Scale bar: 50 µm applies to all.
Figure A4
Figure A4
Ovarian gene expression of TGFβ family members. Ovaries from all experimental groups were isolated and processed for qPCR analysis. (a) Tgfb1; (b) Inha; (c) Inhba; (d) Inhbb. The results are plotted as the median values of relative expression of the target gene (compared to Actb). The horizontal line in each box plot indicates the median value, the box limits indicate quartile 1 and quartile 3, and the vertical whisker lines represent minimum and maximum values (n ≥ 11 animals/group). * p < 0.05, *** p < 0.001; Kruskal–Wallis test followed by uncorrected Dunn’s post hoc test.
Figure 1
Figure 1
EAE course and estrous cycle dynamics in female DA rats. Neurological score, body weight, and estrous cycle were monitored for 30 dpi. (a) Mean neurological score (± SEM; left Y axis, black diamonds) and mean change in body weight (± SEM; right Y axis, red circles) for every dpi from a representative experiment; (b) The mean percentage of females in diestrus for every dpi from the Control (n = 6, black triangles, full line) and EAE groups (n = 5, open diamonds, dashed line) in a representative experiment.
Figure 2
Figure 2
Ovarian morphology and the numbers of corpora lutea and follicles. Paraffin-embedded ovaries were cut and stained with hematoxylin-eosin. Morphometric parameters were analyzed. (a) Representative images of ovaries from the Control (left) and Peak (right) groups. CL—corpus luteum, *—atretic follicle; (b) Number of big (over 800 µm) corpora lutea (white bars) vs. number of big corpora lutea originating from the present cycle (black bars); (c) Total number of large follicles (white bars) vs. the number of large atretic follicles (black bars). The results (b,c) are presented as the mean number (± SEM) of CL or follicles counted from slices 350 µm apart throughout the whole ovary (n = 5 animals/group). ** p < 0.01; Student’s t-test.
Figure 3
Figure 3
Sex steroid hormone levels in ovarian steroid extracts and in serum. Progesterone, estradiol, and testosterone levels in steroid extracts and in serum were measured by ELISA. (a) Ovarian progesterone (µg/g of tissue); (b) ovarian estradiol (ng/g of tissue); (c) ovarian testosterone (ng/g of tissue); (d) serum testosterone (ng/mL). The results are plotted as the median values of the hormone concentration. The horizontal line in each box plot indicates the median value, the box limits indicate quartile 1 and quartile 3, and the vertical whisker lines represent minimum and maximum values (n ≥ 5 animals/group). * p < 0.05, ** p < 0.01, *** p < 0.001, **** p < 0.0001; Kruskal–Wallis test followed by uncorrected Dunn’s post hoc test.
Figure 4
Figure 4
Gene expression of the receptors for gonadotropins and receptors for cholesterol uptake in ovarian tissue. Ovarian tissue from each animal of the Control, Onset, Peak, and End groups was processed for mRNA isolation, reverse transcription, and gene expression analysis by qPCR. (a) Lhcgr, (b) Fshr, (c) Scarb1, (d) Ldlr. The results are presented as the median values of relative expression of the target gene (compared to Actb). The horizontal line in each box plot indicates the median value, the box limits indicate quartile 1 and quartile 3, and the vertical whisker lines represent minimum and maximum values (n ≥ 11 animals/group). * p < 0.05, ** p < 0.01; Kruskal–Wallis test followed by uncorrected Dunn’s post hoc test.
Figure 5
Figure 5
Gene and protein expression of StAR, CYP11A1, and 3β-HSD in ovarian tissue. One ovary from each animal was used for gene expression analyses by qPCR (a,c,e), while the other ovary was pooled for protein isolation and Western blot analysis (b,d,f). (a) Star; (b) StAR; (c) Cyp11a1; (d) CYP11A1; (e) Hsd3b1; (f) 3β-HSD. The results in (a,c,e) are plotted as the median values of relative expression of the target gene compared to Actb. The horizontal line in each box plot indicates the median value, the box limits indicate quartile 1 and quartile 3, and the vertical whisker lines represent minimum and maximum values (n ≥ 12 animals/group). Figures (b,d,f) are presented as representative blots (top panels) and quantification results (bottom panels). The results were calculated as the optical density of the target proteins relative to β-actin (b,d) or total proteins (f), normalized to the Control (presented as 100% ± SEM), and plotted as the mean change ± SEM (n ≥ 5 Western blot experiments). * p < 0.05, ** p < 0.01, *** p < 0.001, **** p < 0.0001, compared to the Control group; # p < 0.05, compared to the Peak group; Kruskal–Wallis test followed by uncorrected Dunn’s post hoc test.
Figure 6
Figure 6
The expression pattern of Cyp17a1, Hsd17b1, and Cyp19a1 in ovaries. One ovary from each animal of all experimental groups was processed for mRNA isolation, and gene expression was analyzed by qPCR. (a) Cyp17a1, (b) Hsd17b1, (c) Cyp19a1. The results are presented as the median values of relative expression of the target gene (compared to Actb). The horizontal line in each box plot indicates the median value, the box limits indicate quartile 1 and quartile 3, and the vertical whisker lines represent minimum and maximum values (n ≥ 12 animals/group). * p < 0.05, **** p < 0.0001; Kruskal–Wallis test followed by uncorrected Dunn’s post hoc test.
Figure 7
Figure 7
Immunofluorescent labeling of CYP17A1 in ovarian tissue. Bouin-fixed, paraffin-embedded ovaries were cut on a microtome, and the slices were labeled using CYP17A1 antibody. (a) Representative follicle from the ovary of the Control group, in the diestrus phase, showing a strong CYP17A1-specific signal in the theca interna region of the follicle (arrow). (b) Higher magnification of the theca interna region, from the Control group animal, showing CYP17A1+ staining in the cytoplasm of theca cells. (c) Ovarian tissue slice of a female from the Peak group, in prolonged diestrus lasting for four days, showing the absence of CYP17A1 labeling. (d) Higher magnification of ovarian tissue from the female of the Peak group. Scale bar: 100 µm—(c), also applies to (a); 20 µm—(d), also applies to (b).

Similar articles

Cited by

References

    1. Walton C., King R., Rechtman L., Kaye W., Leray E., Marrie R.A., Robertson N., La Rocca N., Uitdehaag B., van der Mei I., et al. Rising prevalence of multiple sclerosis worldwide: Insights from the Atlas of MS, third edition. Mult. Scler. 2020;26:1816–1821. doi: 10.1177/1352458520970841. - DOI - PMC - PubMed
    1. Magyari M., Koch-Henriksen N. Quantitative effect of sex on disease activity and disability accumulation in multiple sclerosis. J. Neurol. Neurosurg. Psychiatry. 2022;93:716–722. doi: 10.1136/jnnp-2022-328994. - DOI - PMC - PubMed
    1. Sparaco M., Bonavita S. The role of sex hormones in women with multiple sclerosis: From puberty to assisted reproductive techniques. Front. Neuroendocrinol. 2021;60:100889. doi: 10.1016/j.yfrne.2020.100889. - DOI - PubMed
    1. Confavreux C., Hutchinson M., Hours M.M., Cortinovis-Tourniaire P., Moreau T. Rate of pregnancy-related relapse in multiple sclerosis. Pregnancy in Multiple Sclerosis Group. N. Engl. J. Med. 1998;339:285–291. doi: 10.1056/NEJM199807303390501. - DOI - PubMed
    1. Langer-Gould A., Smith J.B., Albers K.B., Xiang A.H., Wu J., Kerezsi E.H., McClearnen K., Gonzales E.G., Leimpeter A.D., Van Den Eeden S.K. Pregnancy-related relapses and breastfeeding in a contemporary multiple sclerosis cohort. Neurology. 2020;94:e1939–e1949. doi: 10.1212/WNL.0000000000009374. - DOI - PMC - PubMed

Publication types