. 2023 Mar 31;12(7):1060.
doi: 10.3390/cells12071060.

High Glucose Activates Prolyl Hydroxylases and Disrupts HIF-α Signaling via the P53/TIGAR Pathway in Cardiomyocyte

Affiliations

High Glucose Activates Prolyl Hydroxylases and Disrupts HIF-α Signaling via the P53/TIGAR Pathway in Cardiomyocyte

Jian-Xiong Chen et al. Cells. .

Abstract

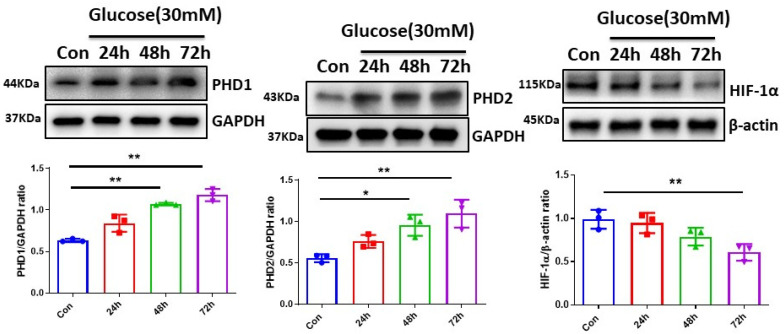
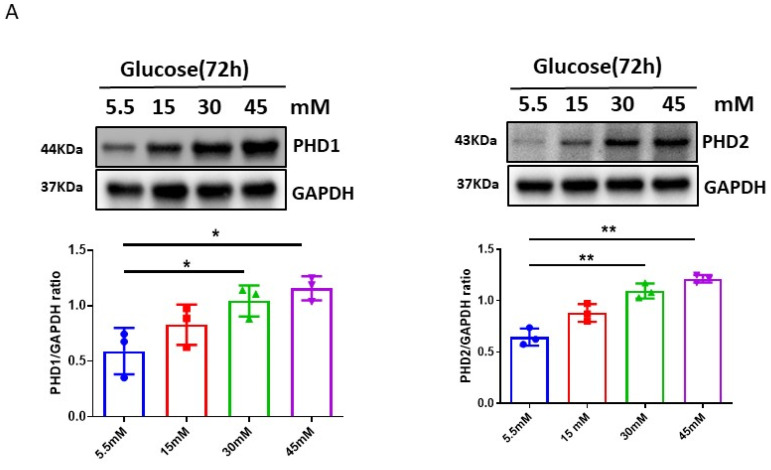
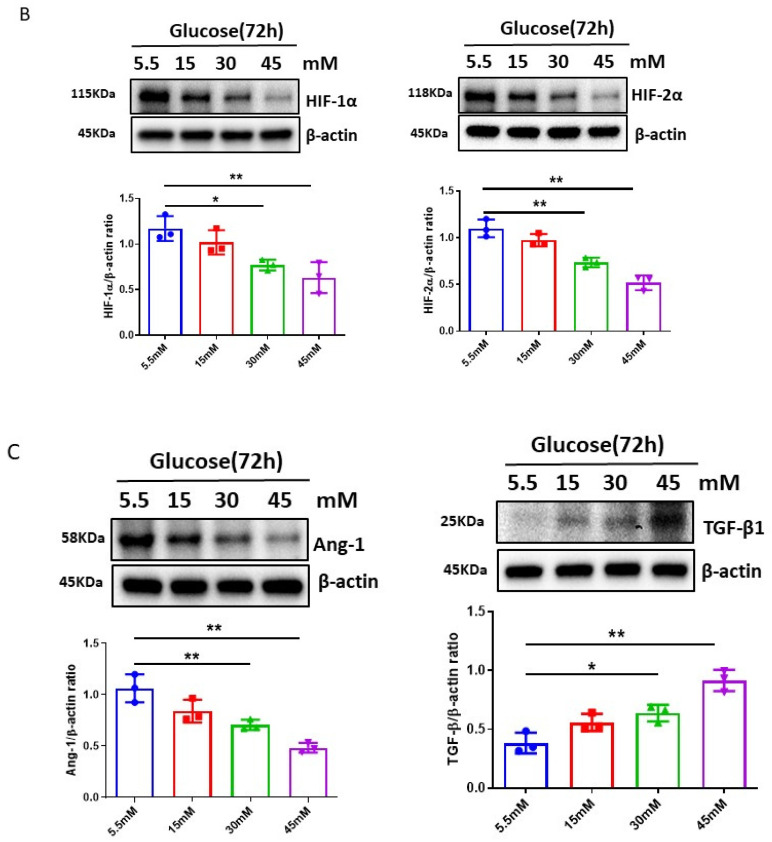
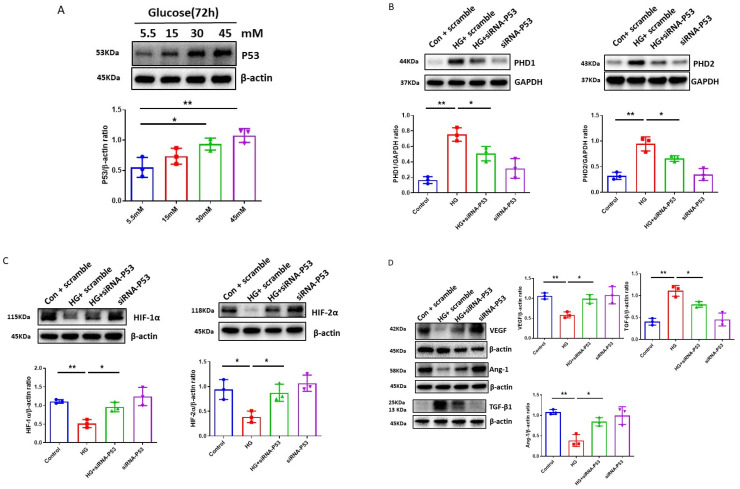
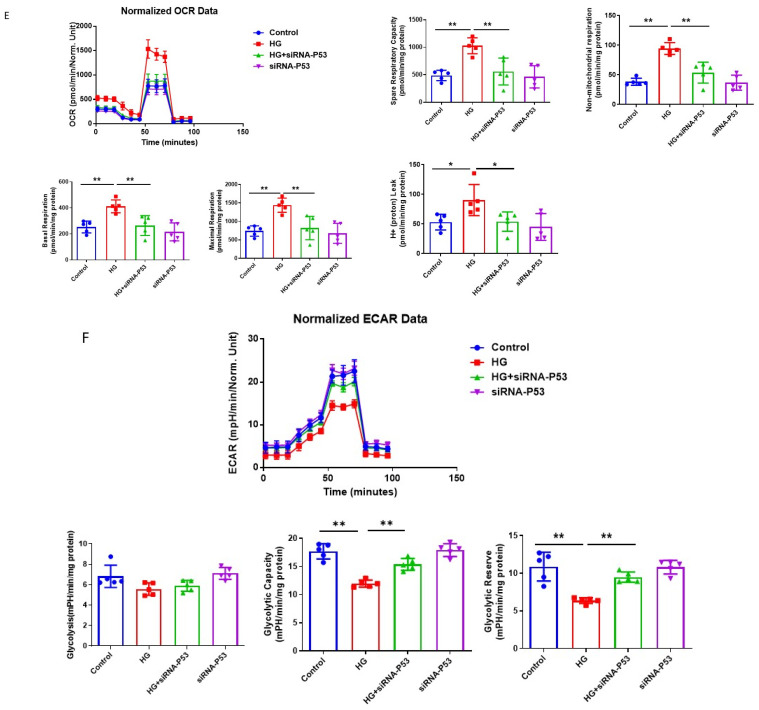
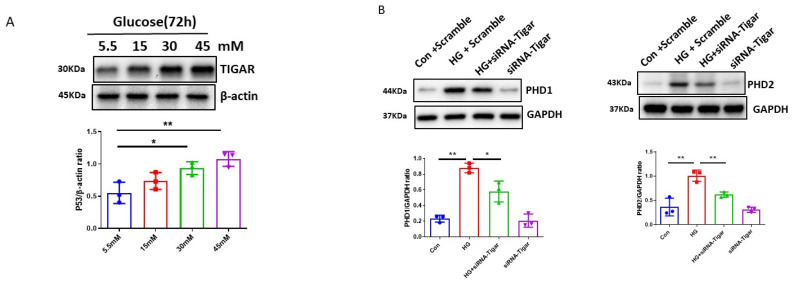
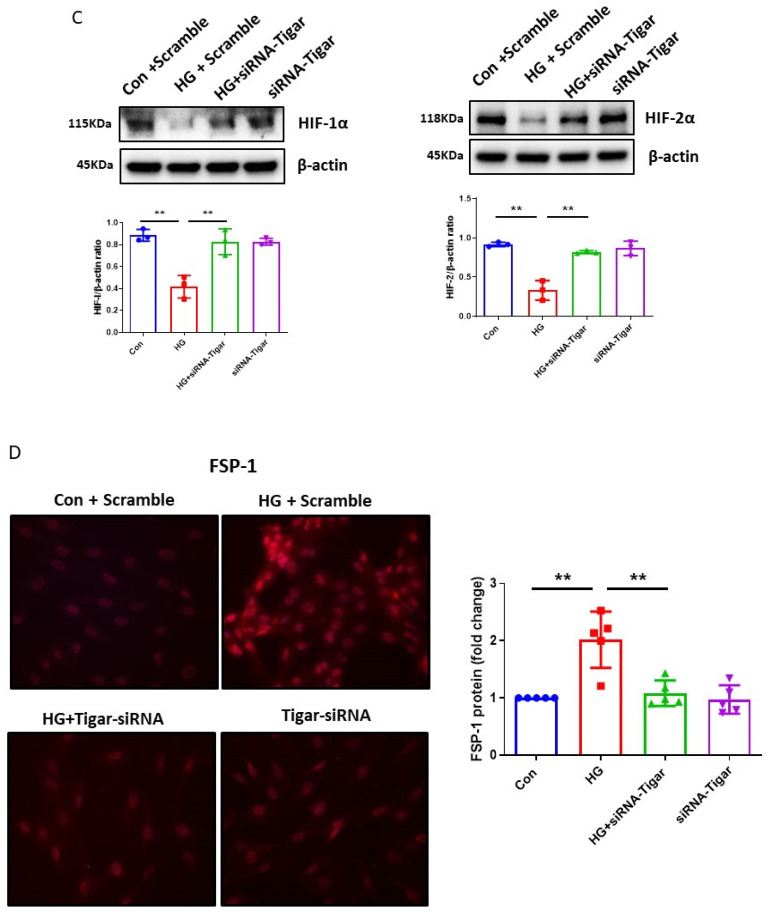
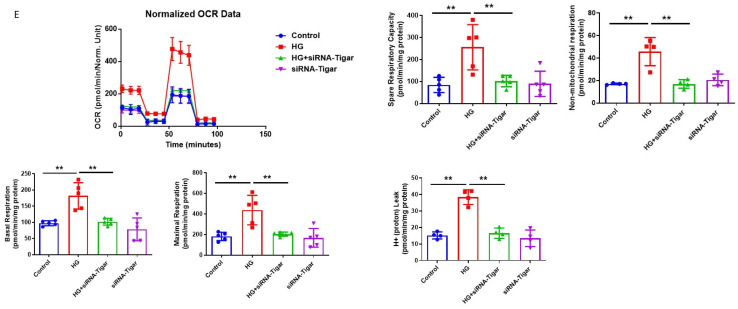
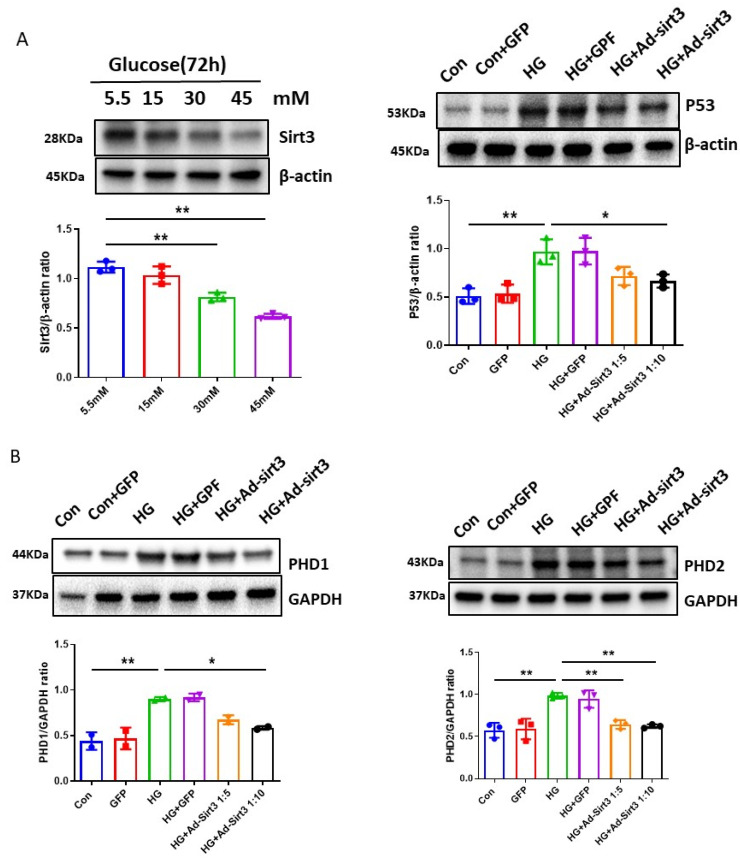
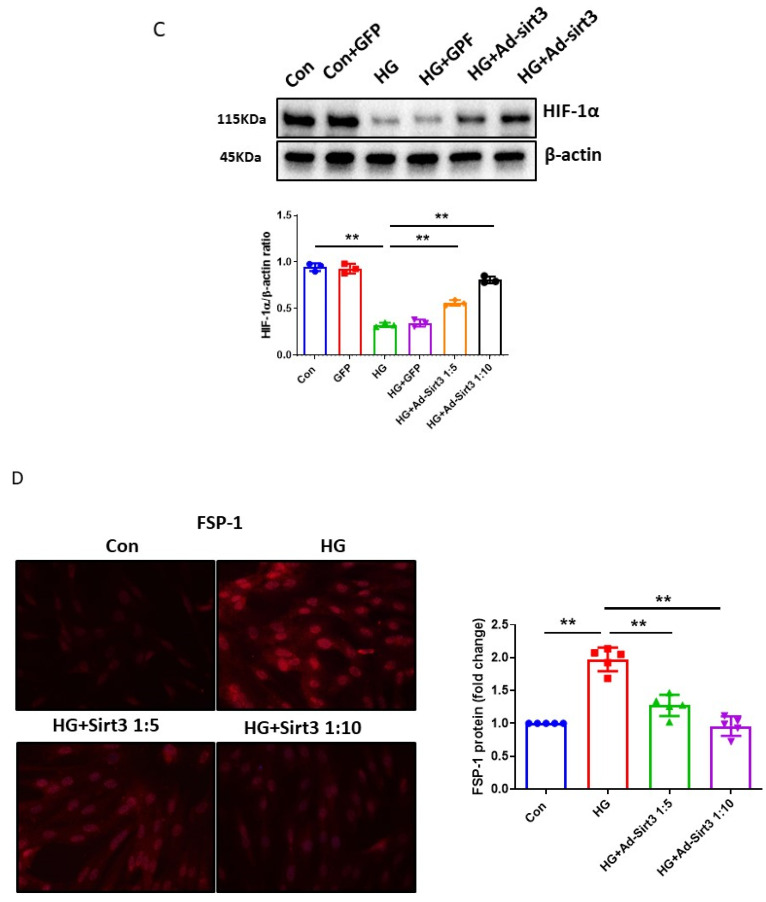
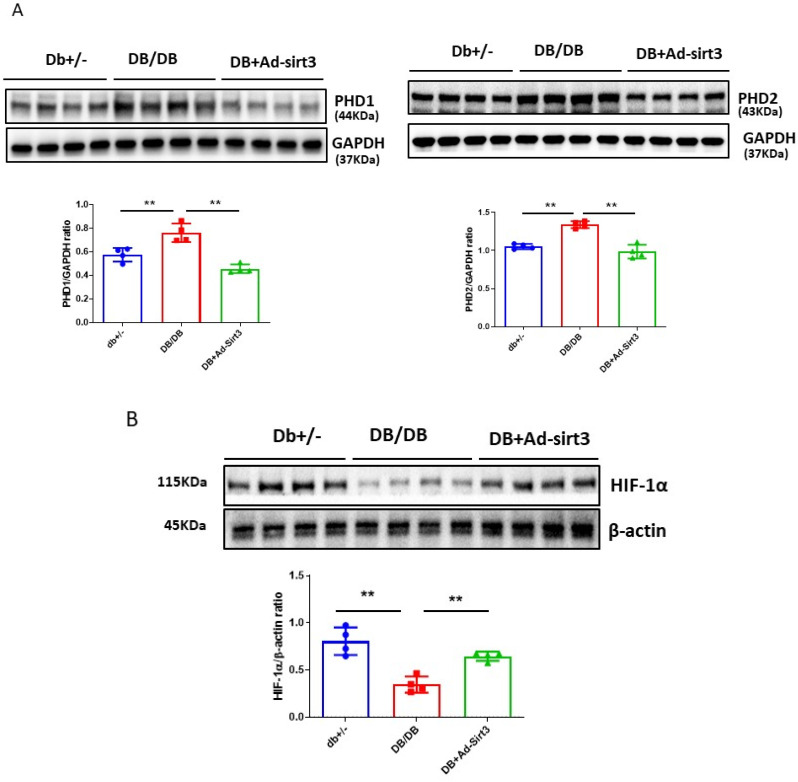
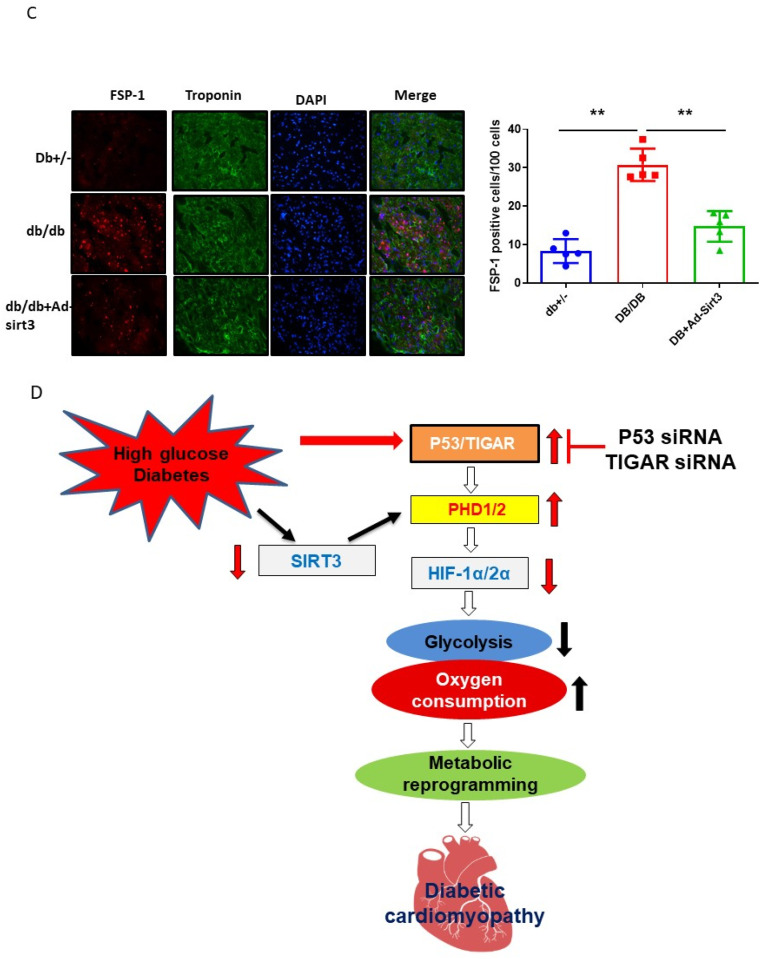
The induction of hypoxia tolerance has emerged as a novel therapeutic strategy for the treatment of ischemic diseases. The disruption of hypoxic signaling by hyperglycemia has been shown to contribute to diabetic cardiomyopathy. In this study, we explored the potential molecular mechanisms by which high glucose (HG) impairs hypoxia-inducible factor-α (HIF-α) signaling in cardiomyocytes. The exposure of H9c2 cell lines to HG resulted in time- and concentration-dependent decreases in HIF-1α and HIF-2α expression together with an increase in prolyl hydroxylase-1,2 (PHD1 and PHD2) expression, the main regulators of HIF-α destabilization in the heart. The exposure of H9c2 cells to normal glucose (5.5 mM) and high glucose (15, 30, and 45 mM) led to dose-dependent increases in p53 and TIGAR and a decrease in SIRT3 expression. The pretreatment of H9c2 with p53 siRNA to knockdown p53 attenuated PHD1 and PHD2 expression, thus significantly enhancing HIF-1α and HIF-2α expression in H9c2 cells under HG conditions. Interestingly, pretreatment with p53 siRNA altered H9c2 cell metabolism by reducing oxygen consumption rate and increasing glycolysis. Similarly, pretreatment with TIGAR siRNA blunted HG-induced PHD1 and PHD2 expression. This was accompanied by an increase in HIF-1α and HIF-2α expression with a reduction in oxygen consumption rate in H9c2 cells. Furthermore, pretreatment with adenovirus-SIRT3 (Ad-SIRT3) significantly reduced the HG-induced expression of p53 and PHDs and increased HIF-1α levels in H9c2 cells. Ad-SIRT3 treatment also regulated PHDs-HIF-1α levels in the hearts of diabetic db/db mice. Our study revealed a novel role of the HG-induced disruption of PHDs-HIF-α signaling via upregulating p53 and TIGAR expression. Therefore, the p53/TIGAR signaling pathway may be a novel target for diabetic cardiomyopathy.

Keywords: HIF-1α; TIGAR; glycolysis; high glucose; p53; prolyl hydroxylases (PHDs).


Conflict of interest statement

The authors declare no conflict of interest.

Figures

Figure 1
Figure 1
Time course of high-glucose (HG) upregulated PHDs expression and reduced HIF-1α expression in H9c2 cells. Western blot analysis demonstrating that exposure of H9c2 cells to HG (30 mM) for 24, 48, and 72 h resulted in a gradual increase in expression of PHD1 and PHD2 as compared to control normal glucose (5.5 mM). Densitometries showed a significant upregulation of PHD1 and PHD2 expression at 48 h and 72 h. Exposure of H9c2 cells to HG (30 mM) for 24, 48, and 72 h resulted in a gradual reduction in HIF-1α expression as compared to control normal glucose (5.5 mM). Densitometries showed a significant downregulation of HIF-1α expression at 72 h. All data represent mean ± SD (n = 3 per group, * p < 0.05 and ** p < 0.01). Circle, square and triangle were denoted the different experiment groups as indicated in the figures.
Figure 2
Figure 2
Dose response of high-glucose (HG)-induced upregulation of PHDs expression and reduction in HIF-α expression in H9c2 cells. (A) Western blot analysis revealing that exposure of H9c2 cells to different concentrations of glucose (15, 30, 45 mM) for 72 h resulted in a dose-dependent increase in expression of PHD1 and PHD2 as compared to normal glucose (5.5 mM). Densitometries showed a significant upregulation of PHD1 and PHD2 expression at 30 mM and 45 mM. (B) Exposure of H9c2 cells to different concentrations of glucose (15, 30, 45 mM) for 72 h resulted in a dose-dependent reduction in HIF-1α and HIF-2α expression as compared to normal glucose (5.5 mM). Densitometries showed a significant reduction of HIF-1α and HIF-2α expression at 30 mM and 45 mM. (C) Exposure of H9c2 cells to different concentrations of glucose (15, 30, 45 mM) for 72 h resulted in a gradual increase in expression of TGF-β, but a significant reduction in Ang-1 expression as compared to normal glucose (5.5 mM). Densitometries showed that the expression of Ang-1 and TGF-β1 was significant differences at 30 mM and 45 mM concentrations. All data represent mean ± SD (n = 3 per group, * p < 0.05 and ** p < 0.01). Circle, square and triangle were denoted the different experiment groups as indicated in the figures.
Figure 2
Figure 2
Dose response of high-glucose (HG)-induced upregulation of PHDs expression and reduction in HIF-α expression in H9c2 cells. (A) Western blot analysis revealing that exposure of H9c2 cells to different concentrations of glucose (15, 30, 45 mM) for 72 h resulted in a dose-dependent increase in expression of PHD1 and PHD2 as compared to normal glucose (5.5 mM). Densitometries showed a significant upregulation of PHD1 and PHD2 expression at 30 mM and 45 mM. (B) Exposure of H9c2 cells to different concentrations of glucose (15, 30, 45 mM) for 72 h resulted in a dose-dependent reduction in HIF-1α and HIF-2α expression as compared to normal glucose (5.5 mM). Densitometries showed a significant reduction of HIF-1α and HIF-2α expression at 30 mM and 45 mM. (C) Exposure of H9c2 cells to different concentrations of glucose (15, 30, 45 mM) for 72 h resulted in a gradual increase in expression of TGF-β, but a significant reduction in Ang-1 expression as compared to normal glucose (5.5 mM). Densitometries showed that the expression of Ang-1 and TGF-β1 was significant differences at 30 mM and 45 mM concentrations. All data represent mean ± SD (n = 3 per group, * p < 0.05 and ** p < 0.01). Circle, square and triangle were denoted the different experiment groups as indicated in the figures.
Figure 3
Figure 3
Knockdown of p53 ameliorates HG-induced disruption of PHDs-HIF-α signaling and improves metabolic metabolism in H9c2 cells. (A) Exposure of H9c2 cells to different concentrations of glucose (15, 30, 45 mM) for 72 h resulted in a dose-dependent increase in p53 levels as compared to normal glucose (5.5 mM). Densitometries showed a significant upregulation of p53 expression at 30 mM and 45 mM concentrations. Data represent mean ± SD (n = 3 per group, * p < 0.05 and ** p < 0.01). (B) Knockdown of p53 resulted in suppression of HG (30 mM)-induced upregulation of PHD1 and PHD2. Data represent mean ± SD (n = 3 per group, * p < 0.05 and ** p < 0.01). (C) Knockdown of p53 increased the expression of HIF-1α and HIF-2α in H9c2 cells under HG (30 mM) conditions. Data represent mean ± SD (n = 3 per group, * p < 0.05 and ** p < 0.01). (D) Knockdown of p53 upregulated the expression of Ang-1 and VEGF and downregulated TGF-β expression under HG (30 mM) conditions. Data represent mean ± SD (n = 3 per group, * p < 0.05 and ** p < 0.01). (E) Knockdown of p53 attenuated HG (30 mM)-induced increases in basal respiration, maximal respiration, spare respiration, non-mitochondrial respiration, and proton leak in H9c2 cell lines. All data represent mean ± SD (n = 5, * p < 0.05 and ** p < 0.01). (F) Knockdown of p53 rescued HG (30 mM)-induced impairments of glycolytic capacity and glycolytic reserve in H9c2 cell lines. All data represent mean ± SD (n = 5, ** p < 0.01). Circle, square and triangle were denoted the different experiment groups as indicated in the figures.
Figure 3
Figure 3
Knockdown of p53 ameliorates HG-induced disruption of PHDs-HIF-α signaling and improves metabolic metabolism in H9c2 cells. (A) Exposure of H9c2 cells to different concentrations of glucose (15, 30, 45 mM) for 72 h resulted in a dose-dependent increase in p53 levels as compared to normal glucose (5.5 mM). Densitometries showed a significant upregulation of p53 expression at 30 mM and 45 mM concentrations. Data represent mean ± SD (n = 3 per group, * p < 0.05 and ** p < 0.01). (B) Knockdown of p53 resulted in suppression of HG (30 mM)-induced upregulation of PHD1 and PHD2. Data represent mean ± SD (n = 3 per group, * p < 0.05 and ** p < 0.01). (C) Knockdown of p53 increased the expression of HIF-1α and HIF-2α in H9c2 cells under HG (30 mM) conditions. Data represent mean ± SD (n = 3 per group, * p < 0.05 and ** p < 0.01). (D) Knockdown of p53 upregulated the expression of Ang-1 and VEGF and downregulated TGF-β expression under HG (30 mM) conditions. Data represent mean ± SD (n = 3 per group, * p < 0.05 and ** p < 0.01). (E) Knockdown of p53 attenuated HG (30 mM)-induced increases in basal respiration, maximal respiration, spare respiration, non-mitochondrial respiration, and proton leak in H9c2 cell lines. All data represent mean ± SD (n = 5, * p < 0.05 and ** p < 0.01). (F) Knockdown of p53 rescued HG (30 mM)-induced impairments of glycolytic capacity and glycolytic reserve in H9c2 cell lines. All data represent mean ± SD (n = 5, ** p < 0.01). Circle, square and triangle were denoted the different experiment groups as indicated in the figures.
Figure 4
Figure 4
Knockdown of TIGAR improves cardiomyocyte PHDs-HIF-α signaling under HG conditions. (A) Western blot analysis revealing that exposure of H9c2 cells to different concentrations of glucose (15, 30, 45 mM) for 72 h resulted in a dose-dependent increase in TIGAR expression as compared to normal glucose (5.5 mM). Densitometries showed a significant upregulation of TIGAR expression at 30 mM and 45 mM concentrations. Data represent mean ± SD (n = 3 per group, * p < 0.05 and ** p < 0.01). (B) Knockdown of TIGAR blunted HG (30 mM)-induced upregulation of PHD1 and PHD2. Data represent mean ± SD (n = 3 per group, * p < 0.05 and ** p < 0.01). (C) Knockdown of TIGAR reversed HG (30 mM)-induced downregulation of HIF-1α and HIF-2α expression. Data represent mean ± SD (n = 3 per group, ** p < 0.01). (D) Immunostaining revealing that knockdown of TIGAR significantly reduced FSP-1 levels in H9c2 cells under HG (30 mM) conditions (20X Magnification). All data represent mean ± SD (n = 3 per group, ** p < 0.01). (E) Knockdown of TIGAR attenuated HG (30 mM)-induced increases in basal respiration, maximal respiration, spare respiration, non-mitochondrial respiration, and proton leak in H9c2 cell lines. All data represent mean ± SD (n = 5, ** p < 0.01). Circle, square and triangle were denoted the different experiment groups as indicated in the figures.
Figure 4
Figure 4
Knockdown of TIGAR improves cardiomyocyte PHDs-HIF-α signaling under HG conditions. (A) Western blot analysis revealing that exposure of H9c2 cells to different concentrations of glucose (15, 30, 45 mM) for 72 h resulted in a dose-dependent increase in TIGAR expression as compared to normal glucose (5.5 mM). Densitometries showed a significant upregulation of TIGAR expression at 30 mM and 45 mM concentrations. Data represent mean ± SD (n = 3 per group, * p < 0.05 and ** p < 0.01). (B) Knockdown of TIGAR blunted HG (30 mM)-induced upregulation of PHD1 and PHD2. Data represent mean ± SD (n = 3 per group, * p < 0.05 and ** p < 0.01). (C) Knockdown of TIGAR reversed HG (30 mM)-induced downregulation of HIF-1α and HIF-2α expression. Data represent mean ± SD (n = 3 per group, ** p < 0.01). (D) Immunostaining revealing that knockdown of TIGAR significantly reduced FSP-1 levels in H9c2 cells under HG (30 mM) conditions (20X Magnification). All data represent mean ± SD (n = 3 per group, ** p < 0.01). (E) Knockdown of TIGAR attenuated HG (30 mM)-induced increases in basal respiration, maximal respiration, spare respiration, non-mitochondrial respiration, and proton leak in H9c2 cell lines. All data represent mean ± SD (n = 5, ** p < 0.01). Circle, square and triangle were denoted the different experiment groups as indicated in the figures.
Figure 5
Figure 5
SIRT3 blunts HG-induced p53 expression and modulates hypoxic signaling in H9c2 cells. (A) Exposure of H9c2 cells to different concentrations of glucose (15, 30, 45 mM) for 72 h resulted in a dose-dependent reduction in SIRT3 expression as compared to normal glucose (5.5 mM). Densitometries showed a significant reduction of SIRT3 expression at 30 mM and 45 mM concentrations. Ad-SIRT3 treatment significantly attenuated the HG (30 mM)-induced p53 expression. All data represent mean ± SD (n = 3 per group, * p < 0.05 and ** p < 0.01). (B) Ad-SIRT3 treatment blunted HG (30 mM)-induced upregulation of PHD1 and PHD2. Data represent mean ± SD (n = 3 per group, * p < 0.05 and ** p < 0.01). (C) Ad-SIRT3 treatment resulted in a dose-dependent upregulation of HIF-1α expression in H9c2 cells under HG (30 mM) conditions. Data represent mean ± SD (n = 3 per group, ** p < 0.01). (D) Levels of FSP-1 protein immunostaining revealing that Ad-SIRT3 treatment significantly reduced FSP-1 levels in cultured H9c2 cells under HG (30 mM) conditions (20X Magnification). All data represent mean ± SD (n = 3 per group, ** p < 0.01). Circle, square and triangle were denoted the different experiment groups as indicated in the figures.
Figure 5
Figure 5
SIRT3 blunts HG-induced p53 expression and modulates hypoxic signaling in H9c2 cells. (A) Exposure of H9c2 cells to different concentrations of glucose (15, 30, 45 mM) for 72 h resulted in a dose-dependent reduction in SIRT3 expression as compared to normal glucose (5.5 mM). Densitometries showed a significant reduction of SIRT3 expression at 30 mM and 45 mM concentrations. Ad-SIRT3 treatment significantly attenuated the HG (30 mM)-induced p53 expression. All data represent mean ± SD (n = 3 per group, * p < 0.05 and ** p < 0.01). (B) Ad-SIRT3 treatment blunted HG (30 mM)-induced upregulation of PHD1 and PHD2. Data represent mean ± SD (n = 3 per group, * p < 0.05 and ** p < 0.01). (C) Ad-SIRT3 treatment resulted in a dose-dependent upregulation of HIF-1α expression in H9c2 cells under HG (30 mM) conditions. Data represent mean ± SD (n = 3 per group, ** p < 0.01). (D) Levels of FSP-1 protein immunostaining revealing that Ad-SIRT3 treatment significantly reduced FSP-1 levels in cultured H9c2 cells under HG (30 mM) conditions (20X Magnification). All data represent mean ± SD (n = 3 per group, ** p < 0.01). Circle, square and triangle were denoted the different experiment groups as indicated in the figures.
Figure 6
Figure 6
SIRT3 regulates hypoxic signaling in the hearts of diabetic db/db mice. (A) Western blot and densitometric analysis demonstrating that expression of PHD1 and PH2 were significantly increased, while treatment with Ad-SIRT3 (1 × 10⁹ PFU) significantly reduced the expression of PHD1 and PHD2 in the hearts of diabetic db/db mice. (B) Western blot and densitometric analysis showing that the expression of HIF-1α was significantly reduced, while treatment with Ad-SIRT3 (1 × 10⁹ PFU) significantly upregulated the expression of HIF-1α in the hearts of diabetic db/db mice. (C) Representative images and quantitative analysis showing that treatment with Ad-SIRT3 significantly reduced myocardial FSP-1 levels in db/db mice by FSP-1 immunostaining (Red, 10X Magnification). All data represent mean ± SD (n = 4 per group, ** p < 0.01). Circle, square and triangle were denoted the different experiment groups as indicated in the figures. (D). Novel role of p53/TIGAR signaling pathway in the regulation of hyperglycemia and diabetes-induced metabolic programming by a mechanism involvement of disruption of PHDs/HIFs. High glucose activates prolyl hydroxylases and disrupts HIF-α signaling, which alters cell metabolism by a reduction in glycolysis while increasing the oxygen consumption rate in cardiomyocytes. Mechanistically, knockdown of p53/TIGAR increased glycolysis under high glucose conditions and suppressed HG-induced increases in oxygen consumption rate. Therefore, targeting the p53/TIGAR axis may alleviate hyperglycemia-induced cardiomyopathy via a mechanism involving the hypoxic signaling pathway and reprogrammed cell metabolism.
Figure 6
Figure 6
SIRT3 regulates hypoxic signaling in the hearts of diabetic db/db mice. (A) Western blot and densitometric analysis demonstrating that expression of PHD1 and PH2 were significantly increased, while treatment with Ad-SIRT3 (1 × 10⁹ PFU) significantly reduced the expression of PHD1 and PHD2 in the hearts of diabetic db/db mice. (B) Western blot and densitometric analysis showing that the expression of HIF-1α was significantly reduced, while treatment with Ad-SIRT3 (1 × 10⁹ PFU) significantly upregulated the expression of HIF-1α in the hearts of diabetic db/db mice. (C) Representative images and quantitative analysis showing that treatment with Ad-SIRT3 significantly reduced myocardial FSP-1 levels in db/db mice by FSP-1 immunostaining (Red, 10X Magnification). All data represent mean ± SD (n = 4 per group, ** p < 0.01). Circle, square and triangle were denoted the different experiment groups as indicated in the figures. (D). Novel role of p53/TIGAR signaling pathway in the regulation of hyperglycemia and diabetes-induced metabolic programming by a mechanism involvement of disruption of PHDs/HIFs. High glucose activates prolyl hydroxylases and disrupts HIF-α signaling, which alters cell metabolism by a reduction in glycolysis while increasing the oxygen consumption rate in cardiomyocytes. Mechanistically, knockdown of p53/TIGAR increased glycolysis under high glucose conditions and suppressed HG-induced increases in oxygen consumption rate. Therefore, targeting the p53/TIGAR axis may alleviate hyperglycemia-induced cardiomyopathy via a mechanism involving the hypoxic signaling pathway and reprogrammed cell metabolism.

Similar articles

Cited by

References

    1. Jia G., Whaley-Connell A., Sowers J.R. Diabetic cardiomyopathy: A hyperglycaemia- and insulin-resistance-induced heart disease. Diabetologia. 2017;61:21–28. doi: 10.1007/s00125-017-4390-4. - DOI - PMC - PubMed
    1. Joubert M., Manrique A., Cariou B., Prieur X. Diabetes-related cardiomyopathy: The sweet story of glucose overload from epidemiology to cellular pathways. Diabetes Metab. 2018;45:238–247. doi: 10.1016/j.diabet.2018.07.003. - DOI - PubMed
    1. Singh R.M., Waqar T., Howarth F.C., Adeghate E., Bidasee K., Singh J. Hyperglycemia-induced cardiac contractile dysfunction in the diabetic heart. Heart Fail. Rev. 2017;23:37–54. doi: 10.1007/s10741-017-9663-y. - DOI - PubMed
    1. Di Filippo C., Marfella R., Cuzzocrea S., Piegari E., Petronella P., Giugliano D., Rossi F., D’Amico M. Hyper-glycemia in streptozotocin-induced diabetic rat increases infarct size associated with low levels of myocardial HO-1 during ischemia/reperfusion. Diabetes. 2005;54:803–810. doi: 10.2337/diabetes.54.3.803. - DOI - PubMed
    1. Frantz S., Calvillo L., Tillmanns J., Elbing I., Dienesch C., Bischoff H., Ertl G., Bauersachs J. Repetitive post-prandial hyperglycemia increases cardiac ischemia/reperfusion injury: Prevention by the alpha-glucosidase inhibitor acarbose. FASEB J. 2005;19:591–593. doi: 10.1096/fj.04-2459fje. - DOI - PubMed

Publication types