. 2023 Apr 3;12(7):1077.
doi: 10.3390/cells12071077.

New Findings: Hindlimb Unloading Causes Nucleocytoplasmic Ca2+ Overload and DNA Damage in Skeletal Muscle

Affiliations

New Findings: Hindlimb Unloading Causes Nucleocytoplasmic Ca2+ Overload and DNA Damage in Skeletal Muscle

Huajian Yang et al. Cells. .

Abstract

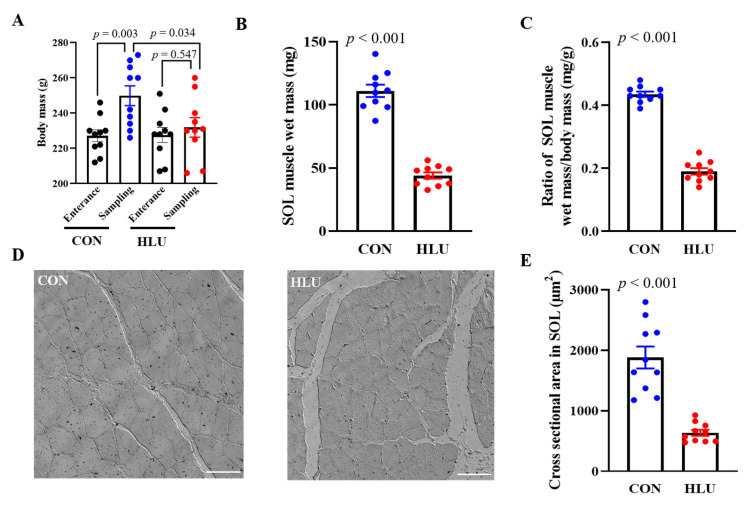
Disuse atrophy of skeletal muscle is associated with a severe imbalance in cellular Ca2+ homeostasis and marked increase in nuclear apoptosis. Nuclear Ca2+ is involved in the regulation of cellular Ca2+ homeostasis. However, it remains unclear whether nuclear Ca2+ levels change under skeletal muscle disuse conditions, and whether changes in nuclear Ca2+ levels are associated with nuclear apoptosis. In this study, changes in Ca2+ levels, Ca2+ transporters, and regulatory factors in the nucleus of hindlimb unloaded rat soleus muscle were examined to investigate the effects of disuse on nuclear Ca2+ homeostasis and apoptosis. Results showed that, after hindlimb unloading, the nuclear envelope Ca2+ levels ([Ca2+]NE) and nucleocytoplasmic Ca2+ levels ([Ca2+]NC) increased by 78% (p < 0.01) and 106% (p < 0.01), respectively. The levels of Ca2+-ATPase type 2 (Ca2+-ATPase2), Ryanodine receptor 1 (RyR1), Inositol 1,4,5-tetrakisphosphate receptor 1 (IP3R1), Cyclic ADP ribose hydrolase (CD38) and Inositol 1,4,5-tetrakisphosphate (IP3) increased by 470% (p < 0.001), 94% (p < 0.05), 170% (p < 0.001), 640% (p < 0.001) and 12% (p < 0.05), respectively, and the levels of Na+/Ca2+ exchanger 3 (NCX3), Ca2+/calmodulin dependent protein kinase II (CaMK II) and Protein kinase A (PKA) decreased by 54% (p < 0.001), 33% (p < 0.05) and 5% (p > 0.05), respectively. In addition, DNase X is mainly localized in the myonucleus and its activity is elevated after hindlimb unloading. Overall, our results suggest that enhanced Ca2+ uptake from cytoplasm is involved in the increase in [Ca2+]NE after hindlimb unloading. Moreover, the increase in [Ca2+]NC is attributed to increased Ca2+ release into nucleocytoplasm and weakened Ca2+ uptake from nucleocytoplasm. DNase X is activated due to elevated [Ca2+]NC, leading to DNA fragmentation in myonucleus, ultimately initiating myonuclear apoptosis. Nucleocytoplasmic Ca2+ overload may contribute to the increased incidence of myonuclear apoptosis in disused skeletal muscle.

Keywords: hindlimb unloading; nuclear Ca2+ regulation; nuclear apoptosis; skeletal muscle.


Conflict of interest statement

The authors declare no conflict of interest.

Figures

Figure 1
Figure 1
Changes of body and muscle mass and muscle cross-sectional area. (A) Changes of body mass. (B) Changes of SOL muscle wet mass. (C) Changes in ratio of SOL muscle wet mass/body mass. (D) Transection image of muscle fiber. (E) Changes in cross-sectional area (CSA). Each circle represented a value. n = 10. Data were analyzed by t-test. Data are shown as Mean ± SEM and considered statistically significant at p < 0.05. Scale bar, 60 μm.
Figure 2
Figure 2
Morphology and free Ca2+ fluorescence staining of isolated nucleus. (A) Isolated nuclei were stained by DAPI. Scale bar, 30 μm. (B) Single isolated myonucleus under bright field. Length and width were measured as shown. Scale bar, 5 μm. (C) Free Ca2+ in nuclear envelope showed green fluorescence after loading Cal-520 AM (excitation, 493 nm; emission, 515 nm). (D) Free Ca2+ in nucleocytoplasm showed green fluorescence after loading Cal-520 Dextran (excitation, 493 nm; emission, 515 nm). Scale bar, 5 μm. To observe the distribution of Ca2+ fluorescence from more directions, the one myonucleus was observed in three orthogonal planes (YX plane, YZ plane, and XZ plane, as indicated by crossed dashed lines).
Figure 3
Figure 3
Free Ca2+ levels in nuclear envelope and nucleocytoplasm. (A) Free Ca2+ in nuclear envelope was showed by loading Cal-520 AM. (B) Change in Ca2+ fluorescence intensity in nuclear envelope. (C) Free Ca2+ in nucleocytoplasm was showed by loading Cal-520 Dextran. (D) Change in Ca2+ fluorescence intensity in nucleocytoplasm. Each circle represented a value. Observe at least 10 nuclei per individual. n = 4. Data were analyzed by t-test. Data are shown as Mean ± SEM and considered statistically significant at p < 0.05. Scale bar, 5μm.
Figure 4
Figure 4
Relative expression level of Ca2+ transporters located on nuclear membrane and its regulatory proteins. (A) Representations of Calsequestrin 1 (CSQ1), Calnexin (CAX), Lamina protein B1 (LaminB1) in cellular protein fraction and nuclear protein fraction. C: cellular protein fraction; N: nuclear protein fraction. (B) Bands of Ca2+ transporters and its regulatory proteins. (CI) Relative expression levels of Ryanodine receptor 1 (RyR1), Inositol 1,4,5-tetrakisphosphate receptor 1 (IP3R1), Ca2+-ATPase type 2 (Ca2+-ATPase2), Na+/Ca2+ exchanger 3 (NCX3), Ca2+/calmodulin dependent protein kinase II (CaMK II), Protein kinase A (PKA) and Cyclic ADP ribose hydrolase (CD38), respectively. Each circle represented a value. n = 6–8. Data were analyzed by t-test. Data are shown as Mean ± SEM and considered statistically significant at p < 0.05.
Figure 5
Figure 5
Inositol 1,4,5-tetrakisphosphate (IP3) and Inositol 1,3,4,5-tetrakisphosphate (IP4) content in muscle. (A) Content of IP3. (B) Content of IP4. Each circle represented a value. n = 5–7. Data were analyzed by t-test. Data are shown as Mean ± SEM and considered statistically significant at p < 0.05.
Figure 6
Figure 6
Ratio of TUNEL-positive nuclei and TUNEL-positive nuclei co-localized with pericentriolar material 1 (PCM1). (A) TUNEL assay and PCM1 immunofluorescence staining on muscle slice. Nuclei were blue after DAPI staining. TUNEL-positive nuclei were red after TUNEL staining. PCM1 was green after immunofluorescence staining. Nuclei labeled with PCM1 were myonuclei. TUNEL-positive nuclei co-localized with PCM1 (apoptotic myonuclei) were indicated by an arrow, TUNEL-positive nuclei not co-localized with PCM1 (apoptotic non-myonuclei) were indicated by an arrowhead in Merge. (B) Co-localization results of TUNEL assay and PCM1 immunofluorescence staining on SOL muscle slice in the CON and HLU groups. (C,D) Percentage of TUNEL-positive nuclei to total nuclei, and percentage of TUNEL-positive nuclei co-localized with PCM1 to total TUNEL-positive nuclei. Each circle representde a value. n = 4. Data were analyzed by t-test. Data are shown as Mean ± SEM and considered statistically significant at p < 0.05. Scale bar, 10 μm.
Figure 7
Figure 7
Co-localization of DNase X with PCM1. DNase X and pericentriolar material 1 (PCM1) immunofluorescence double staining on muscle slice in the CON and HLU groups. Nuclei were blue after DAPI staining. DNase X was red and PCM1 was green after immunofluorescence staining. DNase X co-localized with PCM1 was indicated by an arrow, and DNase X not co-localized with PCM1 was indicated by an arrowhead. Scale bar, 10 μm.
Figure 8
Figure 8
Ratio of TUNEL-positive nuclei co-localized with DNase X. (A) TUNEL assay and immunofluorescence staining on muscle slice in the CON and HLU groups. Nuclei were blue after DAPI staining. TUNEL-positive nuclei were red after TUNEL staining. DNase X was green after immunofluorescence staining. TUNEL-positive nuclei co-localized with DNase X were indicated by an arrow, TUNEL-positive nuclei not co-localized with DNase X were indicated by an arrowhead in Merge. Rectangular box view in upper right corner was magnified view of selected area in the picture. (B) Percentage of TUNEL-positive nuclei co-localized with DNase X to total TUNEL-positive nuclei. Each circle represented a value. n = 4. Data were analyzed by t-test. Data are shown as Mean ± SEM and considered statistically significant at p < 0.05. Scale bar, 20 μm.
Figure 9
Figure 9
Activity of DNase X. (A) Lane 1: DNA Ladder (DNA molecular weight marker). Lane 2: Digestion solution which digested by muscle extraction (normal SOL muscle was extracted). Lane 3: Digestion solution which digested by the same muscle extraction as that in Lane 2 but containing 0.1 mM ZnCl2. Lane 4: Digestion solution which was digested by blank extraction (no muscle was extracted). (B) Lane 1–3: Digestion solution which was digested by CON-SOL muscle extraction containing 1 mM EGTA. Lane 4–6: Digestion solution which digested by HLU-SOL muscle extraction containing 1 mM EGTA. Lane 7: DNA Ladder. (C) Lane 1–6: Digestion solution which digested by the same muscle extraction as that in Picture B but without EGTA. Lane 7: DNA Ladder. The red line was the 1000 bp indicator line. (D) Levels of DNA fragmentation Each circle represented a value. n = 4. Data were analyzed by t-test. Data are shown as Mean ± SEM and considered statistically significant at p < 0.05.
Figure 10
Figure 10
Schematic representation of the regulation changes of nuclear Ca2+ after hindlimb unloading. ATP: Adenosine triphosphate; Ca2+: Calcium ion; [Ca2+]NC: Ca2+ level in nucleocytoplasm; [Ca2+]NE: Ca2+ level in nuclear envelope; [Ca2+]cyt: Ca2+ level in cytoplasm; cADPR: Cyclic ADP-ribose; CaMK II: Ca2+/calmodulin dependent protein kinase II; CD38: Cyclic ADP ribose hydrolase; DAG: Diacylglycerol; DNase X: Deoxyribonuclease X; INM: Inner nuclear membrane; IP3: Inositol 1,4,5-tetrakisphosphate; IP4: Inositol- 1,3,4,5-tetrakisphosphate; IP3K: Inositol 1,4,5-tetrakisphosphate Kinase; Na+: Sodium ion; NCX3: Na+/Ca2+ exchanger 3; NE: Nuclear envelope; NPC: Nuclear pore complex; ONM: Outer nuclear membrane; PKA: Protein Kinase A; PIP2: Phosphatidylinositol (4,5) bisphosphate; PLC: Phospholipase C; RyR1: Ryanodine receptor 1.

Similar articles

Cited by

References

    1. Gao Y., Arfat Y., Wang H., Goswami N. Muscle Atrophy Induced by Mechanical Unloading: Mechanisms and Potential Countermeasures. Front. Physiol. 2018;9:235. doi: 10.3389/fphys.2018.00235. - DOI - PMC - PubMed
    1. Sharlo K., Tyganov S.A., Tomilovskaya E., Popov D.V., Saveko A.A., Shenkman B.S. Effects of Various Muscle Disuse States and Countermeasures on Muscle Molecular Signaling. Int. J. Mol. Sci. 2021;23:468. doi: 10.3390/ijms23010468. - DOI - PMC - PubMed
    1. Wu X., Gao Y.F., Zhao X.H., Cui J.H. Effects of tetramethylpyrazine on nitric oxide synthase activity and calcium ion concentration of skeletal muscle in hindlimb unloading rats. Zhonghua Yi Xue Za Zhi. 2012;92:2075–2077. - PubMed
    1. Ingalls C.P., Wenke J.C., Armstrong R.B. Time course changes in [Ca2+]i, force, and protein content in hindlimb-suspended mouse soleus muscles. Aviat. Space Environ. Med. 2001;72:471–476. - PubMed
    1. Tomiya S., Tamura Y., Kouzaki K., Kotani T., Wakabayashi Y., Noda M., Nakazato K. Cast immobilization of hindlimb upregulates sarcolipin expression in atrophied skeletal muscles and increases thermogenesis in C57BL/6J mice. Am. J. Physiol. Regul. Integr. Comp. Physiol. 2019;317:649–661. doi: 10.1152/ajpregu.00118.2019. - DOI - PubMed

Publication types

Substances