. 2023 Apr 4;12(7):1079.
doi: 10.3390/cells12071079.

KDEL Receptor Trafficking to the Plasma Membrane Is Regulated by ACBD3 and Rab4A-GTP

Affiliations

KDEL Receptor Trafficking to the Plasma Membrane Is Regulated by ACBD3 and Rab4A-GTP

Chuanting Tan et al. Cells. .

Abstract

KDEL receptor-1 maintains homeostasis in the early secretory pathway by capturing and retrieving ER chaperones to the ER during heavy secretory activity. Unexpectedly, a fraction of the receptor is also known to reside in the plasma membrane (PM), although it is largely unknown exactly how the KDEL receptor gets exported from the Golgi and travels to the PM. We have previously shown that a Golgi scaffolding protein (ACBD3) facilitates KDEL receptor localization at the Golgi via the regulating cargo wave-induced cAMP/PKA-dependent signaling pathway. Upon endocytosis, surface-expressed KDEL receptor undergoes highly complex itineraries through the Golgi and the endo-lysosomal compartments, where the endocytosed receptor utilizes Rab14A- and Rab11A-positive recycling endosomes and clathrin-decorated tubulovesicular carriers. In this study, we sought to investigate the mechanism through which the KDEL receptor gets exported from the Golgi en route to the PM. We report here that ACBD3 depletion results in greatly increased trafficking of KDEL receptor to the PM via Rab4A-positive tubular carriers emanating from the Golgi. Expression of constitutively activated Rab4A mutant (Q72L) increases the surface expression of KDEL receptor up to 2~3-fold, whereas Rab4A knockdown or the expression of GDP-locked Rab4A mutant (S27N) inhibits KDEL receptor targeting of the PM. Importantly, KDELR trafficking from the Golgi to the PM is independent of PKA- and Src kinase-mediated mechanisms. Taken together, these results reveal that ACBD3 and Rab4A play a key role in regulating KDEL receptor trafficking to the cell surface.

Keywords: ACBD3; Golgi; KDEL receptor; Rab11A; Rab4A; plasma membrane.


Conflict of interest statement

The authors declare no conflict of interest.

Figures

Figure 1
Figure 1
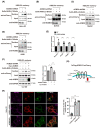
A small scale screening of regulators of KDELR transport to the plasma membrane. (A) Expression of hGH-GFP-KDEL causes decreased surface expression of KDELR1-mCherry compared to GFP or hGH-GFP control. HT1080 cells were co-transfected with KDEL-R1-mCherry and hGH-GFP-KDEL, hGH-GFP or GFP control and cell surface expression of KDEL-R1-mCherry was detected via cell surface biotinylation. The normalized cell surface level of KDEL-R-mCherry using densitometric analysis is shown at the bottom. Statistical analysis was performed using one-way ANOVA with a Tukey’s post hoc test (mean ± SD; **, p < 0.01; ***, p < 0.001). (B) HT1080 were co-transfected with KDEL-R1-mCherry and Src-WT or a constitutive active mutant E381G, followed by cell surface biotinylation. Biotinylated proteins were isolated using streptavidin-agarose and subjected to Western blot analysis using the indicated antibodies. The normalized cell surface level of KDEL-R-mCherry using densitometric analysis is shown at the bottom. Statistical analysis was performed using one-way ANOVA with a Tukey’s post hoc test (mean ± SD; n.s., not significant). (C) HT1080 cells co-transfected with KDEL-R1-mCherry and PKA-Cα-EGFP or EGFP control and cell surface expression of KDEL-R1-mCherry was detected via cell surface biotinylation. Normalized cell surface level of KDEL-R-mCherry using densitometric analysis is shown at the bottom. Statistical analysis was performed using Student’s t-test (mean ± SD; n.s., not significant). (D) HT1080 cells were transfected with ARFGAP1 siRNA for 48h, and then transfected with KDEL-R1-mCherry for 18 h, followed by cell surface biotinylation. Biotinylated proteins were isolated using streptavidin-agarose and subjected to Western blot analysis using the indicated antibodies. The normalized cell surface level of KDEL-R-mCherry using densitometric analysis is shown at the bottom. Statistical analysis was performed using Student’s t-test (mean ± SD; n.s., not significant). (E) WT or ACBD3-KO HT1080 cells were transfected with KDEL-R1-mCherry for 18 h, followed by cell surface biotinylation. Biotinylated proteins were isolated using streptavidin-agarose and subjected to Western blot analysis using the indicated antibodies. The normalized cell surface level of KDEL-R-mCherry using densitometric analysis is shown at the bottom. Statistical analysis was performed using Student’s t-test (mean ± SD; *, p < 0.05).
Figure 2
Figure 2
ACBD3 depletion causes significantly increased expression of KDEL-R1 on the cell surface. (AD) Cell surface expression of KDEL-R1-mCherry is significantly increased in a number of ACBD3 depleted cell lines, compared to the control cells. Cell surface expression of KDEL-R1-mCherry was probed via cell surface biotinylation protocol using sulfo-NHS-LC-biotin. We used a shRNA/lentiviral transduction method to establish four mammalian cell lines, for which ACBD3 was stably knocked down, as described in the Methods. Briefly, WT or ACBD3 depleted cells were transfected with KDEL-R1-mCherry for 18 h, followed by cell surface biotinylation. Biotinylated proteins were isolated using streptavidin-agarose and subjected to Western blot analysis using the indicated antibodies. (E) Bar graphs showing normalized cell surface expression of KDEL-R-mCherry in various cell lines using densitometric analysis. Statistical analysis was performed using one-way ANOVA with a Tukey’s post hoc test (mean ± SD; *, p < 0.05; **, p < 0.01). (F) Cell surface expression of KDEL-R1-mCherry is significantly increased in ACBD3 depleted U-2 OS cells, compared to the control cells, which could be restored by the exogenous expression of RNAi-resistant myc-ACBD3. The normalized cell surface level of KDEL-R-mCherry using densitometric analysis is shown on the right. Statistical analysis was performed using one-way ANOVA with a Tukey’s post hoc test (mean ± SD; **, p < 0.01; ***, p < 0.001) (G) Schematic representation of 3xFLAG-KDEL-R1-mCherry. A 3xFLAG tag was inserted into the first luminal (extracellular) loop of KDEL-R1. (H) Increased cell surface staining of 3xFLAG-KDEL-R1 observed via confocal microscopy in ACBD3-knockdown/knockout HeLa S3 cells. Control or ACBD3-knockdown/knockout HeLa S3 cells were co-transfected with 3xFLAG-KDEL-R1-mCherry and YFP-GL-GPI, which served as a cell surface marker, for 18 h. The living cells were stained using anti-FLAG tag antibody at 4 °C and fixed with 4% paraformaldehyde, followed by staining with the secondary antibodies. Scale bars = 10 µm. Bar graphs showing the percentage of cells with surface staining of KDEL-R1 in 3xFLAG-KDEL-R1-mCherry transfected HeLa-S3 cells. N = 30 cells. Statistical analysis was performed using one-way ANOVA with a Tukey’s post hoc test (mean ± SD; ****, p < 0.0001).
Figure 3
Figure 3
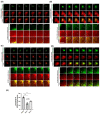
ACBD3 depletion results in increased trafficking of KDEL receptor to the PM via Rab4A-positive tubular carriers at the Golgi. (AD) To examine the post-Golgi trafficking itineraries of KDEL receptor to the PM, WT or ACBD3-depleted HT1080 cells were co-transfected with photoactivatable KDELR1-PA-GFP and mCherry-Rab4A/14 plasmids for 18 h. The KDELR1-PA-GFP in the Golgi were then activated by selecting an ROI of the mCherry-Rab4A/14 perinuclear region for intense 405 nm laser irradiation, and the transport out of the Golgi was monitored via live cell imaging acquired every 5 s for 5 min. Imaging sequences prior to photoactivation (−10 s) and immediately after photoactivation (0 s), and the indicated time points following photoactivation, are presented here. Magnified regions of interest (indicated by white boxes) from WT and ACBD3-KO cells at the indicated time points show Golgi-derived tubules which are highlighted by white arrowheads. Scale bars = 5 µm. (E) Bar graphs showing the percentage of KDELR1/Rab tubules present in ACBD3-depleted HT1080 cells. N = 15 cells. Statistical analysis was performed using one-way ANOVA with a Tukey’s post hoc test (mean ± SD; ****, p < 0.0001).
Figure 4
Figure 4
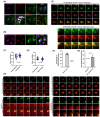
Overexpression of a constitutive active mutant Rab4A-Q72L promotes KDEL-R1 trafficking to the PM via Rab4A-positive tubular carriers at the Golgi. (AD) To examine the Golgi localization of Rab4A, HeLa cells were transfected with human EGFP-Rab4A plasmids for 18 h, followed by staining with anti-GM130 (cis-Golgi) and anti-EEA1 (early endosome) (A) or anti-ACBD3 and TGN46 (trans-Golgi network) (B). Scale bars = 10 µm. Co-localization (Pearson’s R) was determined. N = 22 for (C), N = 48 for (D). (E,F) To examine the role of Rab4A in promoting KDEL-R1 trafficking to the PM from Golgi, WT HT1080 cells were co-transfected with photoactivatable KDELR1-PA-GFP and mCherry-Rab4A-Q72L plasmids for 18 h. The KDELR1-PA-GFP in the Golgi were then activated by selecting an ROI of the mCherry-Rab4A Golgi region for intense 405 nm laser irradiation and the transport out of the Golgi was monitored by live cell imaging acquired every 5 s for 5 min. Imaging sequences prior to photoactivation (−10 s) and immediately after photoactivation (0 s), and the indicated time points following photoactivation are presented here. Magnified regions of interest (indicated by white boxes) at the indicated time points show Golgi-derived tubules which are highlighted by white arrowheads. Scale bars = 5 µm. Bar graphs showing the percentage of KDELR1/Rab tubules present in HT1080 cells. N = 15 cells. (G,H) HeLa WT or ACBD3-KO cells were transfected with mCherry-Rab4A and GT-GFP, overnight. Live cell imaging of mCherry-Rab4A and GT-GFP were performed using a high-resolution airyscan confocal microscope. Magnified regions of interest (indicated by white boxes) at the indicated time points show Golgi-derived tubules which are highlighted by white arrowheads. Scale bars = 5 µm. Bar graphs showing the percentage of Rab4A tubules present in HeLa WT or ACBD3-KO cells. N = 20 cells. Statistical analysis was performed using two-tailed, paired t-test (mean ± SD; ****, p < 0.0001).
Figure 5
Figure 5
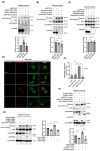
Rab4A plays a crucial role in the cell surface expression of KDEL-R1. (AC) The cell surface expression of KDEL-R1-mCherry is significantly increased in HT1080 cells when overexpressing the constitutive active mutant Rab4A-Q72L, but not Rab11A-Q70L or Rab14A-Q70L, compared to the control cells. HT1080 cells were transfected with KDEL-R1-mCherry and indicated Rab plasmids for 18 h, followed by cell surface biotinylation. Biotinylated proteins were isolated using streptavidin-agarose and subjected to Western blot analysis using the indicated antibodies. The normalized cell surface level of KDEL-R-mCherry using densitometric analysis is shown at the bottom. Statistical analysis was performed using one-way ANOVA with a Tukey’s post hoc test (mean ± SD; n.s., not significant; *, p < 0.05) (D) Increased cell surface staining of 3xFLAG-KDEL-R1 observed via confocal microscopy in HeLa S3 cells expressing constitutive active mutant Rab4A-Q72L, compared to the cells expressing pEGFP-C1 vector, EGFP-Rab7-Q67L or EGFP-Rab4A-S27N. HeLa S3 cells were co-transfected with 3xFLAG-KDEL-R1-mCherry and pEGFP-C1 vector or indicated Rab plasmids for 18 h. The living cells were stained by anti-FLAG tag antibody at 4 °C and fixed with 4% paraformaldehyde, followed by staining with the secondary antibodies. Scale bars = 5 µm. (E) Bar graphs showing the percentage of cells with surface staining of KDEL-R1 in 3xFLAG-KDEL-R1-mCherry transfected HeLa-S3 cells. N = 40 cells. Statistical analysis was performed using one-way ANOVA with a Tukey’s post hoc test (mean ± SD; ****, p < 0.0001). (F) Cell surface expression of KDEL-R1-mCherry is decreased in both HT1080 WT or ACBD3 knockdown cells when overexpressing a dominant negative mutant Rab4A-S27N. HT1080 cells were transfected with control siRNA or ACBD3 siRNA for 48 h. Then, cells were transfected with KDEL-R1-mCherry and EGFP-Rab4A-S27N or pEGFP-C1 vector plasmids for 18 h, followed by cell surface biotinylation. Biotinylated proteins were isolated using streptavidin-agarose and subjected to Western blot analysis using the indicated antibodies. The normalized cell surface level of KDEL-R-mCherry using densitometric analysis is shown at the bottom. Statistical analysis was performed using one-way ANOVA with a Tukey’s post hoc test (mean ± SD; *, p < 0.05; ***, p < 0.001). (G) Cell surface expression of KDEL-R1-mCherry is decreased in both HT1080 WT or ACBD3 knockdown cells when transfected with Rab4A siRNA. HT1080 cells were transfected with Rab4A and control siRNA or Rab4A and ACBD3 siRNA for 48h. Then, cells were transfected with KDEL-R1-mCherry for 18 h, followed by cell surface biotinylation. Biotinylated proteins were isolated using streptavidin-agarose and subjected to Western blot analysis using the indicated antibodies. The normalized cell surface level of KDEL-R-mCherry using densitometric analysis is shown at the bottom. Statistical analysis was performed using one-way ANOVA with a Tukey’s post hoc test (mean ± SD; *, p < 0.05; ***, p < 0.001; ****, p < 0.0001).
Figure 6
Figure 6
Schematic diagram depicting the proposed role of ACBD3 and Rab4A in controlling KDELR trafficking to the PM.

Similar articles

References

    1. Warren G., Malhotra V. The organisation of the Golgi apparatus. Curr. Opin. Cell Biol. 1998;10:493–498. doi: 10.1016/S0955-0674(98)80064-1. - DOI - PubMed
    1. Kulkarni-Gosavi P., Makhoul C., Gleeson P.A. Form and function of the Golgi apparatus: Scaffolds, cytoskeleton and signalling. FEBS Lett. 2019;593:2289–2305. doi: 10.1002/1873-3468.13567. - DOI - PubMed
    1. Munro S., Pelham H.R. A C-terminal signal prevents secretion of luminal ER proteins. Cell. 1987;48:899–907. doi: 10.1016/0092-8674(87)90086-9. - DOI - PubMed
    1. Pelham H.R. Evidence that luminal ER proteins are sorted from secreted proteins in a post-ER compartment. EMBO J. 1988;7:913–918. doi: 10.1002/j.1460-2075.1988.tb02896.x. - DOI - PMC - PubMed
    1. Lewis M.J., Sweet D.J., Pelham H.R. The ERD2 gene determines the specificity of the luminal ER protein retention system. Cell. 1990;61:1359–1363. doi: 10.1016/0092-8674(90)90699-F. - DOI - PubMed

Publication types

MeSH terms